


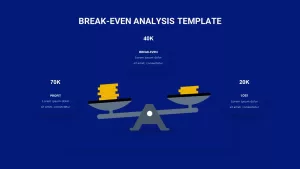
Break-Even Analysis Template


- Version 1.0.0
- Download 26
- File Size 0.00 KB
- File Count 1
- Create Date September 16, 2022
- Last Updated November 21, 2022
Break-Even Analysis Template
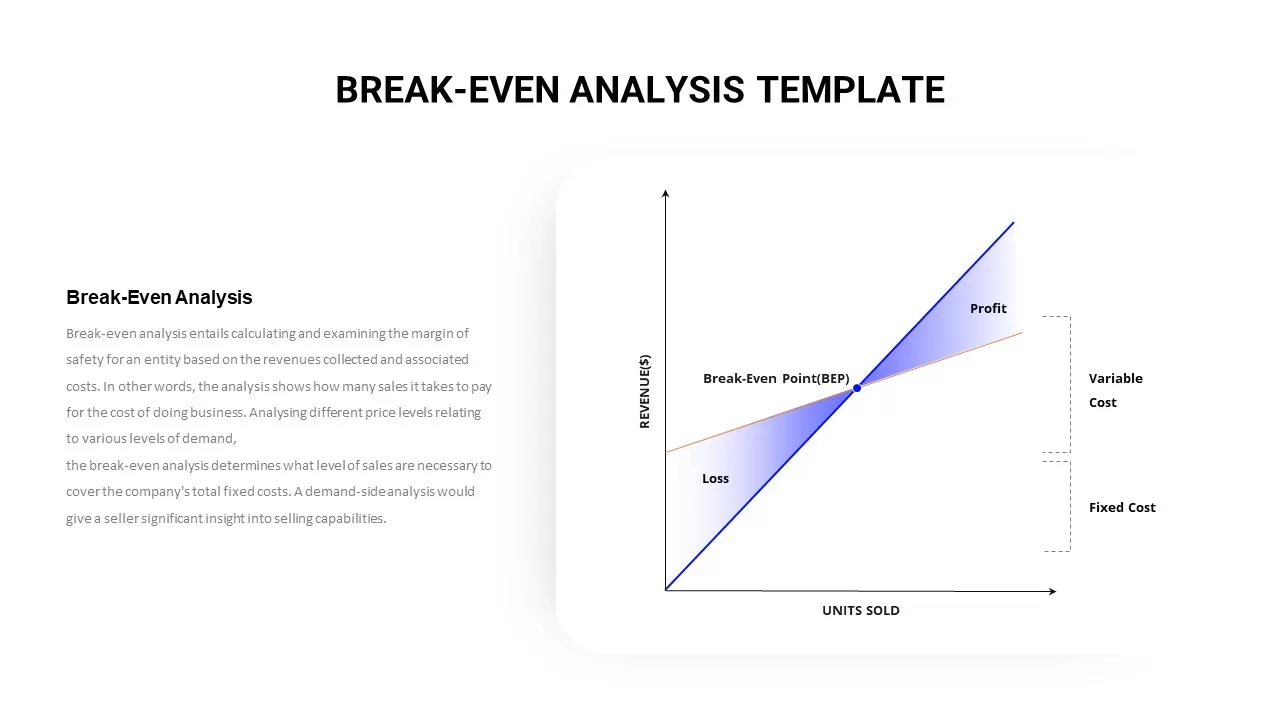
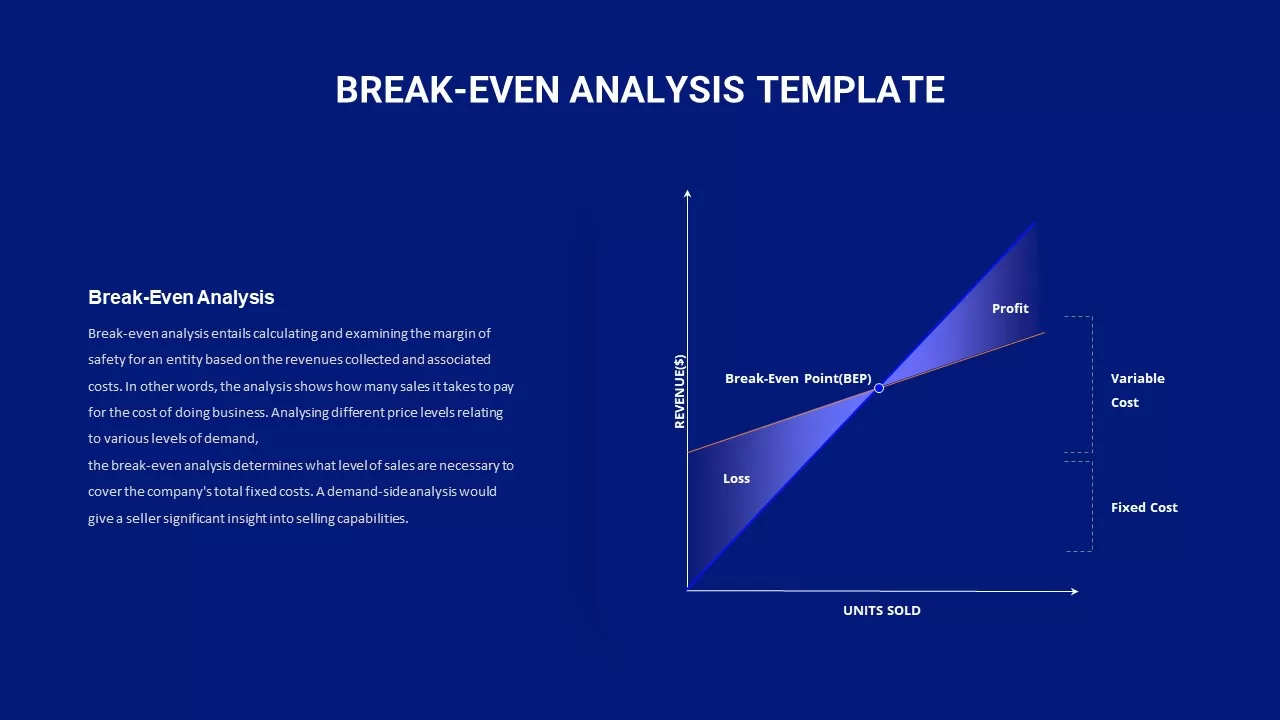
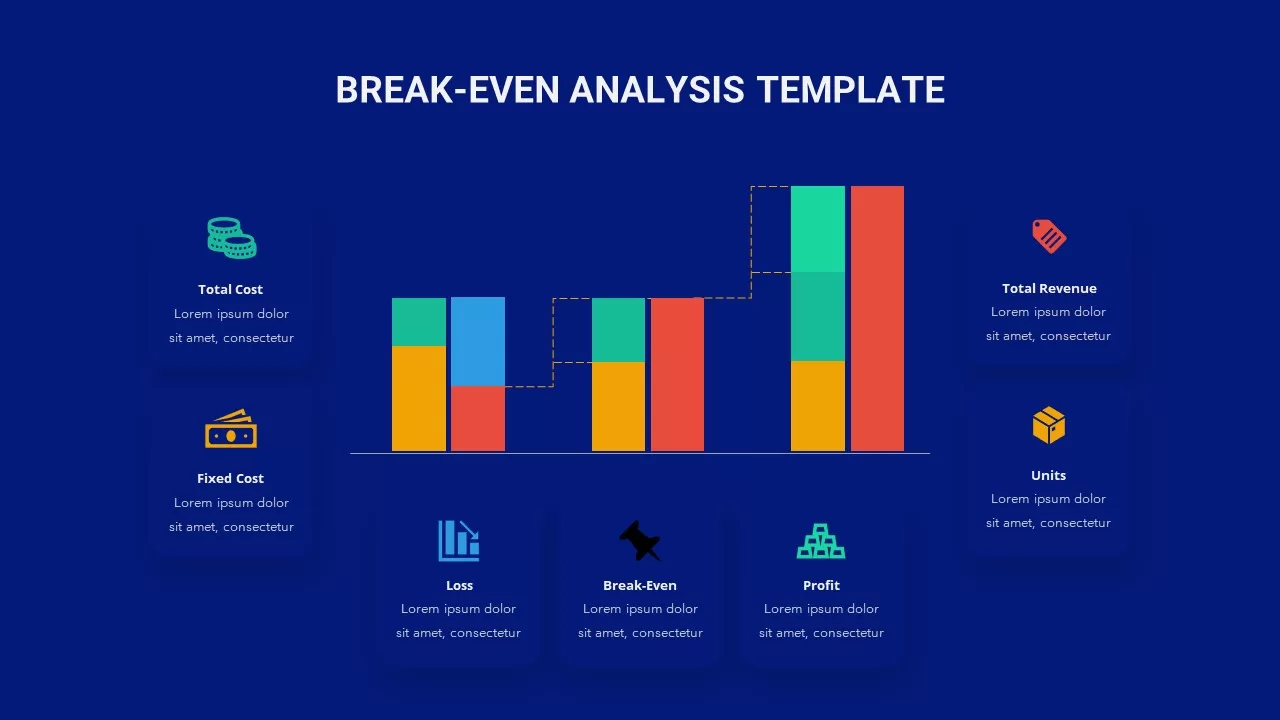
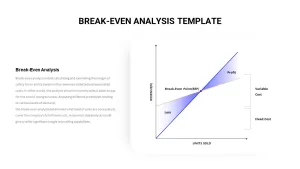
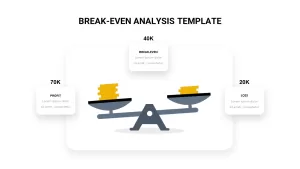
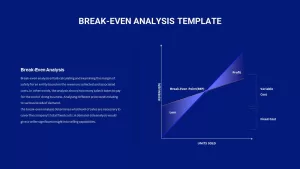
A break-even analysis template is a financial PowerPoint presentation that comes with break-even graphs and charts ppt to share your message. The purpose of the break-even analysis is to find out how much revenue you need to generate in order to cover your costs. This financial PowerPoint presentation comes with pre-designed break-even charts and graphs ppt that you can use to visualize your data and communicate your message more effectively. The break-even analysis template is a great way to share your financial information with your audience in a clear and concise manner.
What is breakeven analysis?
A break-even analysis is a financial tool that can assess the financial viability of a business venture. The breakeven point is when revenue and expenses are equal and there is no net profit or loss. A breakeven analysis can determine the financial feasibility of a new project or product and identify the financial breakeven point for different business activities. There are several different methods of breakeven analysis, but the most used process is the graphical breakeven analysis. This method uses a graph to compare total revenue and costs and identify the breakeven point. The PowerPoint for break-even analysis is a powerful tool that can be used to assess financial viability and make sound financial decisions.
If you are looking for a way visually represent a tool to transmit your financial ideas, then our breakeven analysis graph for PowerPoint presentation could aid you in displaying. The fully editable ppt template lets you change the color, size, and features. Besides, you can add your content to the PowerPoint as well. This break-even analysis template could be an ideal tool for broking houses and fund managers. Slidebazaar has other break-even PowerPoint templates, that you can try out!
Attached Files
| File | Action |
|---|---|
| https://premiumdownloads.s3.amazonaws.com/SB02247-Break Even Analysis.zip | Download |
Login to download this file
Add to favorites
Add to collection
-

Item ID
SB02247 -

Related Templates
-
Revenue Management Templates for PowerPoint & Keynote
Business Models
Premium
-
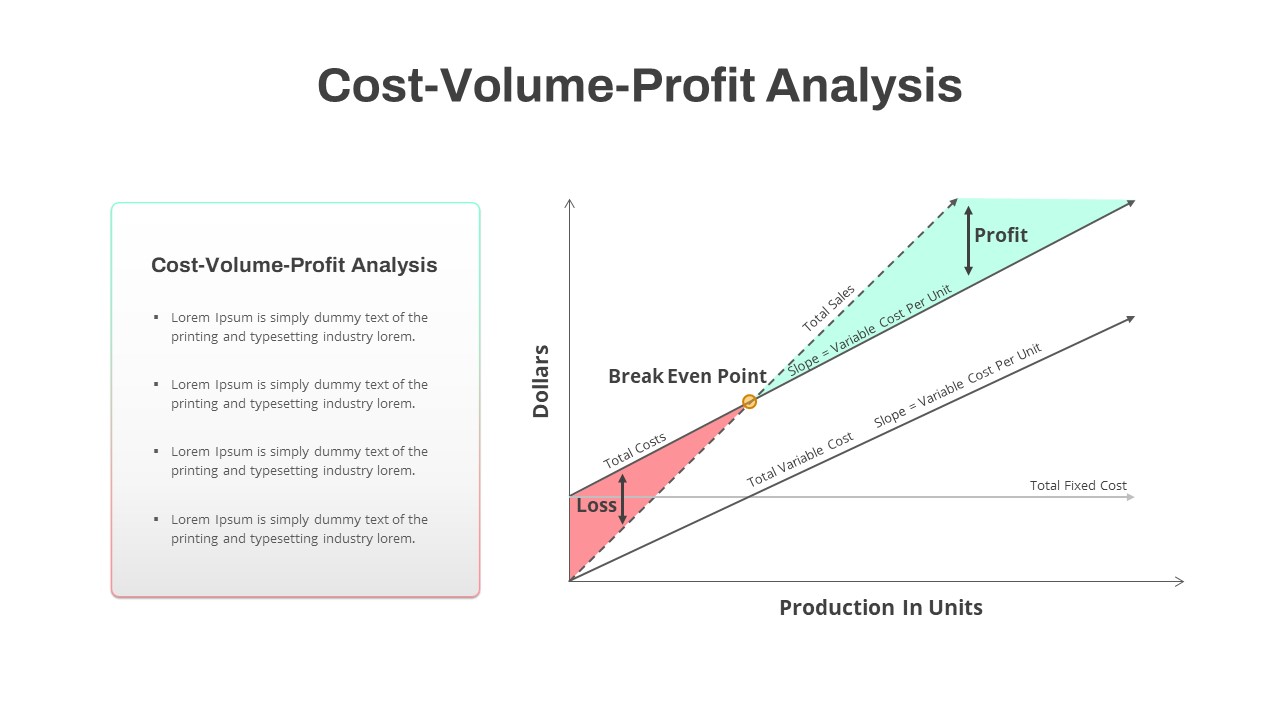
Cost Volume Profit Analysis PowerPoint Template
PowerPoint Templates
Premium
-
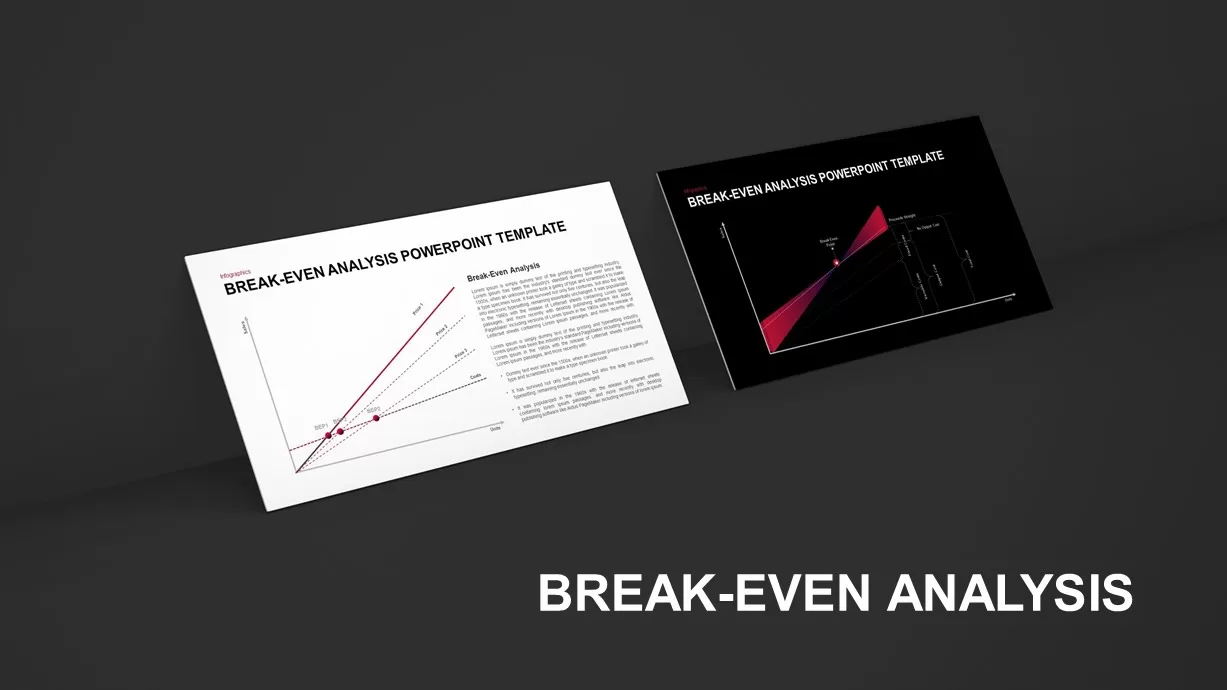
Break-Even Analysis PowerPoint Template
Curves and Lines
Premium
-
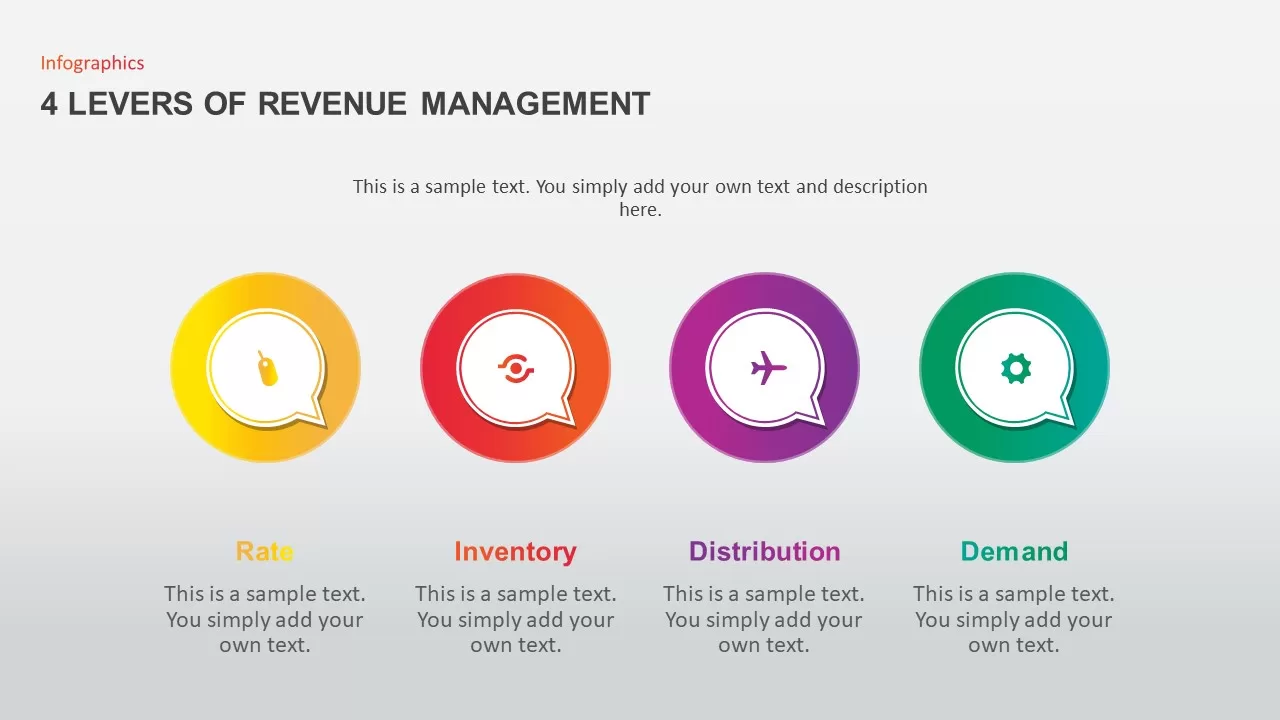
4 levers of Revenue Management PowerPoint Template
Infographic
Premium
-
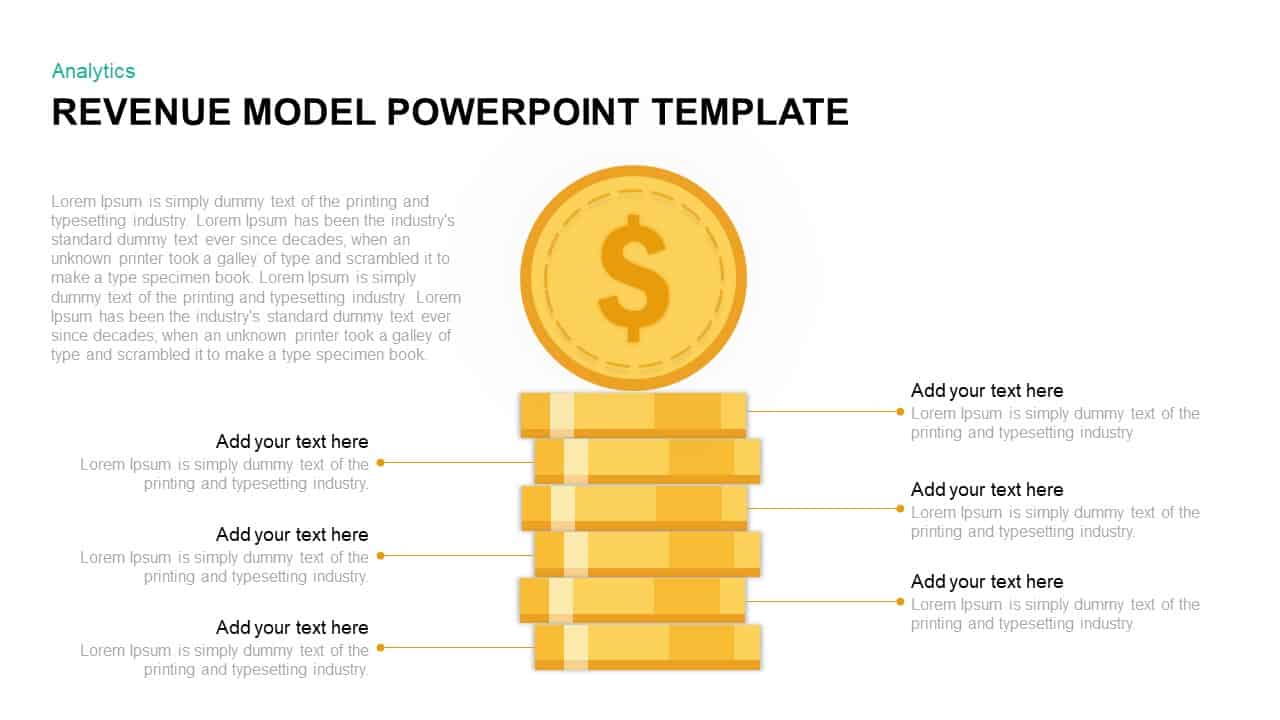
Revenue Model Template for PowerPoint & Keynote
Business Models
Premium
-
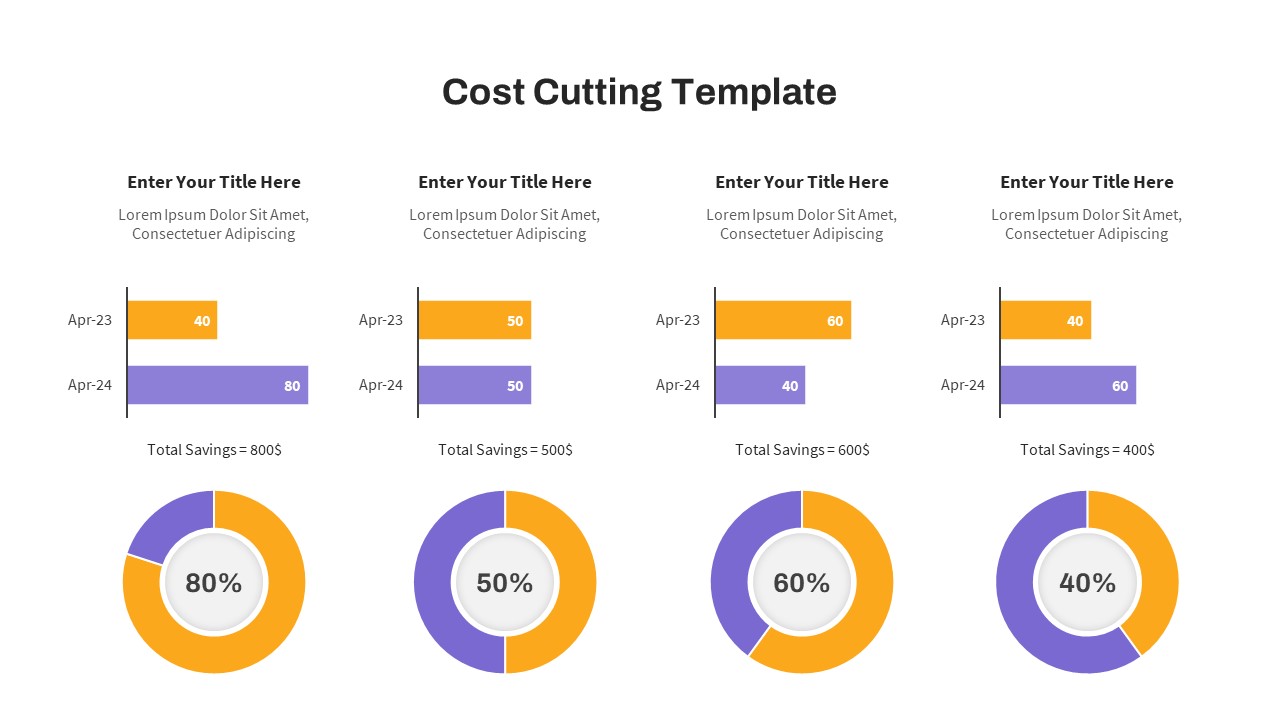
Cost Cutting PowerPoint Template
Infographic
Premium
-
Free Charts & Graphs Deck PowerPoint Template
PowerPoint Templates
Free
-
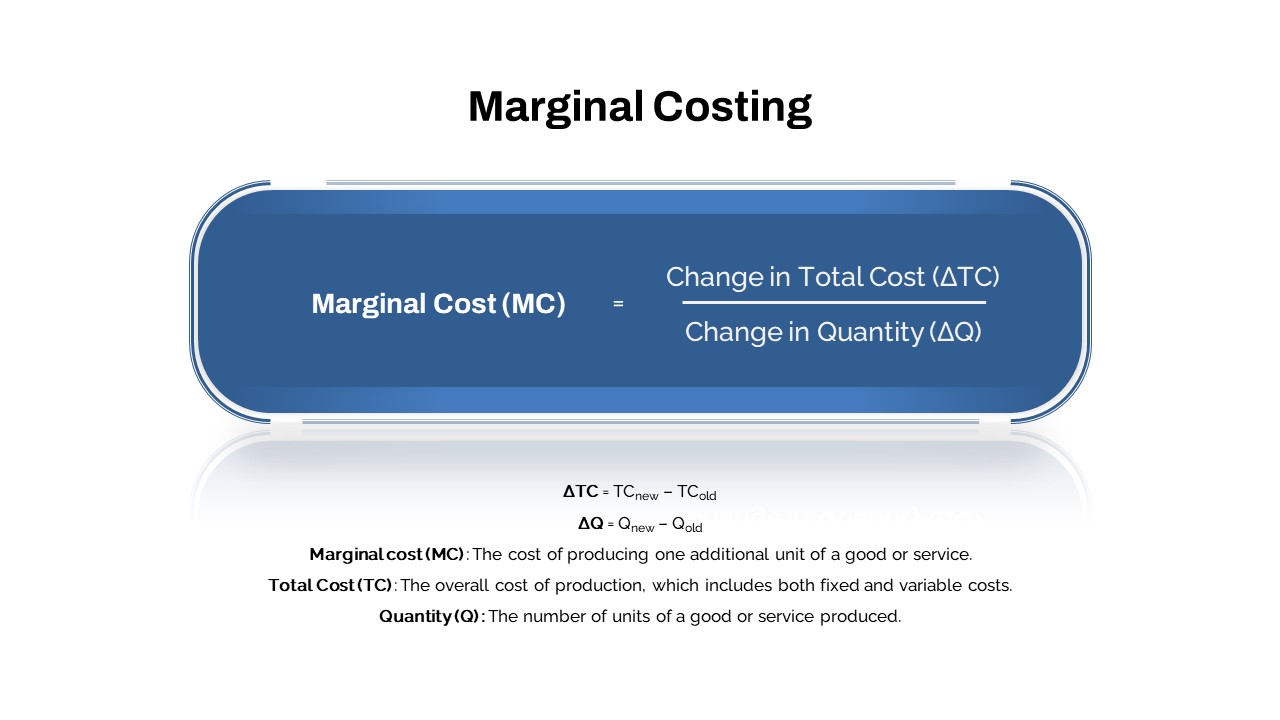
Marginal Costing PowerPoint Template
PowerPoint Templates
Premium
-
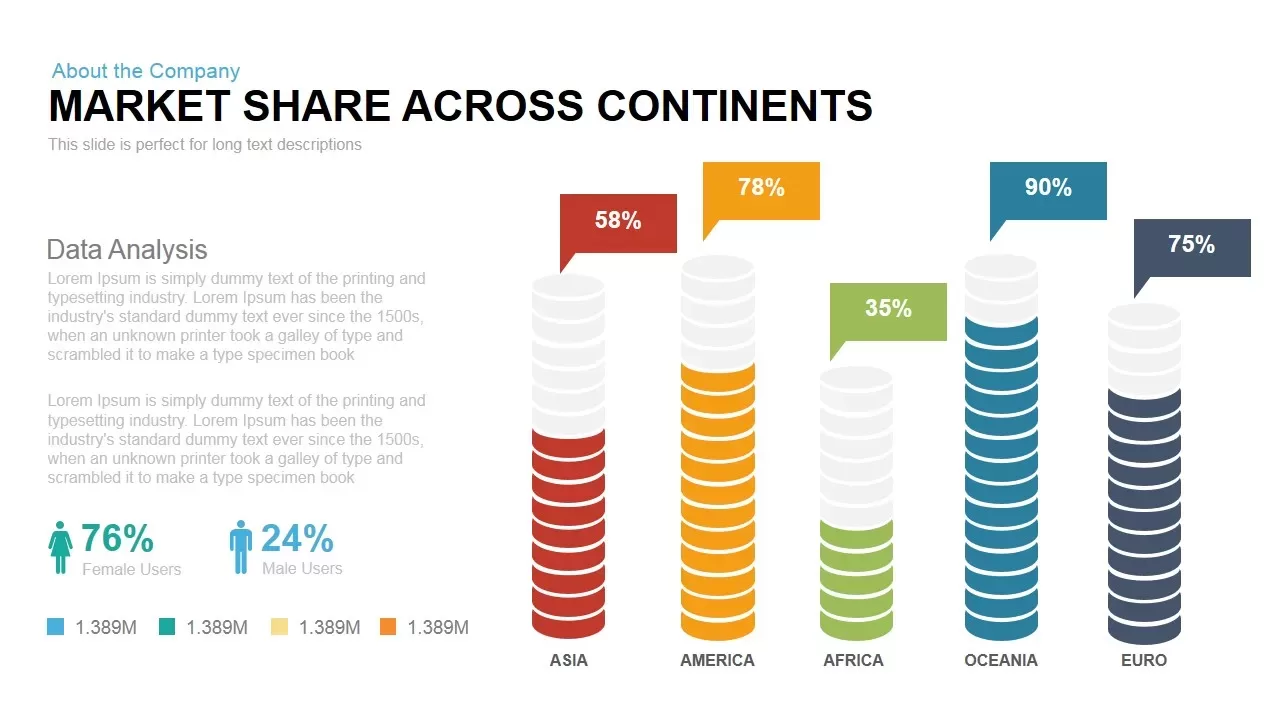
Market Share across Continents PowerPoint & Keynote template
Diagrams
Premium
-
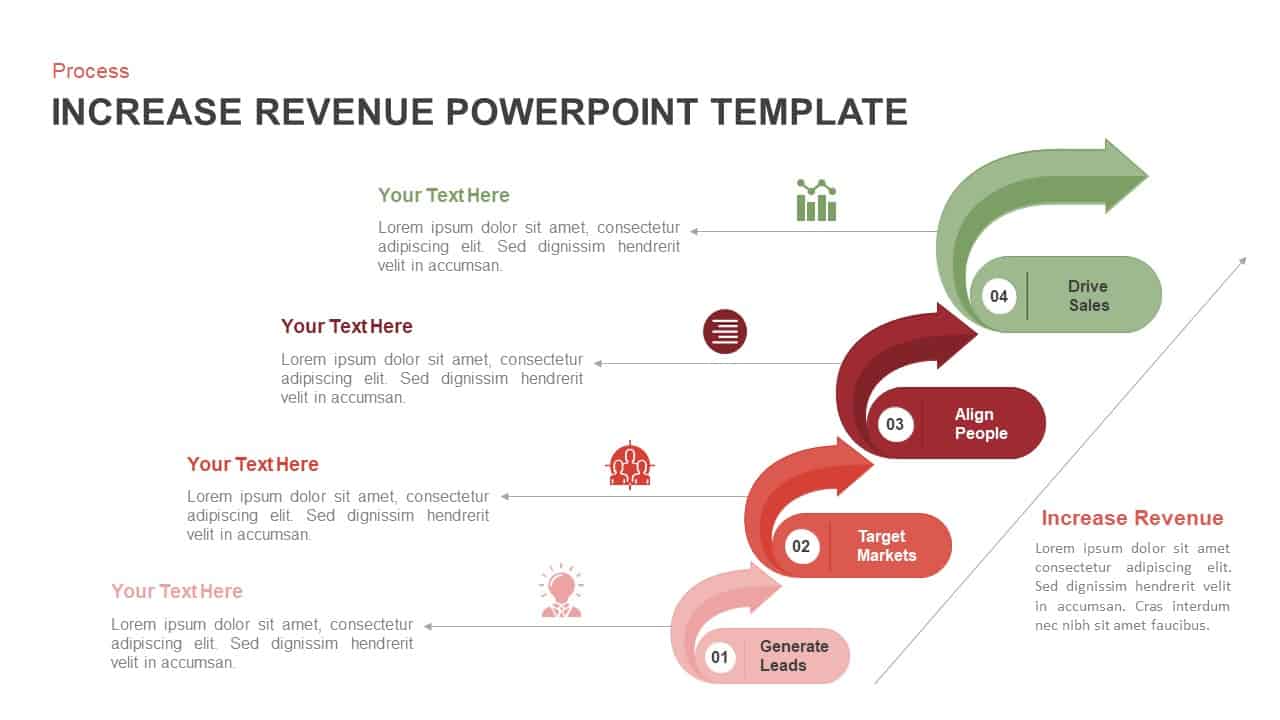
Increase Revenue PowerPoint Template and Keynote Slide
Arrow Diagrams
Premium
-

Free Charts and Graphs PowerPoint Template
PowerPoint Templates
Free
-
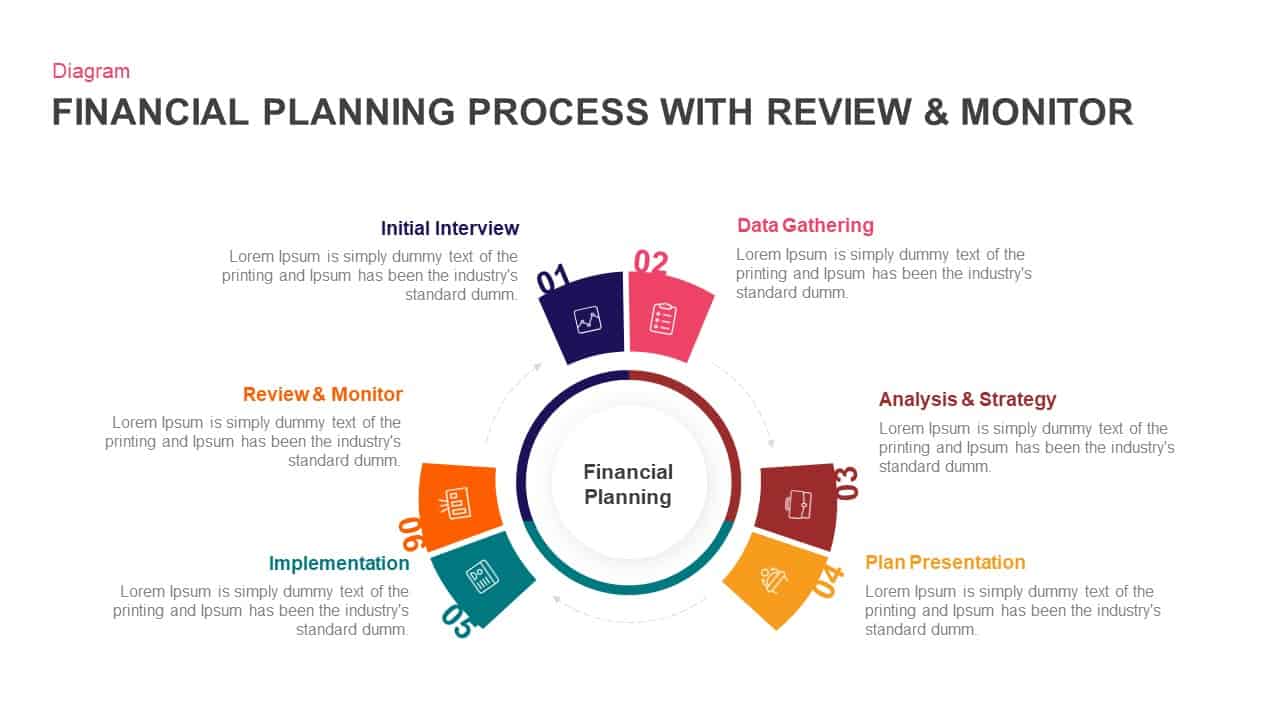
Financial Planning Process With Review and Monitor Template for PowerPoint & Keynote
Business Models
Premium
-
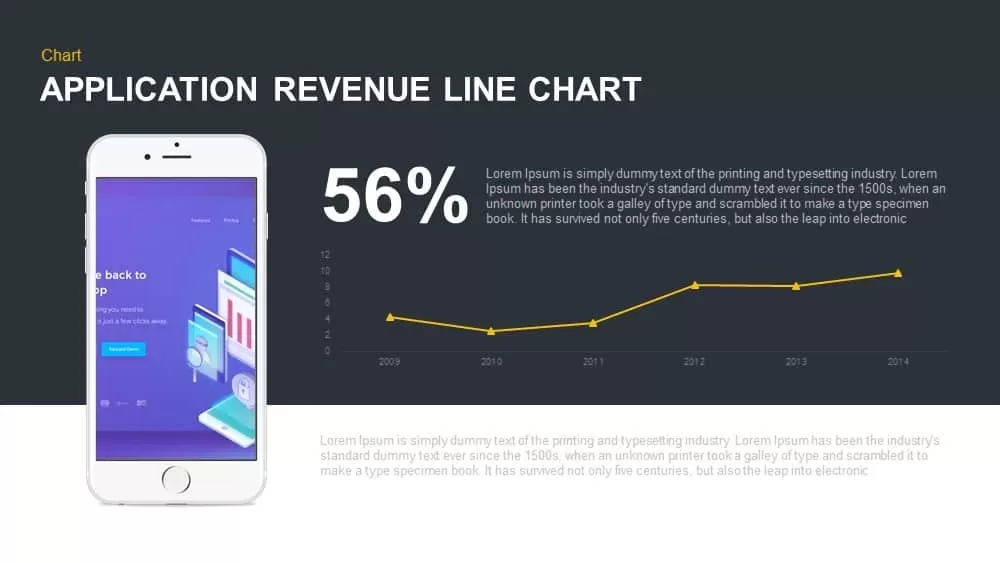
Application Revenue Line Chart PowerPoint Template and Keynote
Keynote Templates
Premium
-
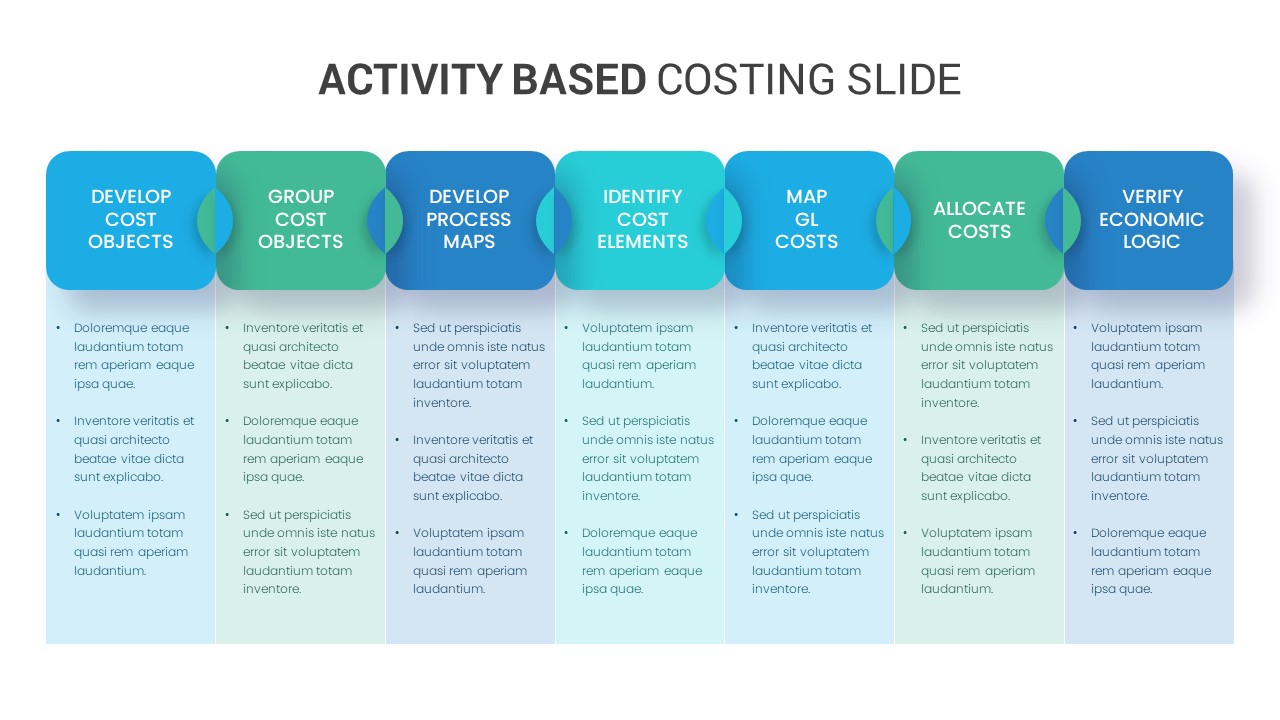
Activity Based Costing Template for PowerPoint and Keynote
PowerPoint Templates
Premium
-
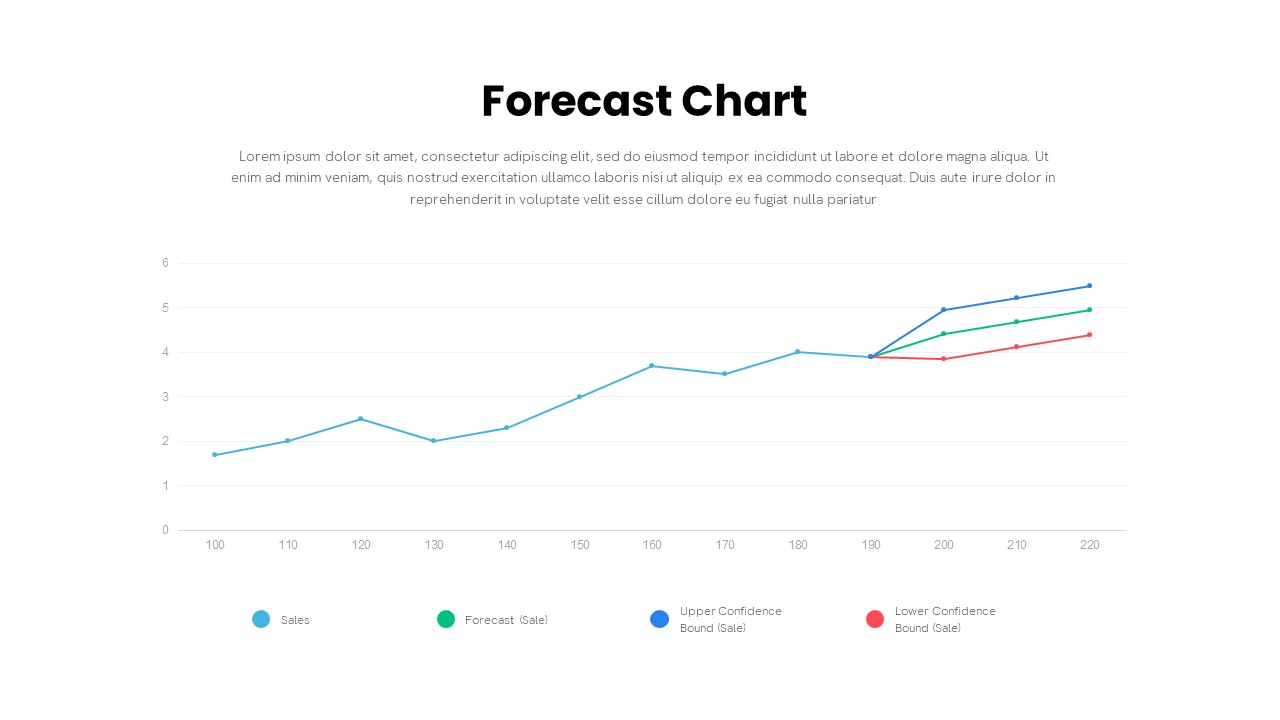
Forecast Chart PowerPoint Template
PowerPoint Charts
Premium
-
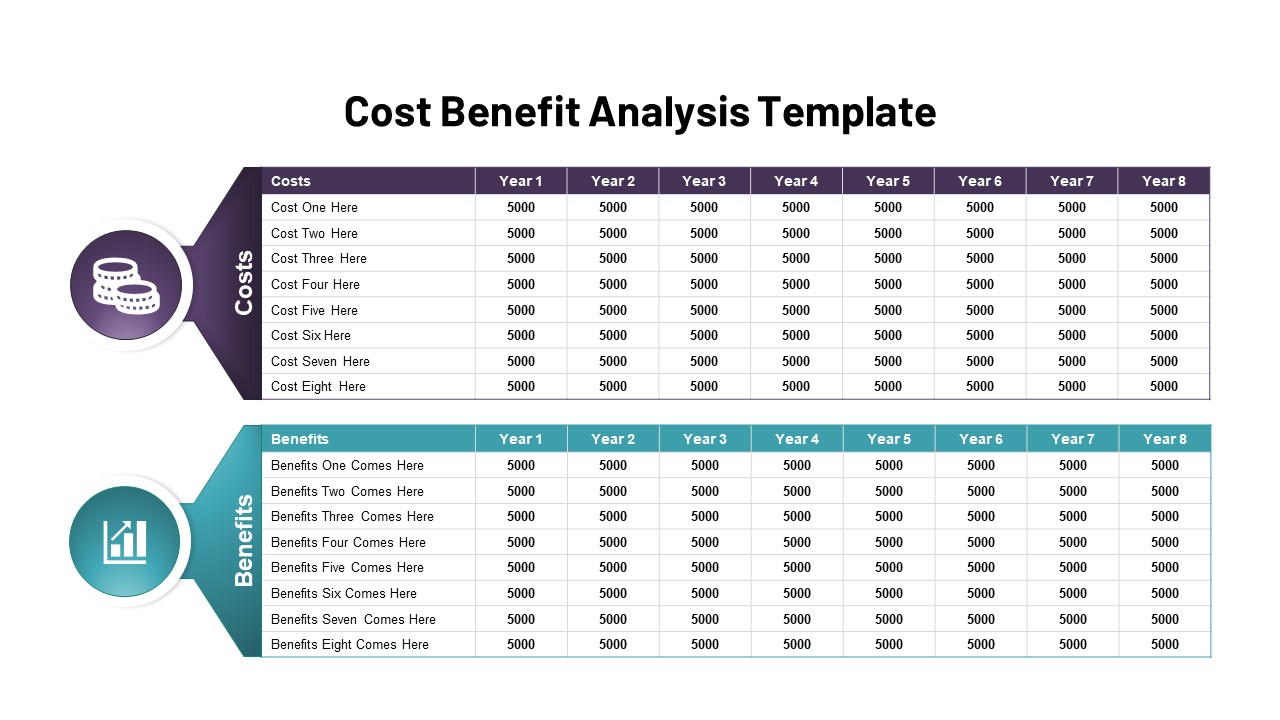
Cost Benefit Analysis Template for PowerPoint and Google Slides
Infographic
Premium
-
One Pager Annual Report Template
Column and Bar chart
Premium
-
Monthly Recurring Revenue PowerPoint Template
PowerPoint Templates
Premium
-
Annual Recurring Revenue PowerPoint Template
PowerPoint Templates
Premium
-

Annual Report PowerPoint Template and Keynote
PowerPoint Templates
Premium
-

Free Finance Deck PowerPoint Template
PowerPoint Templates
Free
-

Financial Report Metaphor PowerPoint Presentation Template
Metaphor, Simile & Analogy
Premium
-
Free Accounting Presentation Template
PowerPoint Templates
Free
-
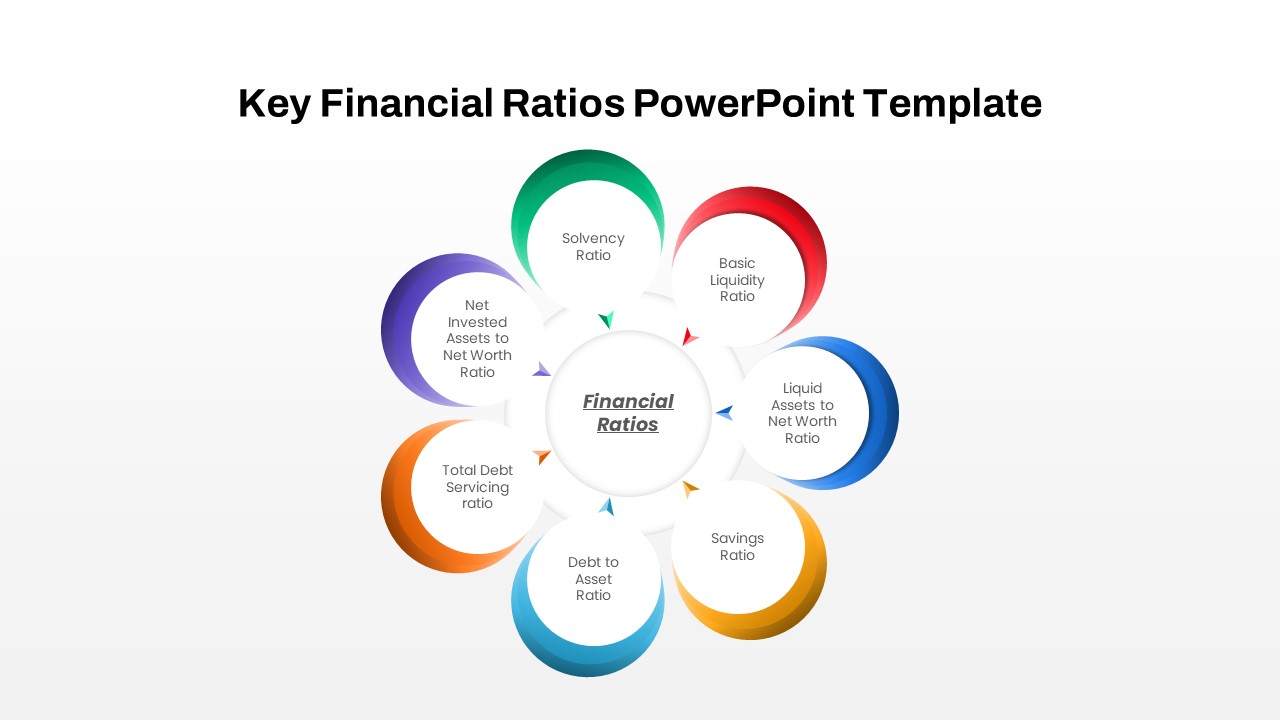
Key Financial Ratios PowerPoint Template
PowerPoint Templates
Premium
-
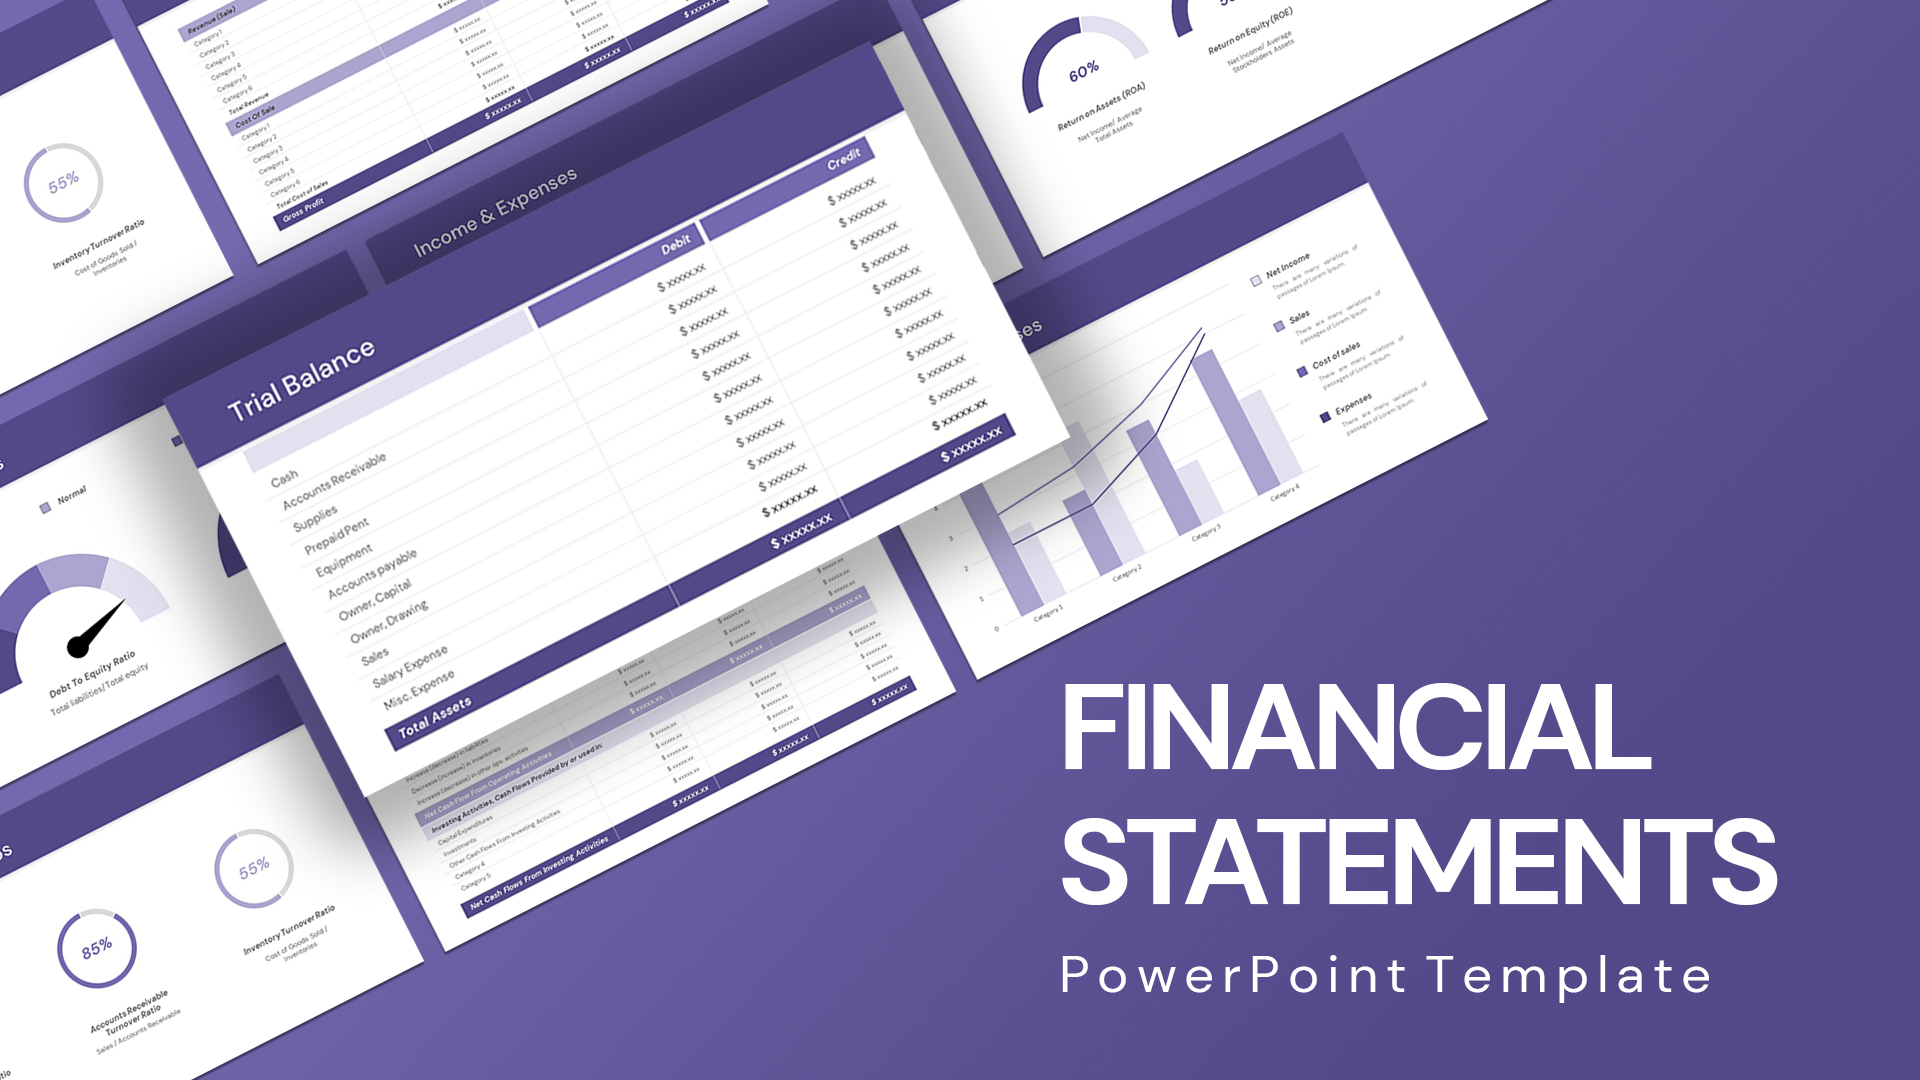
Financial Statement PowerPoint Template
PowerPoint Templates
Premium
-
Financial Report PowerPoint Template & Keynote
PowerPoint Templates
Premium
-

Free Stock Market PowerPoint Template
PowerPoint Templates
Free
-
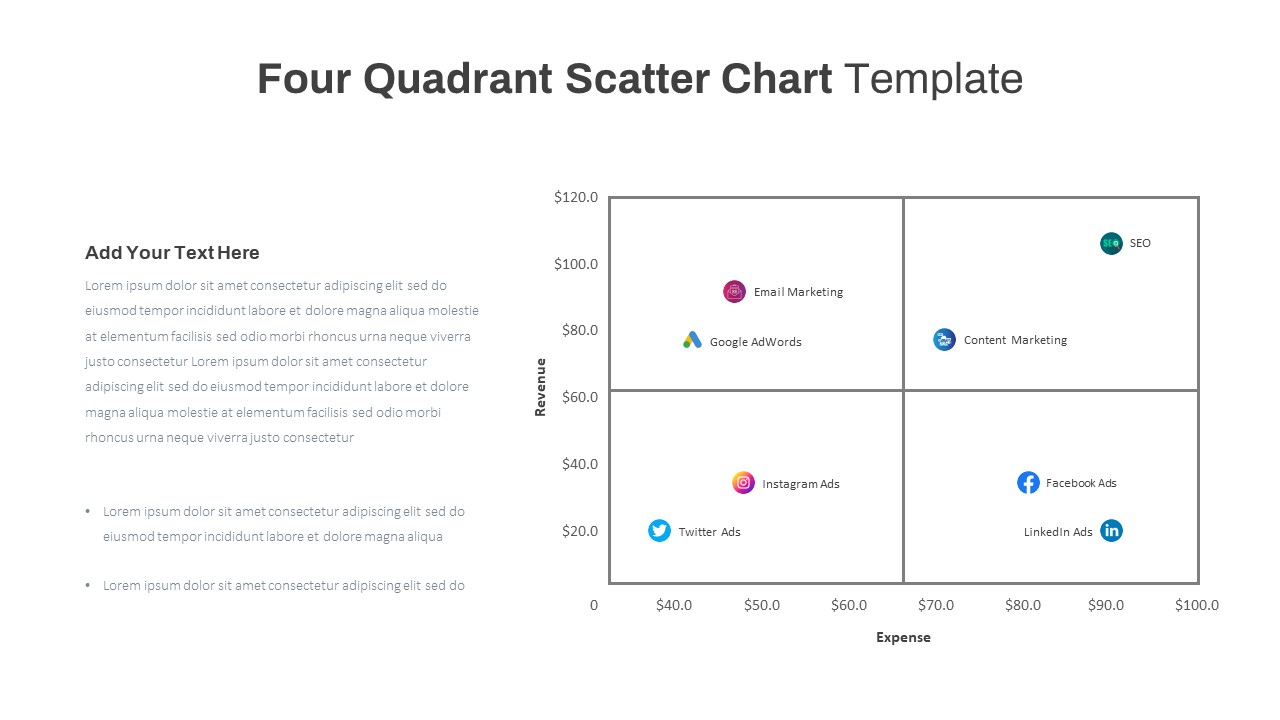
Four Quadrant Scatter Chart PowerPoint Template
PowerPoint Charts
Premium
-
Gap Analysis Strategic Planning Template
PowerPoint Templates
Premium
-
Gap Analysis PowerPoint Template
Business Models
Premium
-
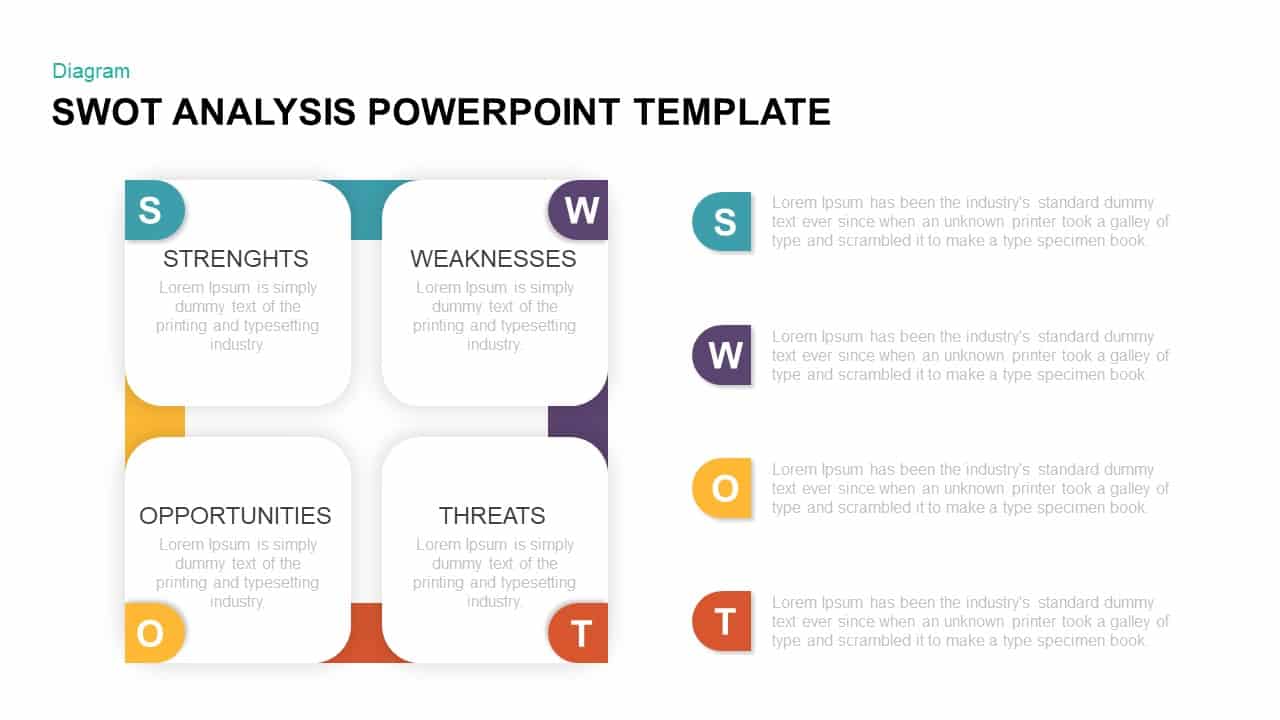
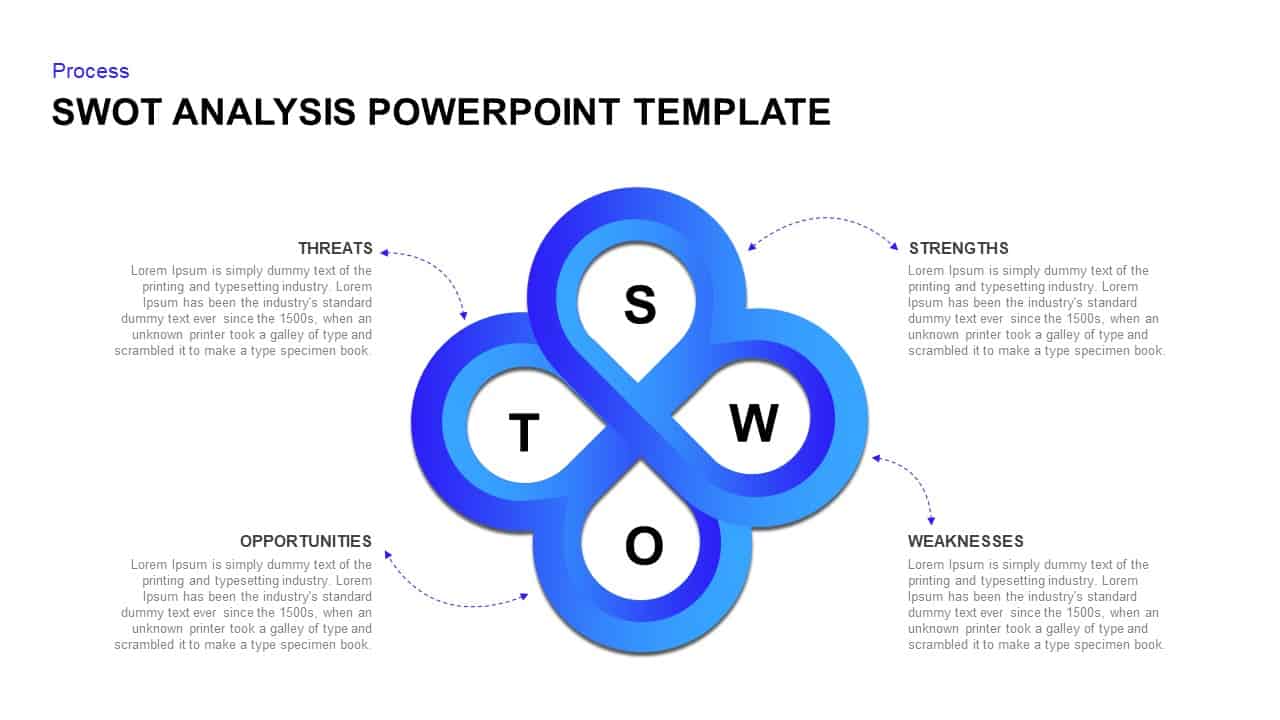
Business SWOT Analysis PowerPoint Template and Keynote Slide
Business Models
Premium
-
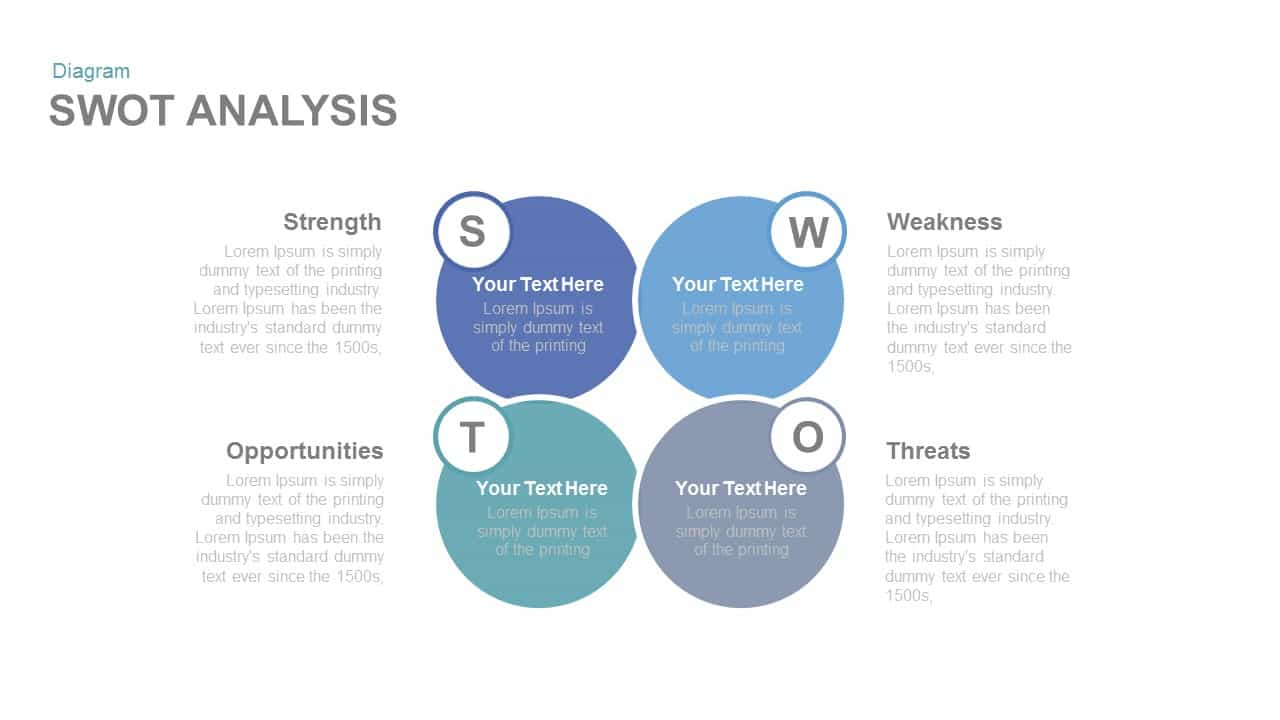
SWOT Template for PowerPoint & Keynote Presentation
Business Models
Premium
-

Mekko Chart Template
PowerPoint Templates
Premium
-
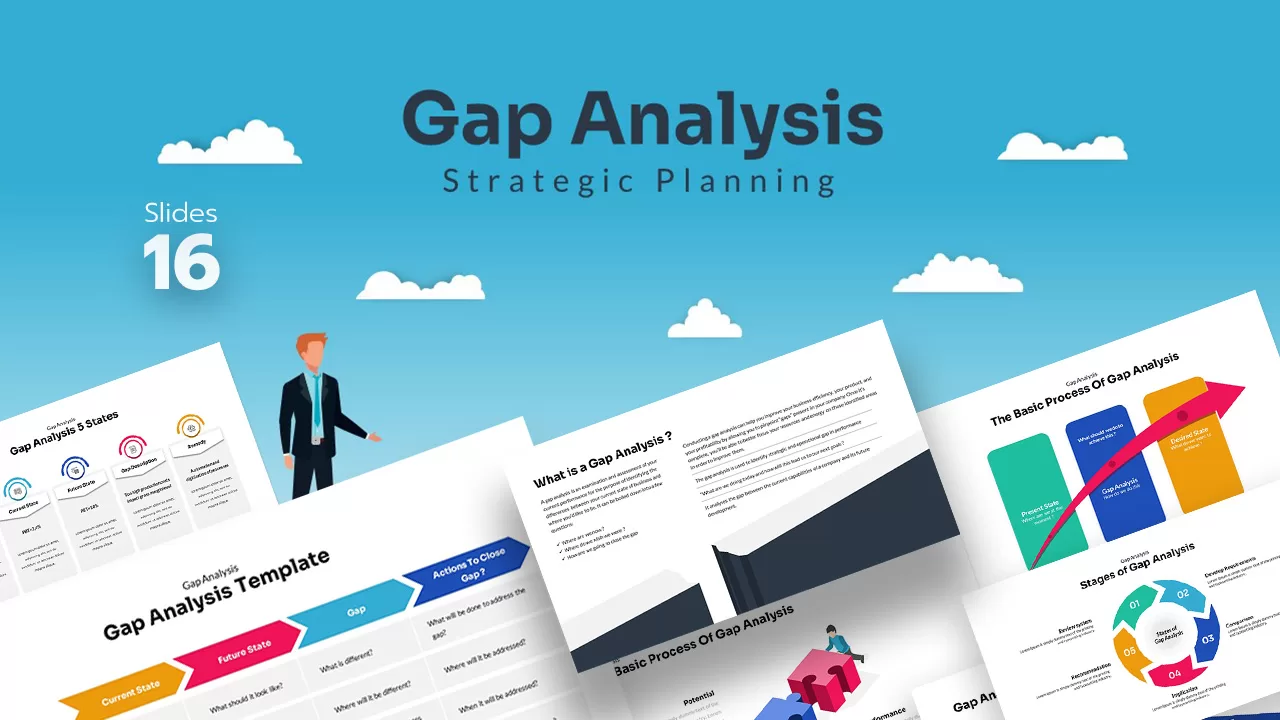
Gap Analysis Strategic Planning PowerPoint Template
Business Models
Premium
-

Finance Advisor PowerPoint Template
PowerPoint Templates
Premium
-
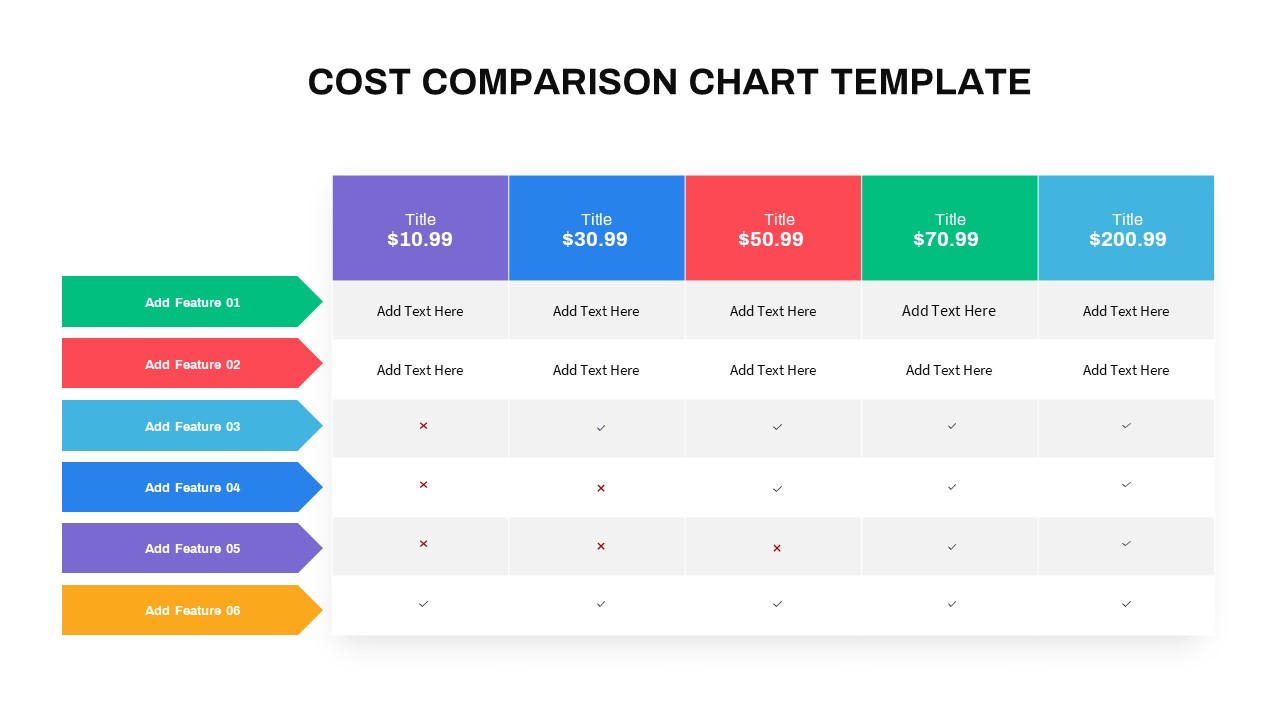
Cost Comparison PowerPoint Template
PowerPoint Templates
Premium
-
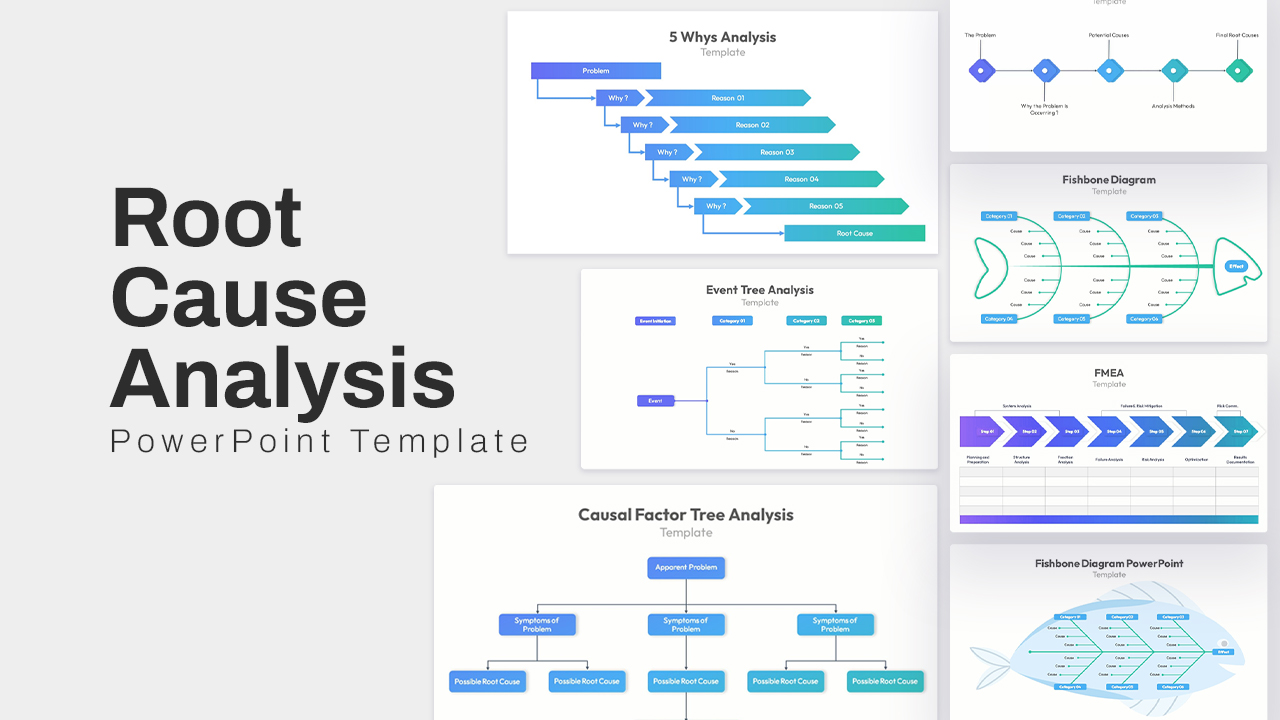
Root Cause Analysis PowerPoint Template
Arrow Diagrams
Premium
-
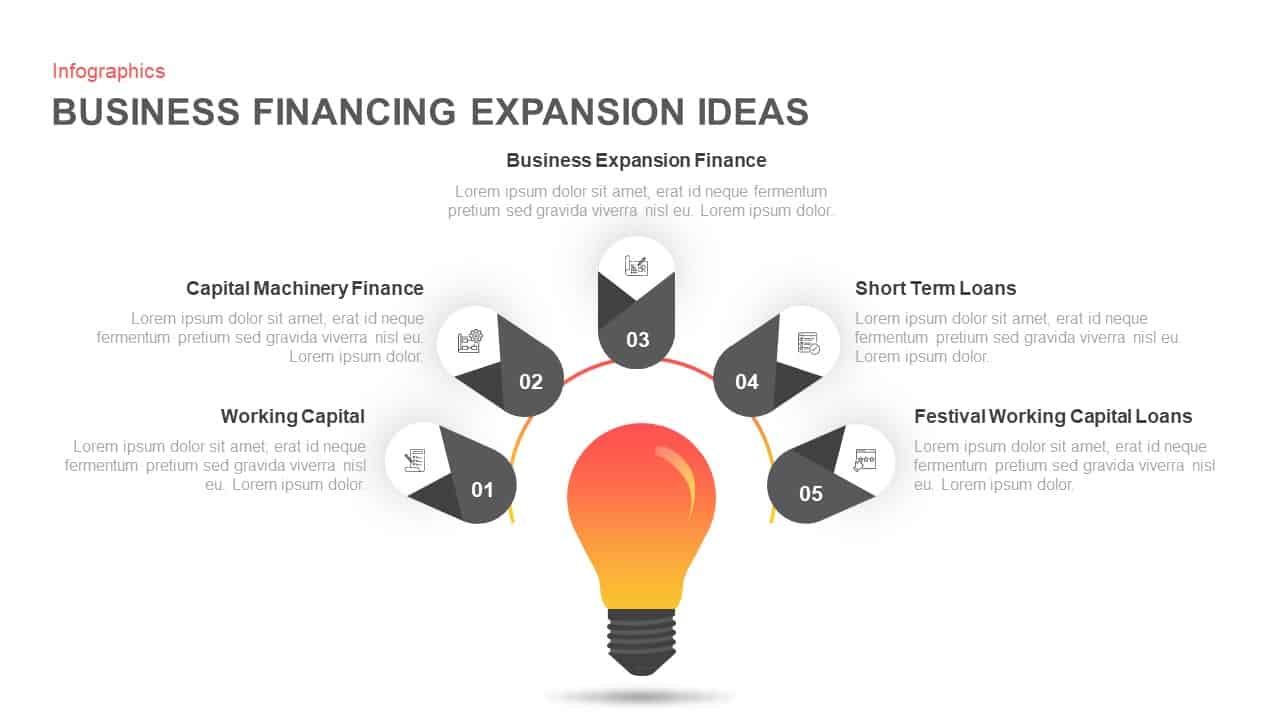
Business Financing Expansion Ideas Diagram for PowerPoint & Keynote
Business Models
Premium
-
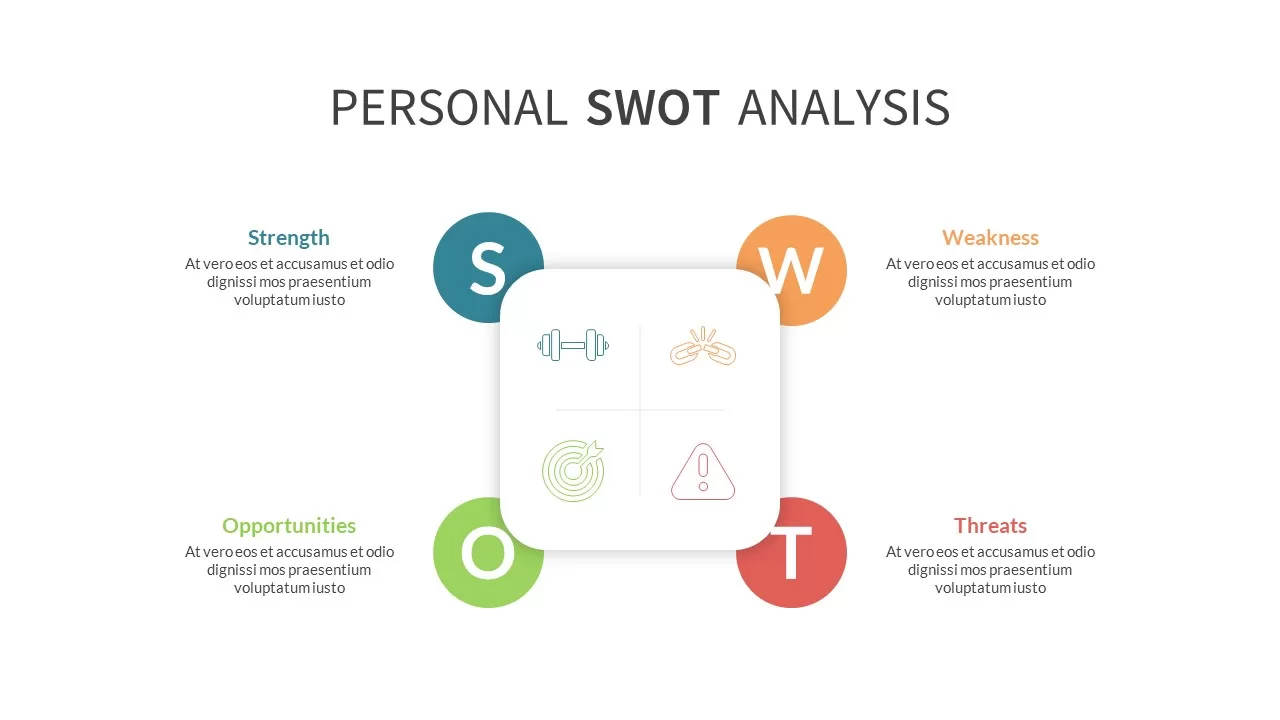
Personal SWOT Analysis PPT
professional
Premium
-
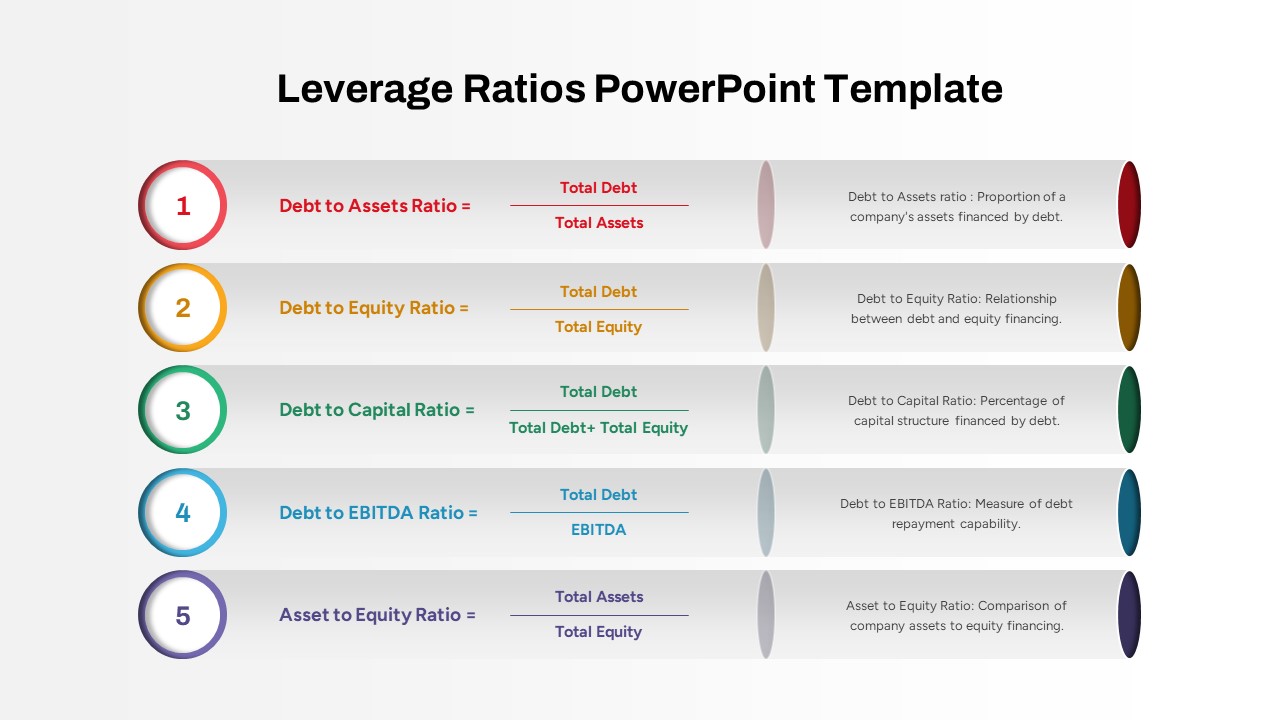
Leverage Ratios PowerPoint Template
PowerPoint Templates
Premium
-
Annual Report PowerPoint Template Free
PowerPoint Templates
Free
-
Sales Growth PowerPoint Presentation Template
Curves and Lines
Premium
-
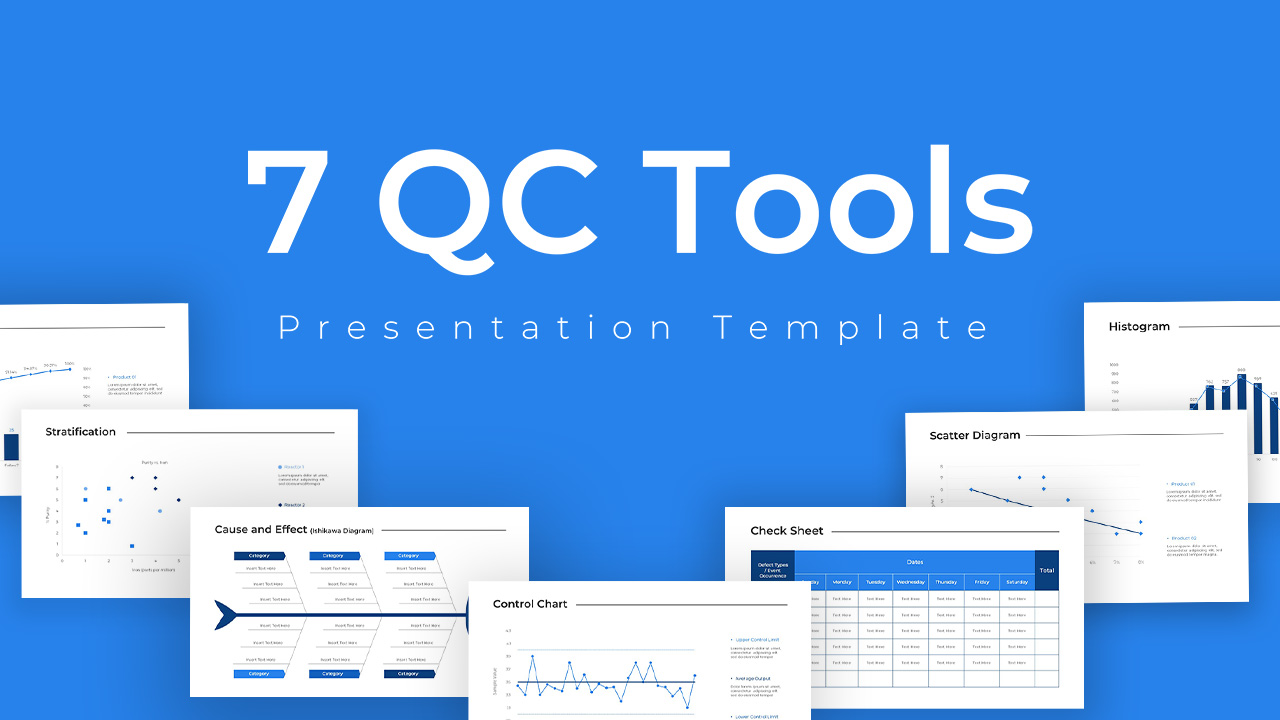
QC Tools PowerPoint Template
Infographic
Premium
-
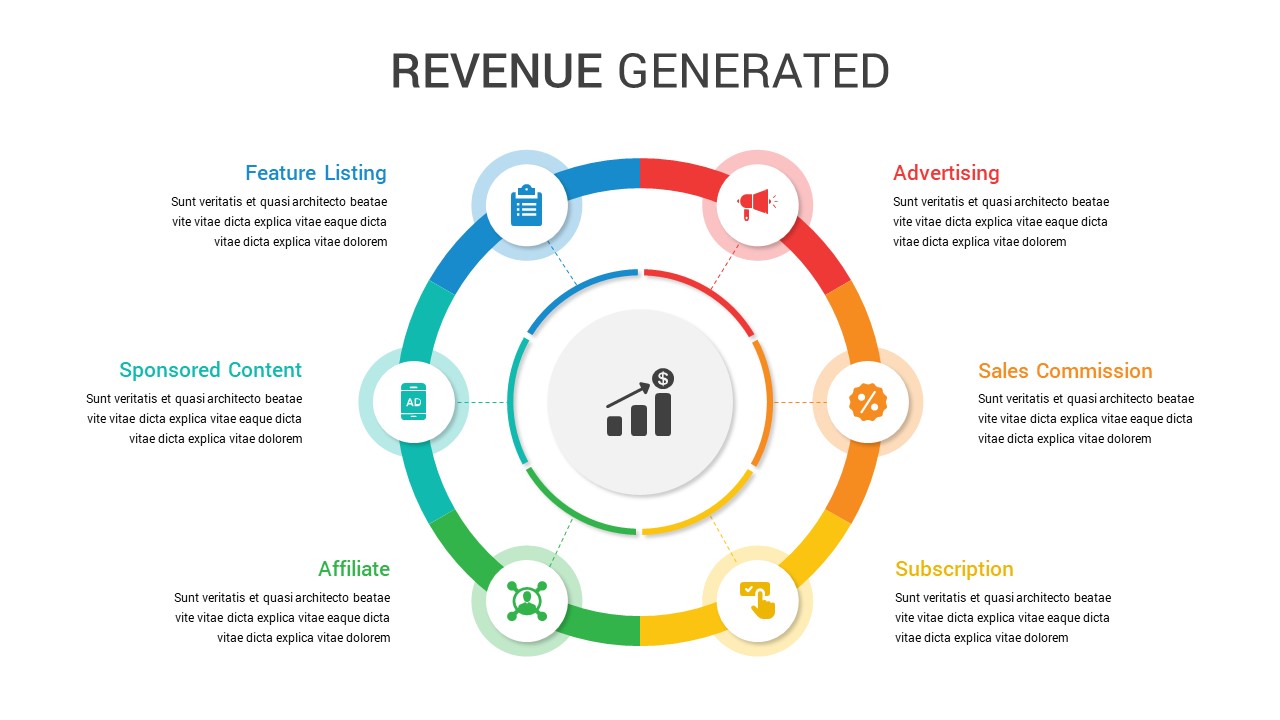
Revenue Generation PowerPoint Template
PowerPoint Templates
Premium
-

Annual Report Template for PowerPoint
Business Models
Premium
-
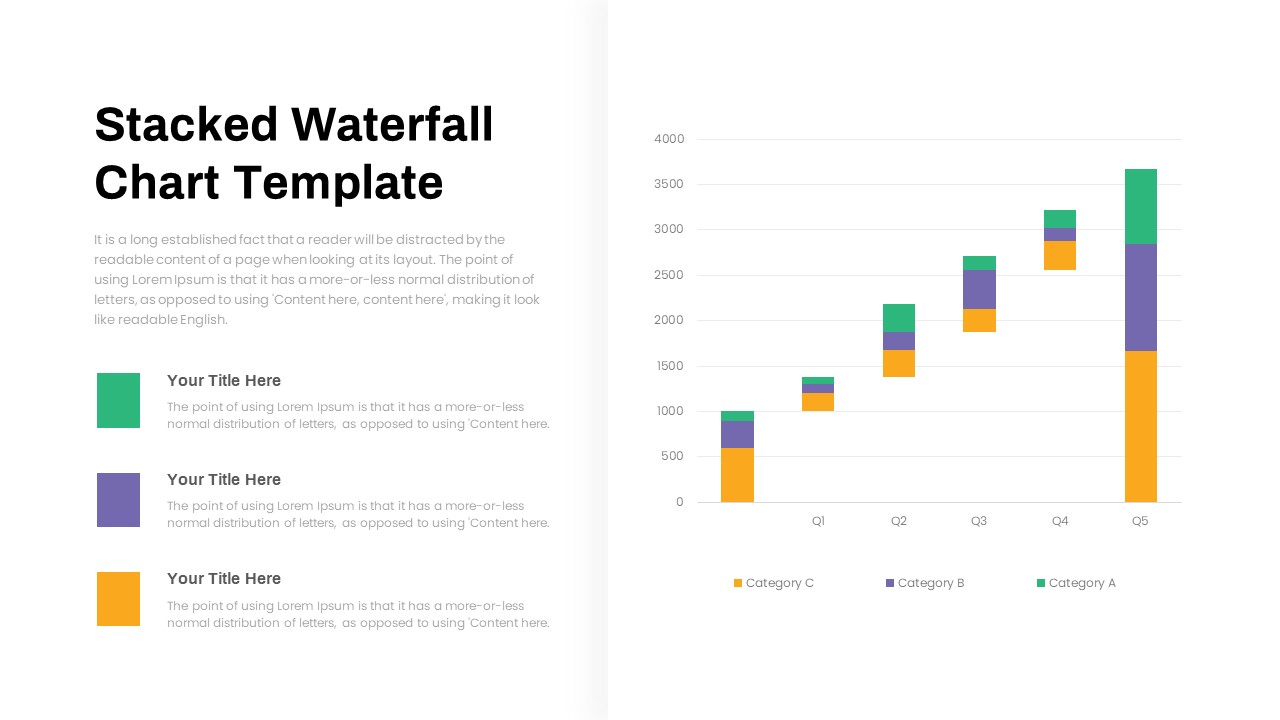
Stacked Waterfall Chart PowerPoint Template
PowerPoint Templates
Premium
-
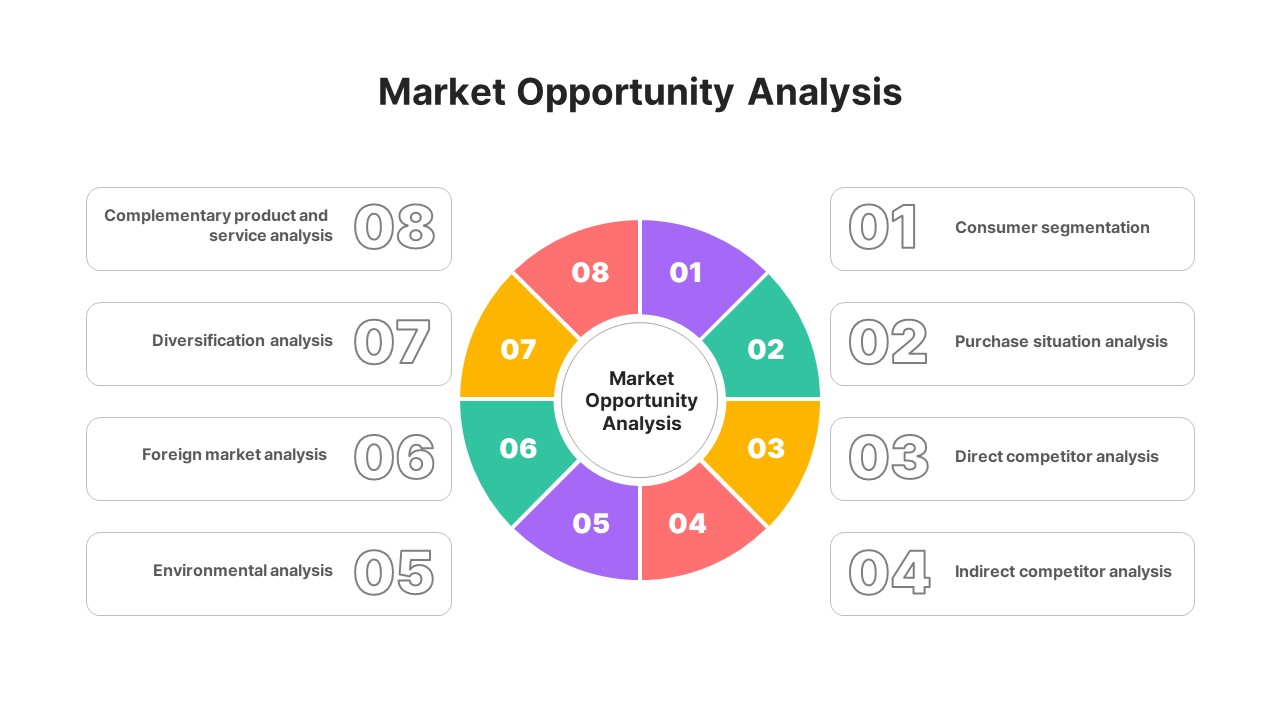
Market Opportunity Analysis Template
Circular Diagrams
Premium
-
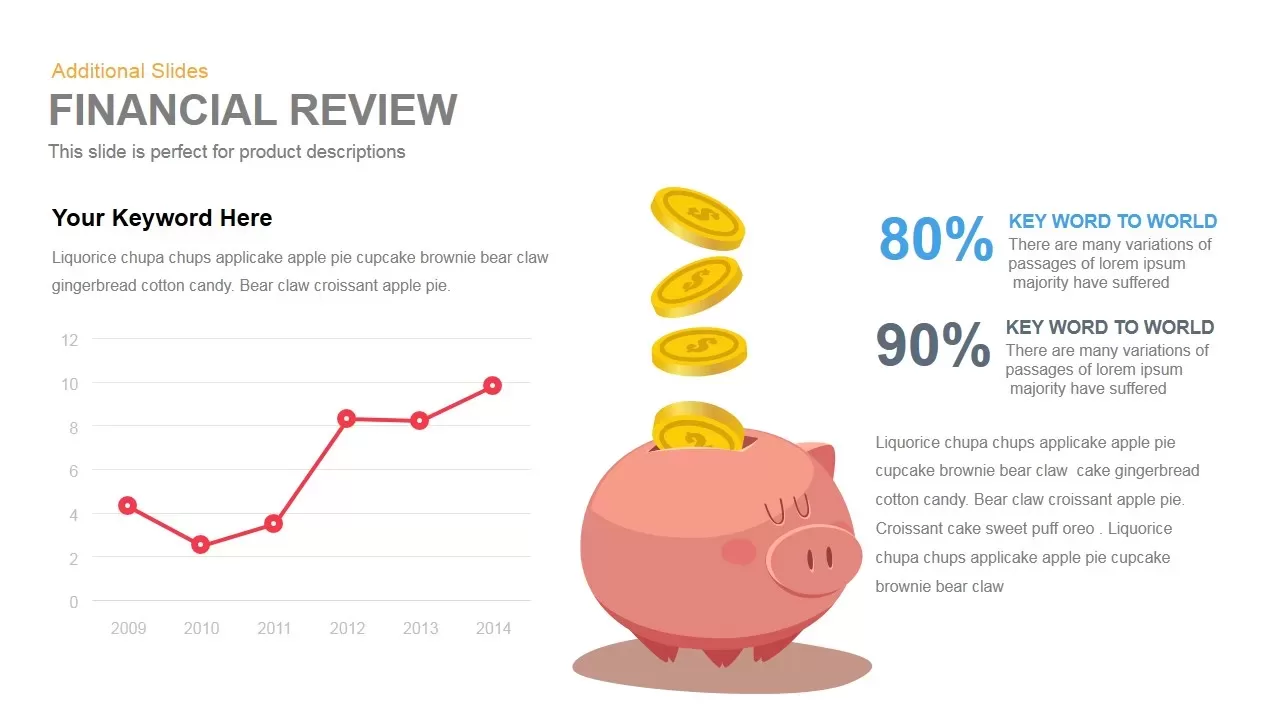
Financial Review Template for PowerPoint and Keynote
Infographic
Premium
-
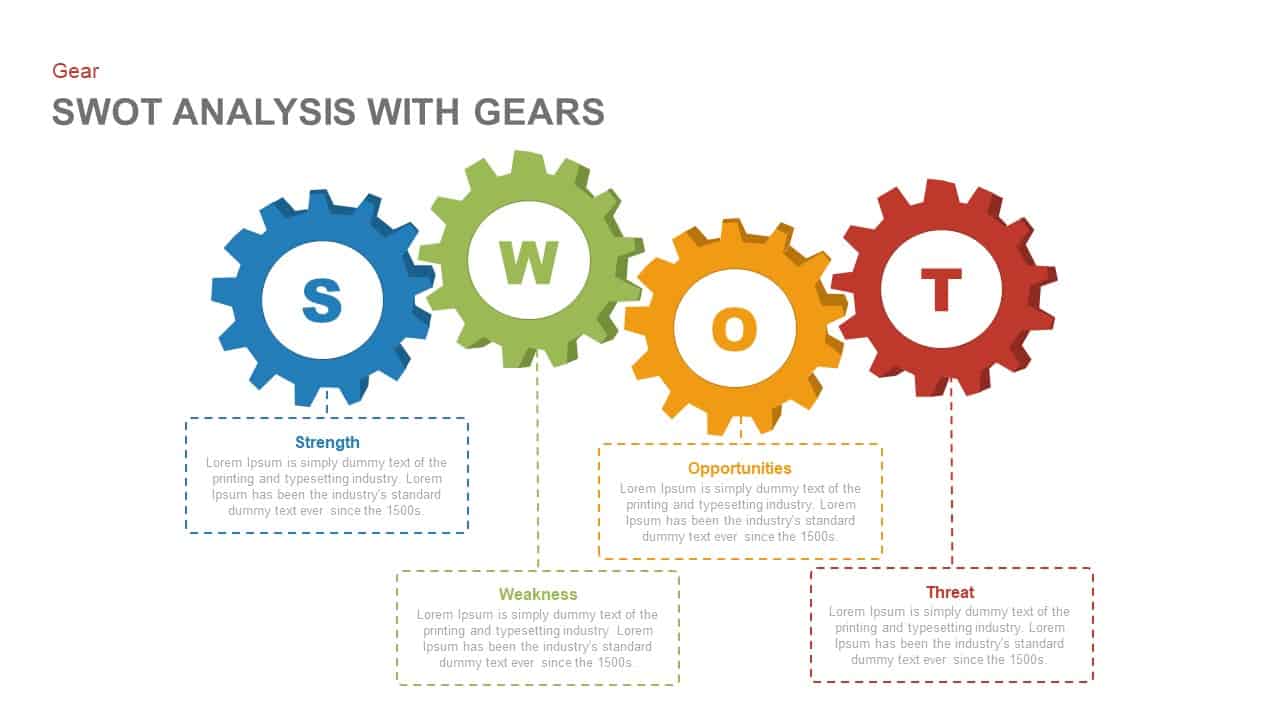
SWOT Analysis PowerPoint Template with Gears and Keynote Slide
Gear
Premium
-
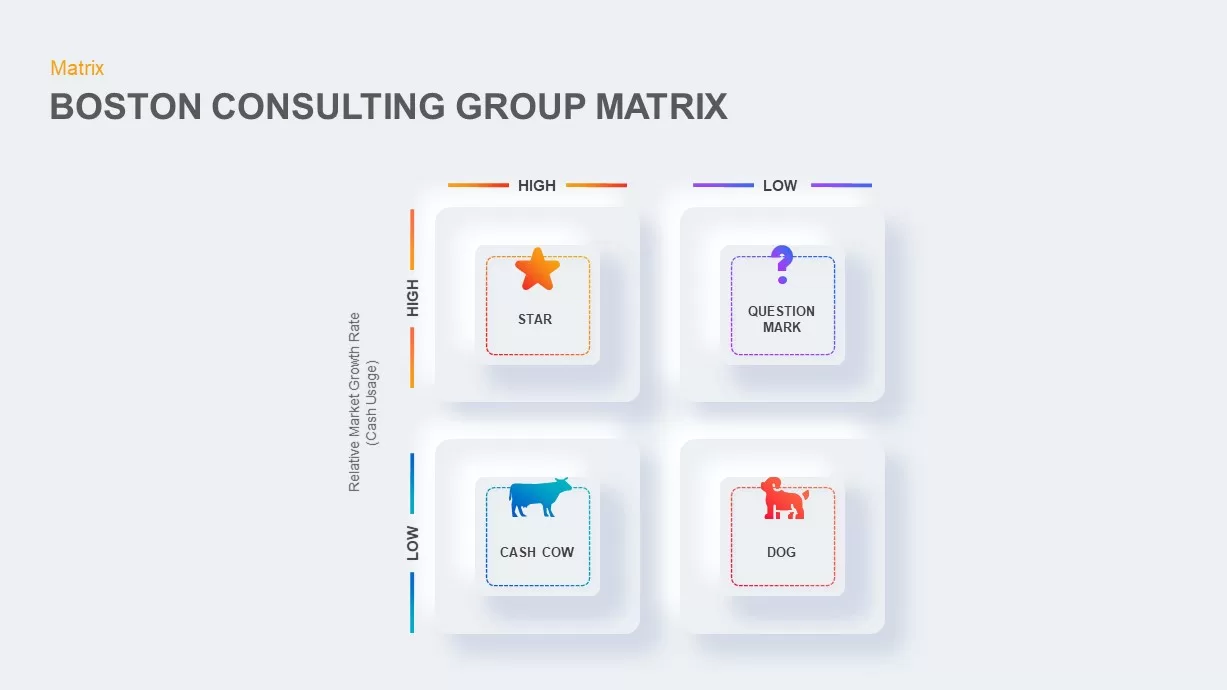
Boston Consulting Group Matrix
Business Models
Premium
-
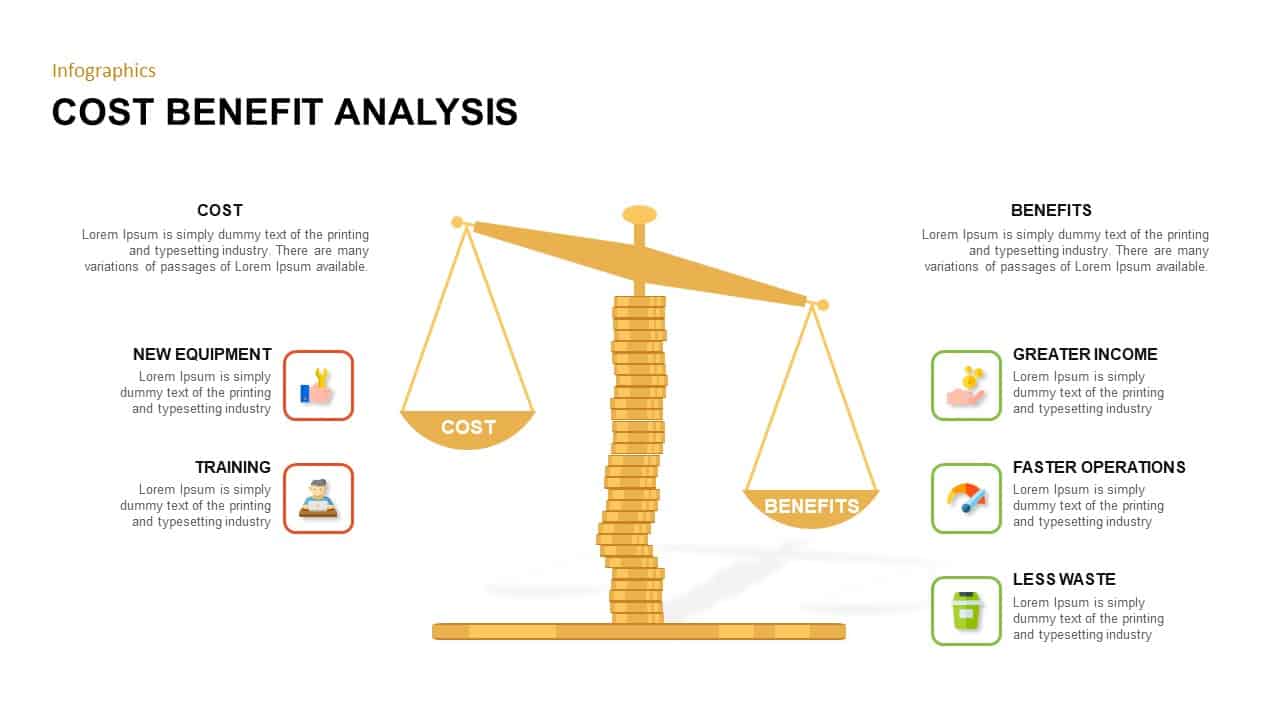
Cost Benefit Analysis PowerPoint Template
Business Models
Premium
-
Investment Pitch Deck Template for PowerPoint
Business Models
Premium
-

PESTLE Analysis PowerPoint Template and Keynote
Business Models
Premium
-
Business Proposal PowerPoint Template
PowerPoint Business Templates
Premium
-
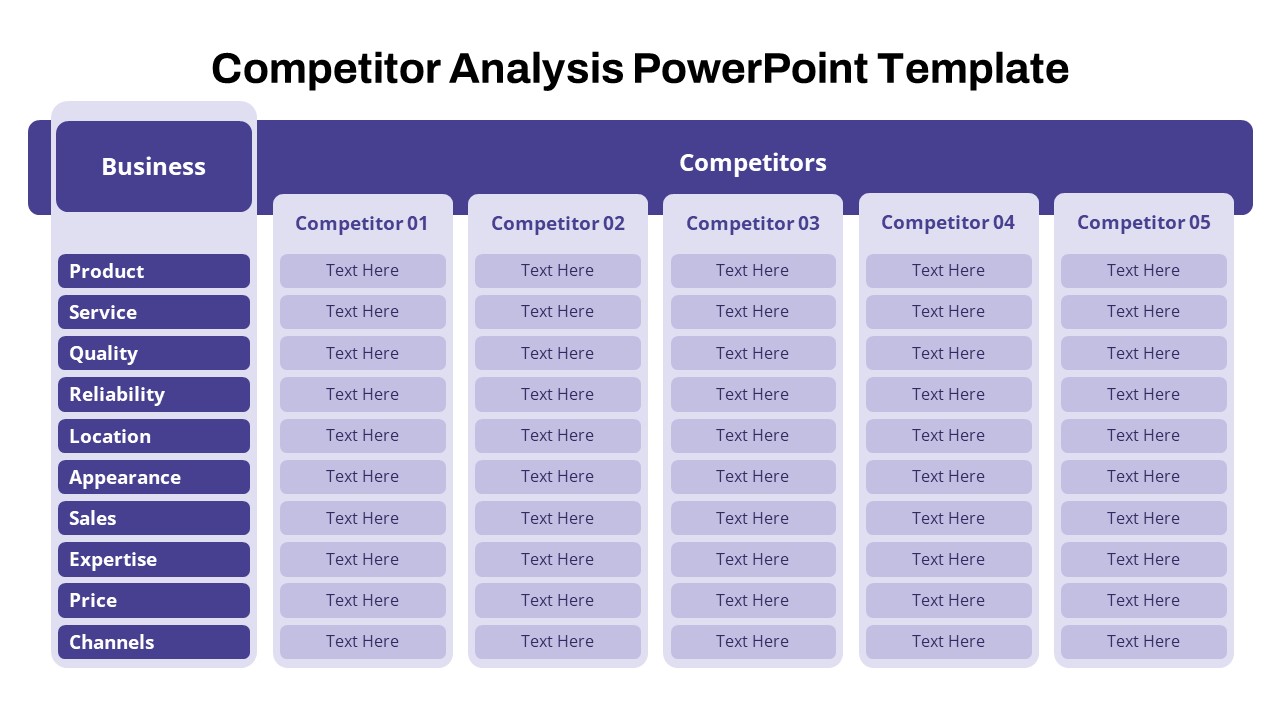
Competitor Analysis Template
PowerPoint Business Templates
Premium
-
Sunk Costs Illustration Analogy Metaphor PowerPoint Template
PowerPoint Templates
Premium
-
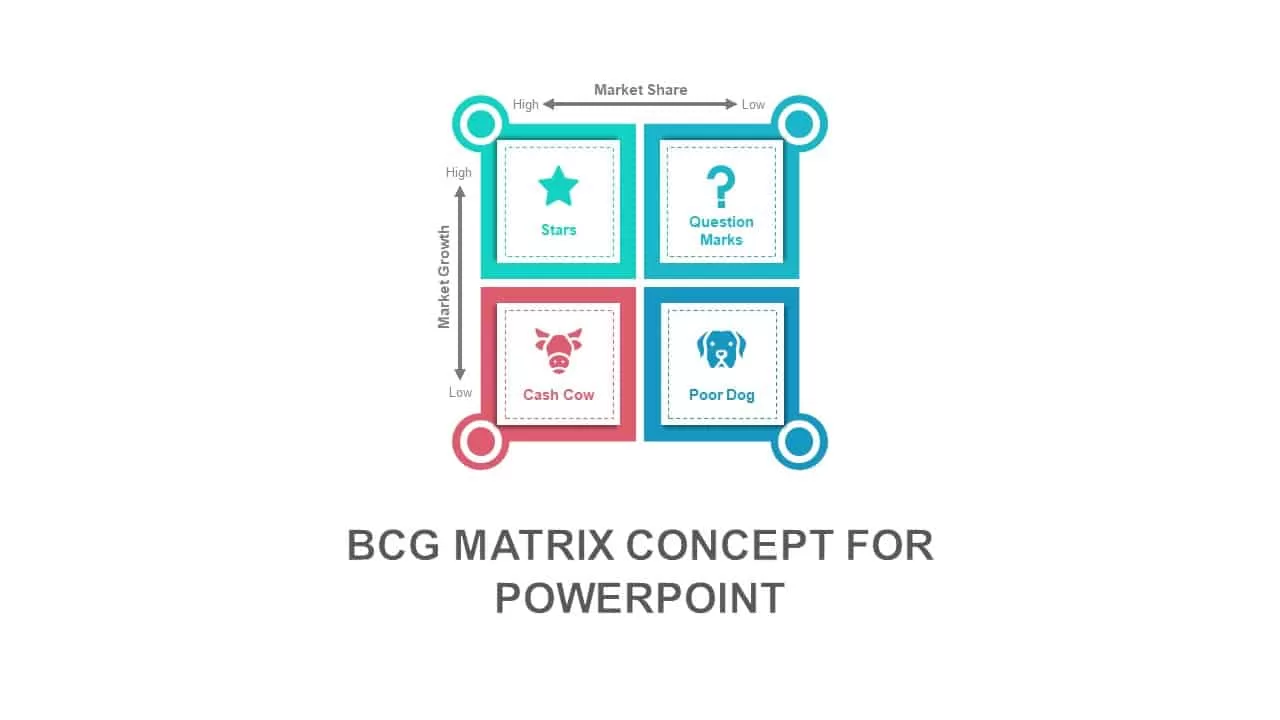
BCG Matrix Concept for PowerPoint Presentation
Business Models
Premium
-
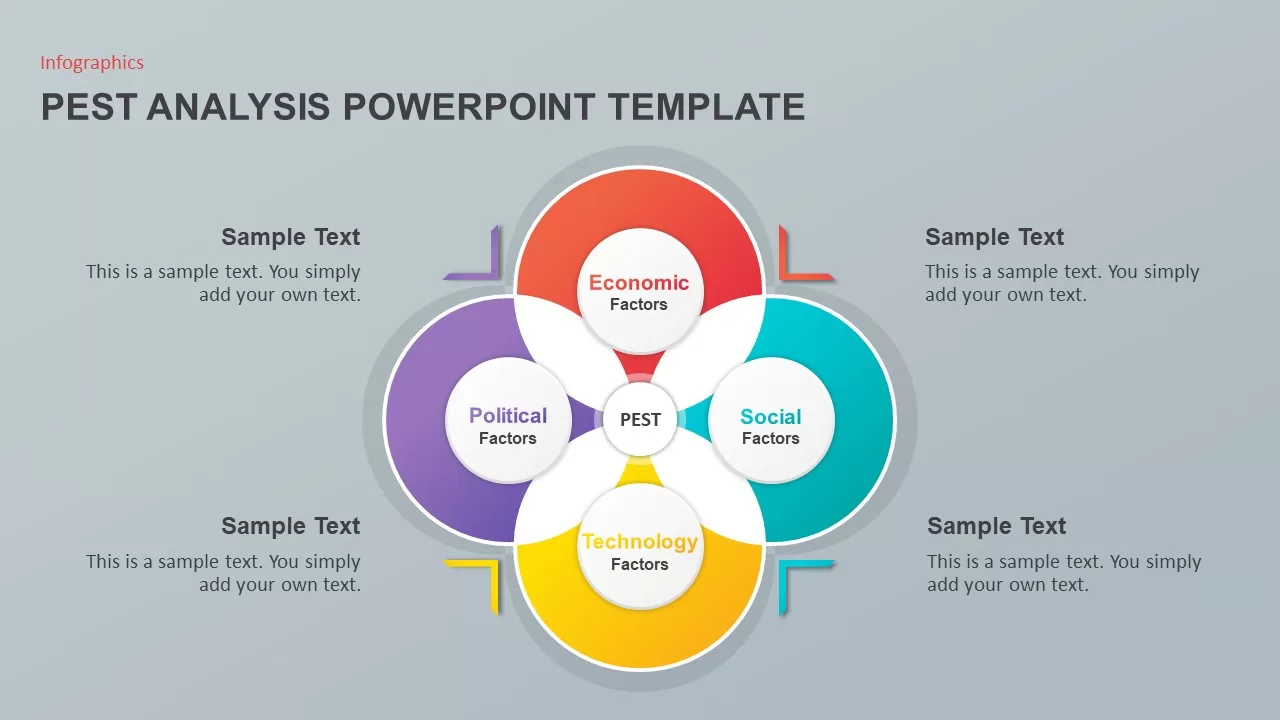
Pest Analysis PowerPoint Template
Diagrams
Premium
-

Financial Agreement Signing PowerPoint Template
Business Models
Premium
-
Sales Report Presentation PowerPoint Template
Business Models
Premium
-
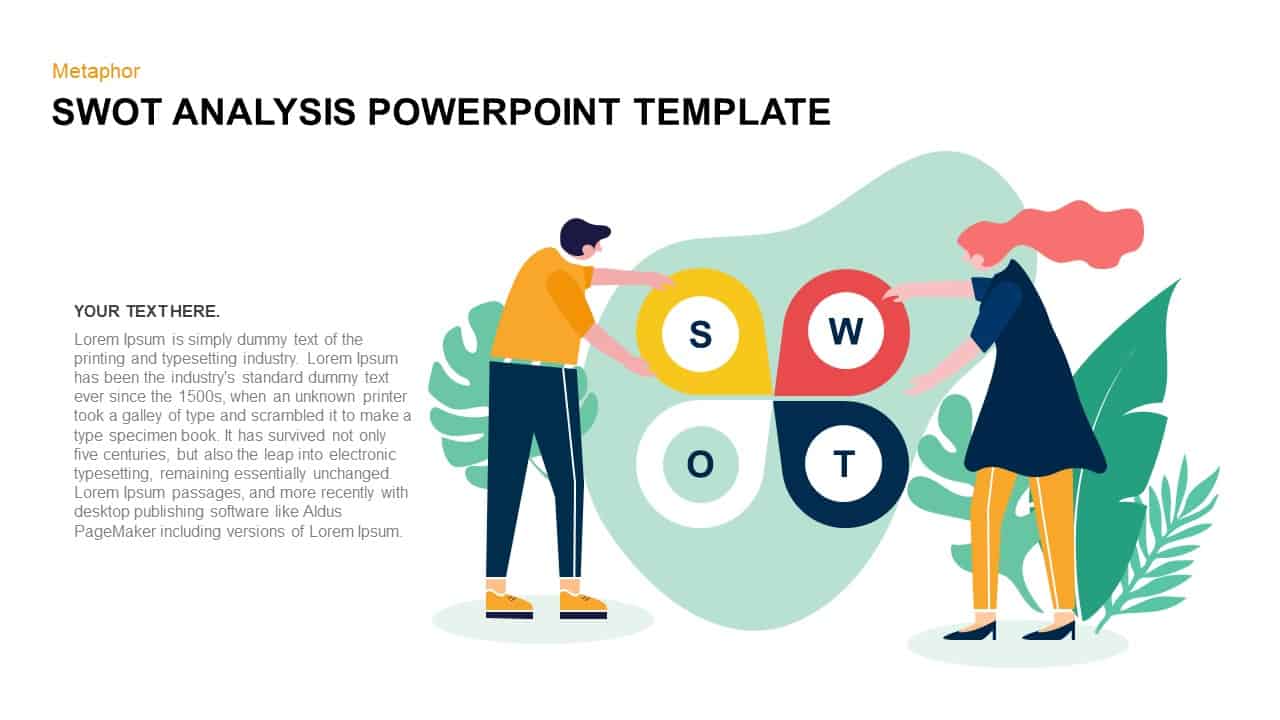
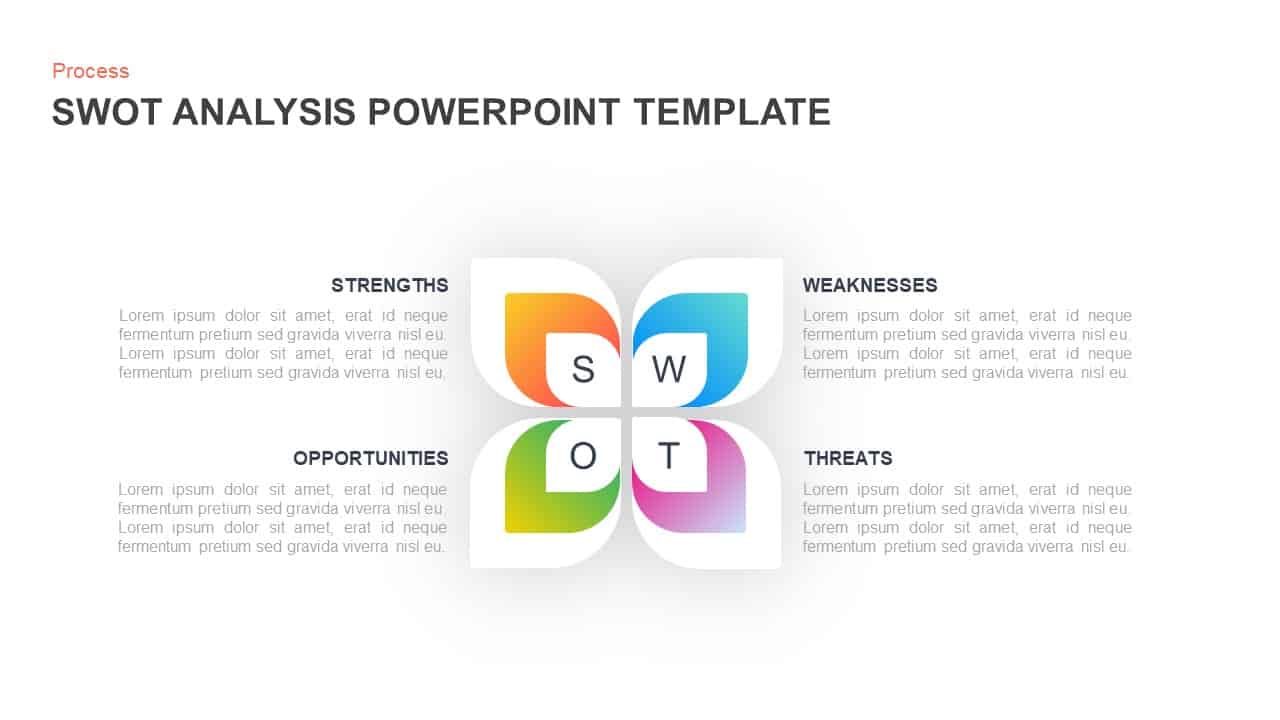
SWOT Analysis Template for PowerPoint Presentation
Business Models
Premium
-

Free Break Slide PowerPoint Template
Free PowerPoint Templates
Free
-
SWOT Analysis Template for PowerPoint & Keynote
Business Models
Premium
-
Free SWOT Analysis PowerPoint Template and Keynote Slide
Business Models
Free
-
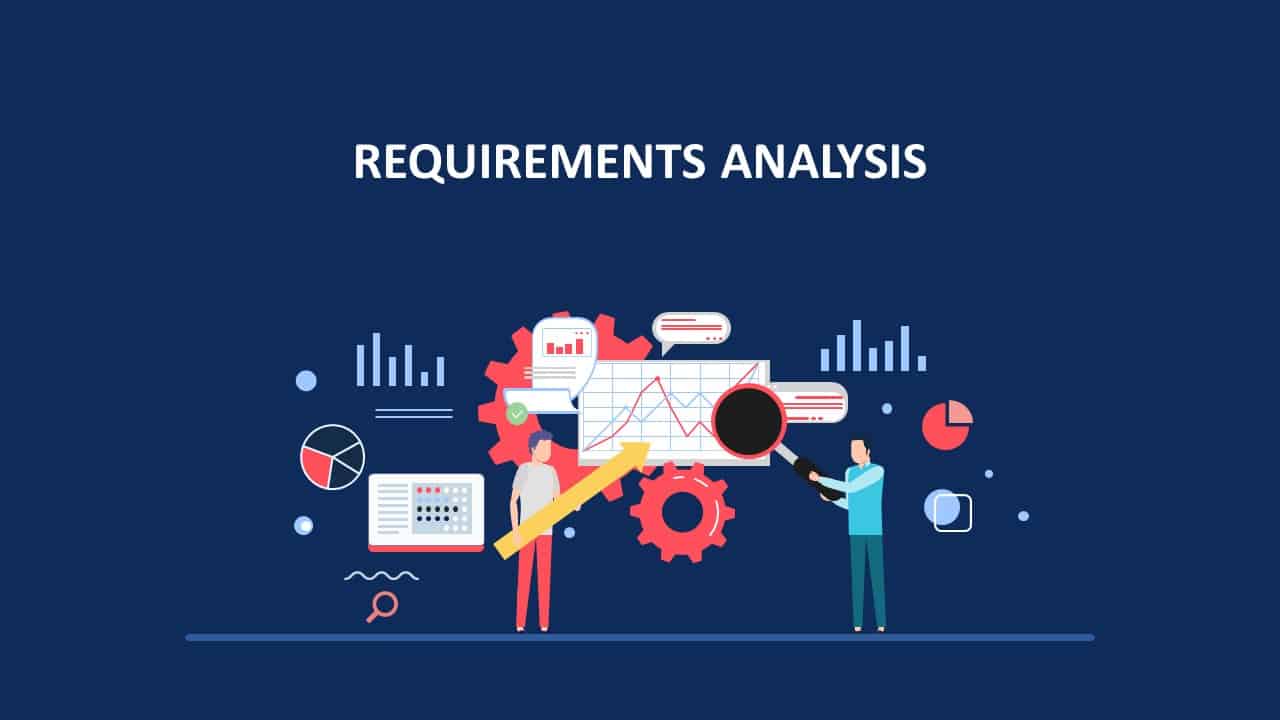
Requirements Analysis Ppt Template
Business Models
Premium
-
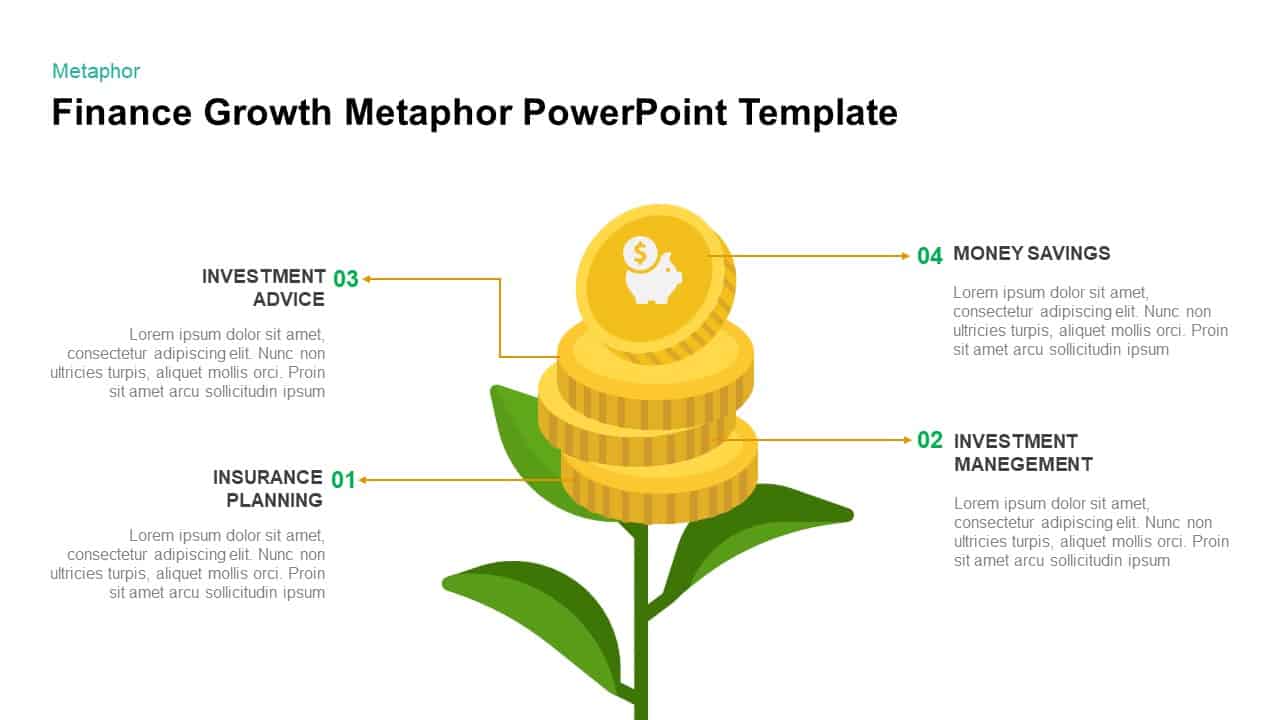
Financial Growth Template for PowerPoint & Keynote
Business Models
Premium
-
Line Chart Analysis PowerPoint Template and Keynote Slide
Curves and Lines
Premium
-
Global Market Drivers Analysis PowerPoint & Keynote
Circular Diagrams
Premium
-
PEST Analysis PowerPoint Template and Keynote Slide
Business Models
Premium
-
PESTLE Analysis Diagram Template
Business Models
Premium
-

Investment & Finance PowerPoint Theme
PowerPoint Themes
Premium
-
SWOT Analysis PowerPoint Template
Business Models
Premium
-
SWOT Analysis Diagram Template for PowerPoint & Keynote
Business Models
Premium
-
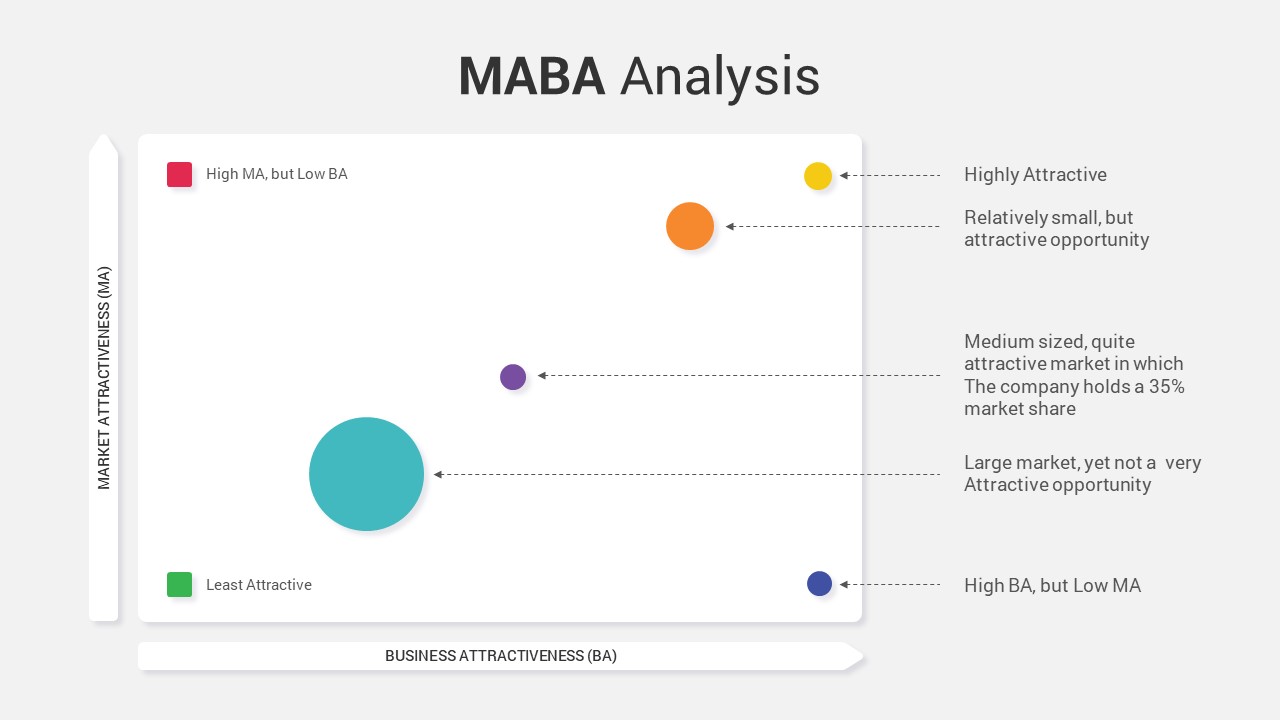
MABA Analysis PowerPoint Template
PowerPoint Templates
Premium
-

Black and Green Theme PowerPoint Template
PowerPoint Templates
Premium
-
SWOT Analysis PowerPoint Slide
Business Models
Premium
-
SWOT Analysis Template for Presentation
Business Models
Premium
-
SWOT Analysis Table Template for PowerPoint and Keynote
Business Models
Premium
-
Data Driven Line Chart Template for PowerPoint & Keynote
Curves and Lines
Premium
-
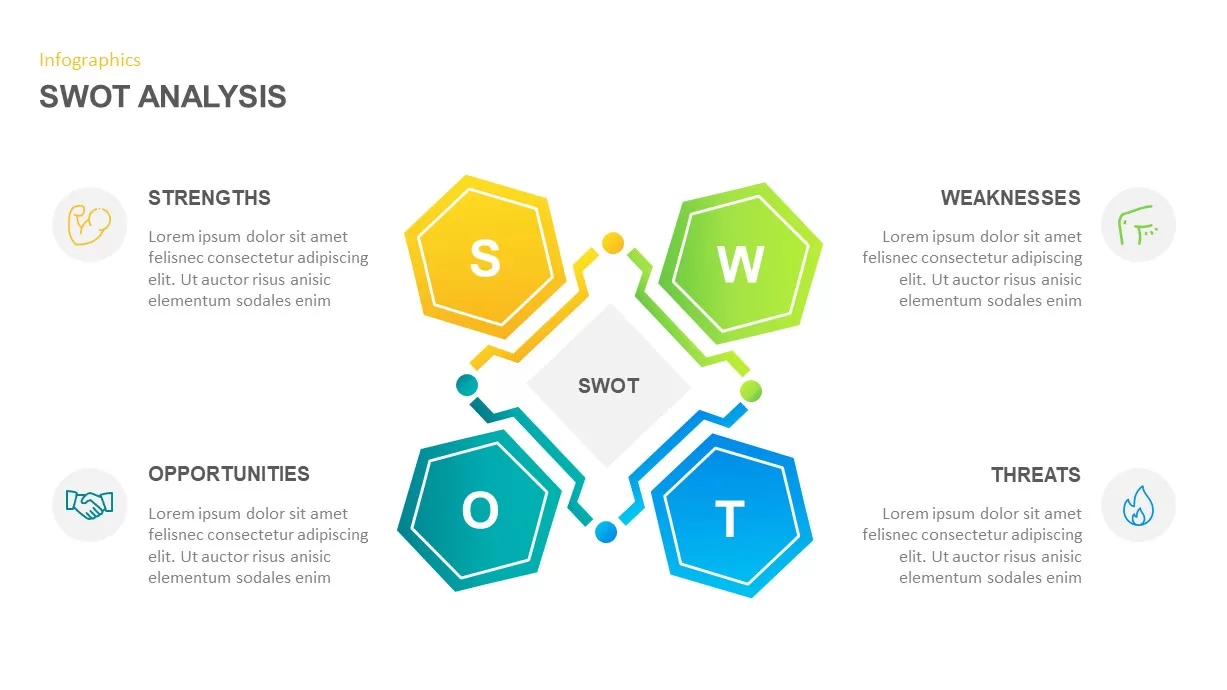
Circle SWOT Analysis PowerPoint Template and Keynote Slide
Business Models
Premium
-
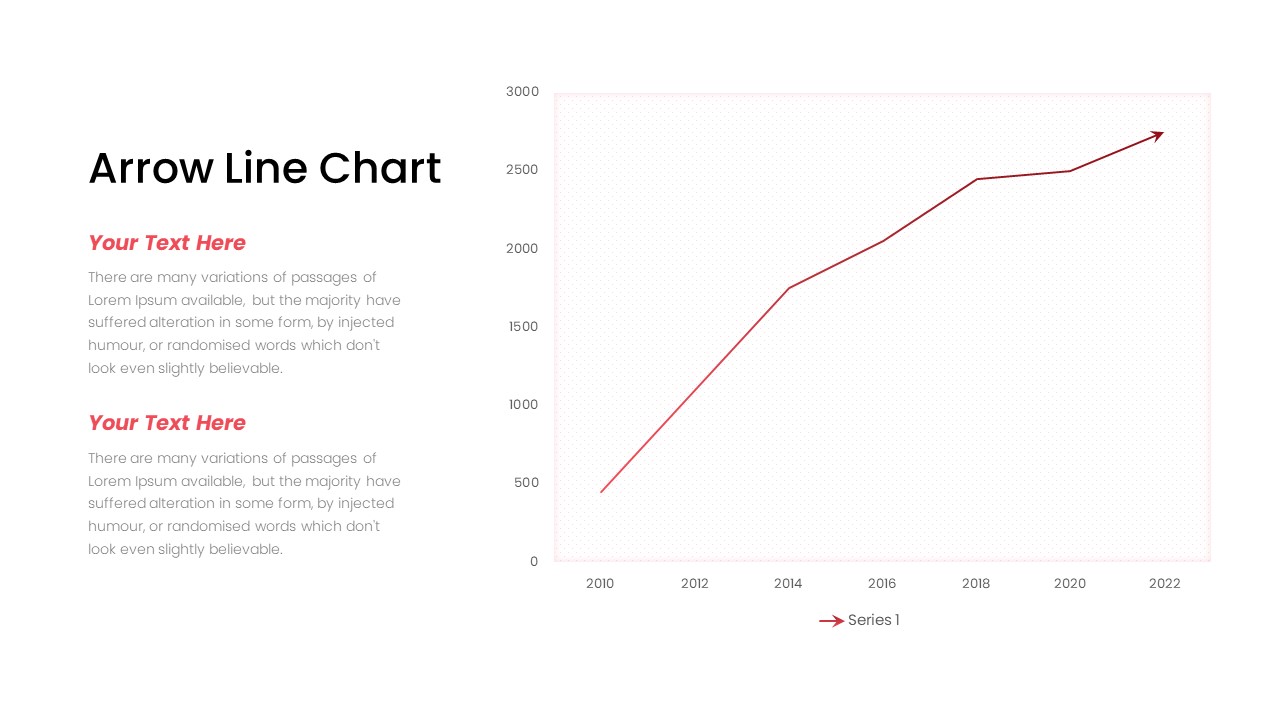
Arrow Line Chart PowerPoint Template
Arrow Diagrams
Premium
-

Investor Pitch Deck
PowerPoint Templates
Premium
-
Free Competitor Analysis PowerPoint Template
Infographic
Free
-
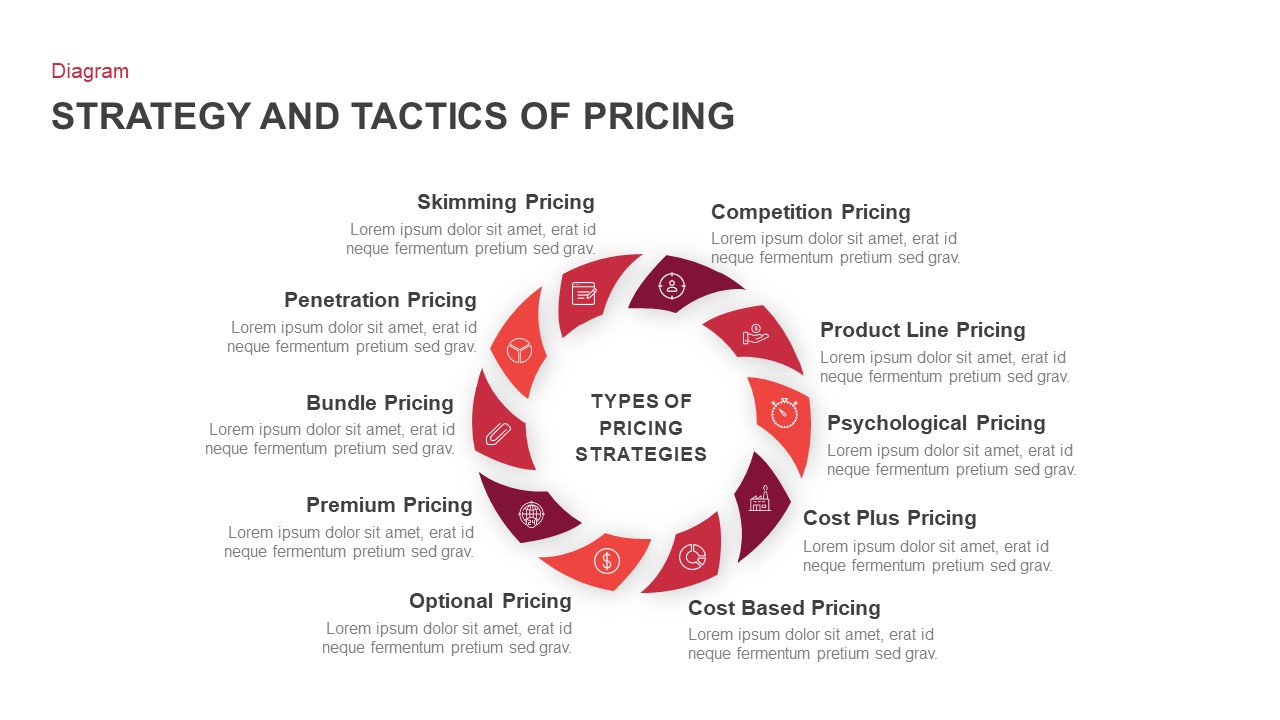
Strategy Tactics Pricing PowerPoint Template
Circular Diagrams
Premium
-
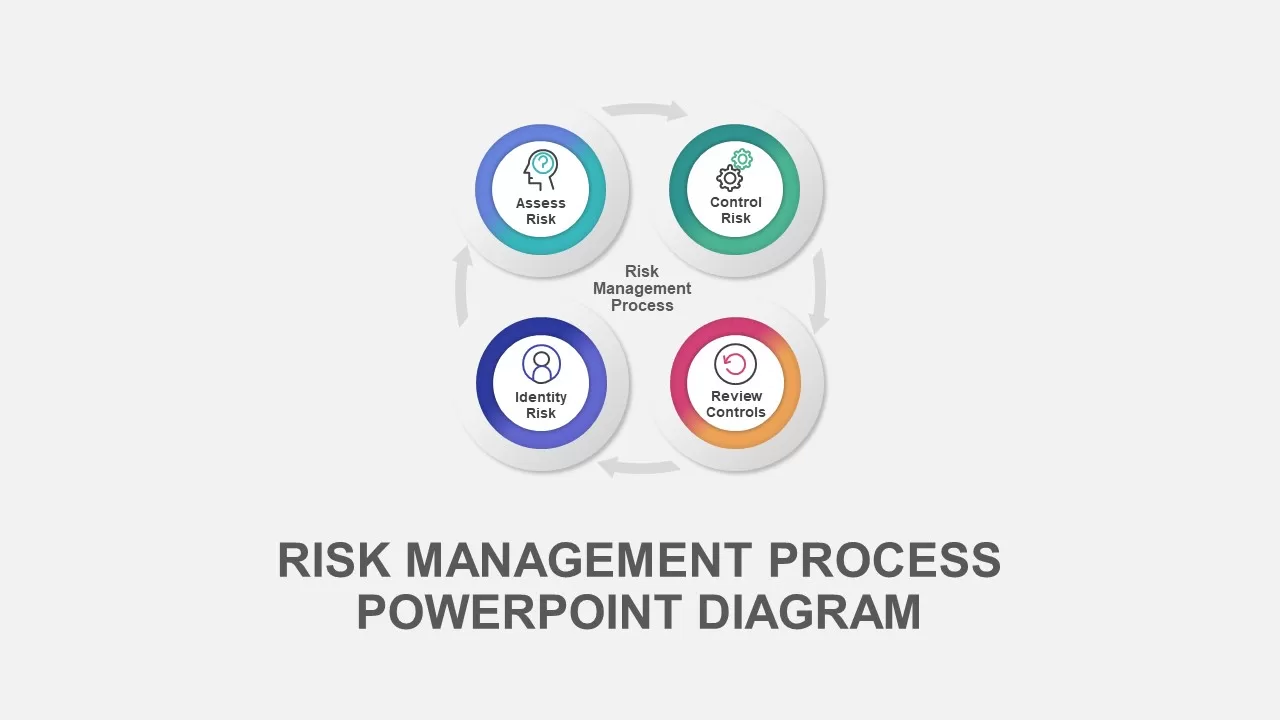
Risk Management Process Diagram for PowerPoint
Business Models
Premium
-

Combination Chart PowerPoint Template
PowerPoint Charts
Premium
-

Dashboard Template for PowerPoint Presentation
PowerPoint Charts
Premium
-
Free Business Plan PowerPoint Deck
PowerPoint Templates
Free
-

Creative Bar Chart Data Analysis PowerPoint Template and Keynote
Infographic
Premium
-
Business Innovation PowerPoint Template for Presentation
Business Models
Premium
-
Metaphor Business Meeting PowerPoint Template and Keynote Slide
Infographic
Premium
-
Business Case PowerPoint Template
Keynote Templates
Premium
-

Corporate Consulting PowerPoint Theme
PowerPoint Themes
Premium
-

Recruiting Process Template for PowerPoint Presentation
PowerPoint Templates
Premium
-
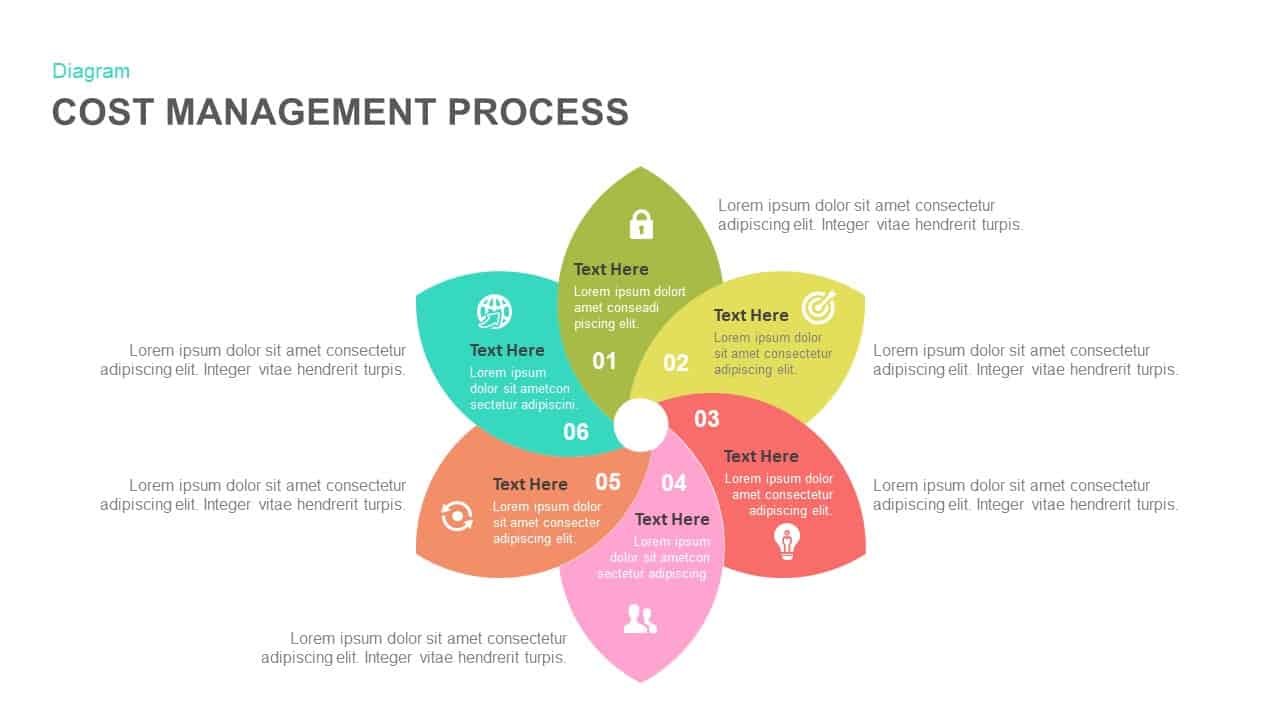
Cost Management Process Template for PowerPoint and Keynote
Diagrams
Premium
-
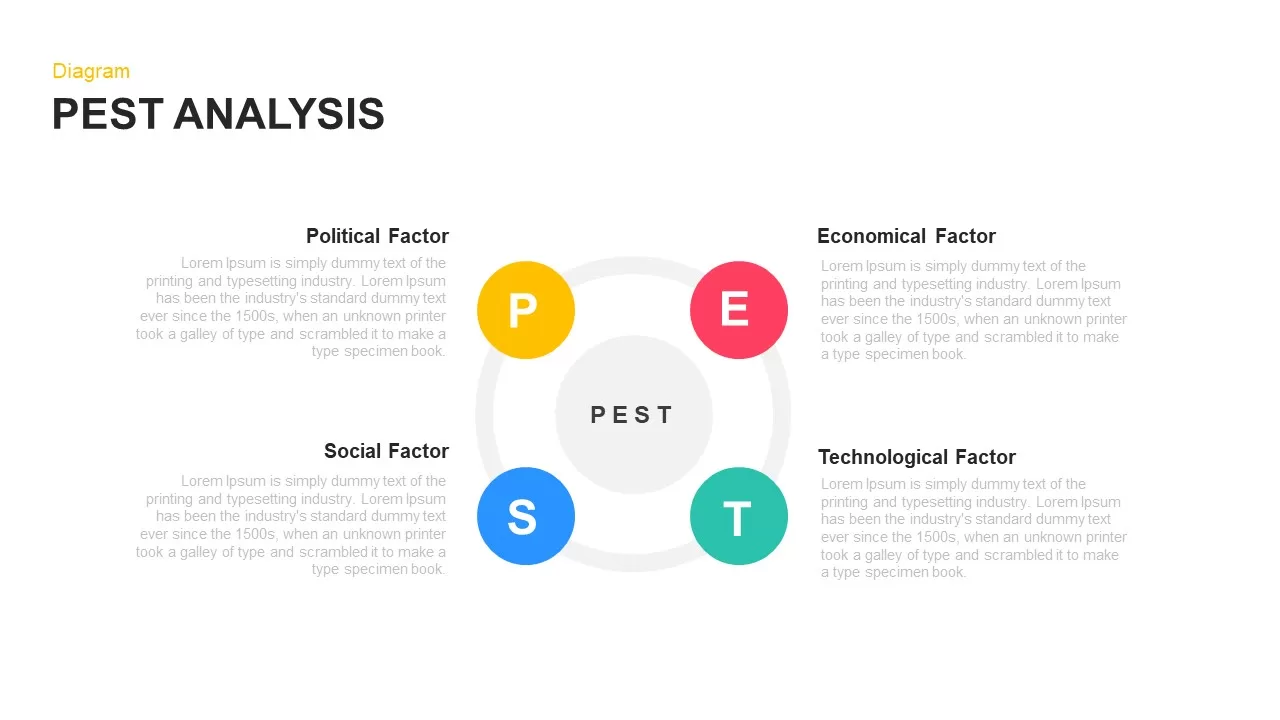
PEST Analysis PowerPoint Template and Keynote
Diagrams
Premium
-

Financial Institution PowerPoint Template
PowerPoint Business Templates
Premium
-
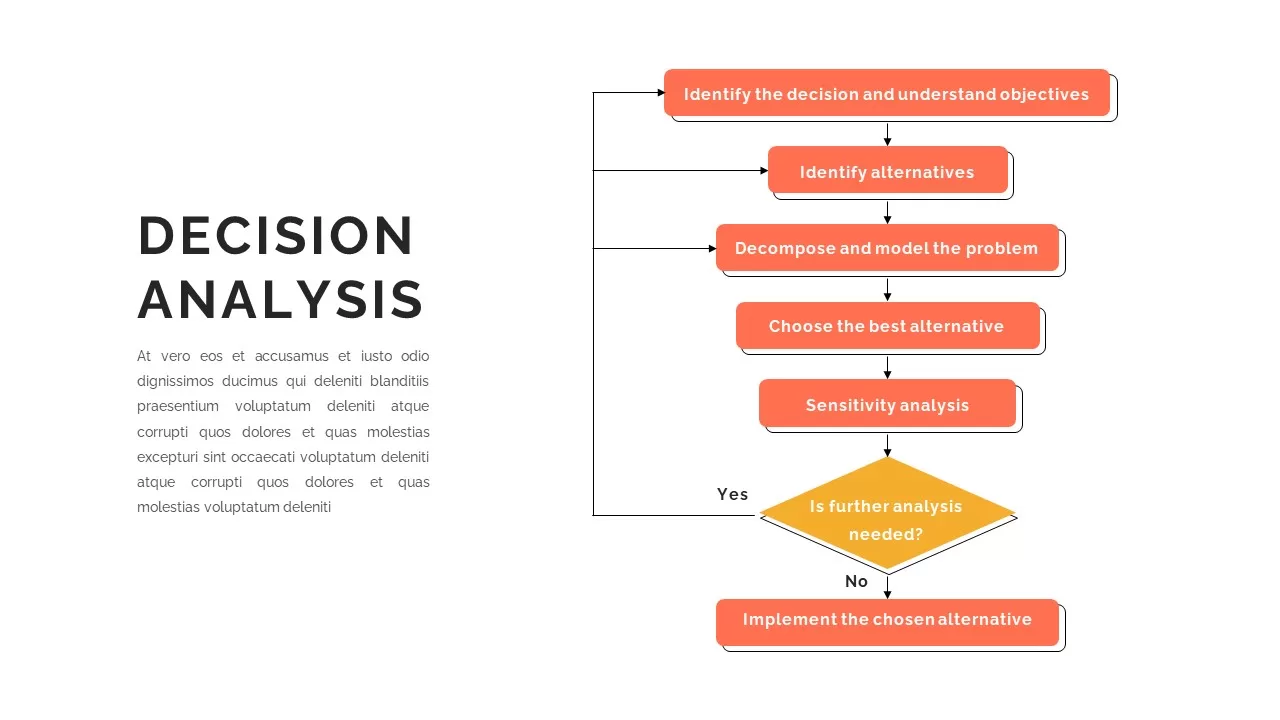
Decision Analysis Template
Flow Charts
Premium
-
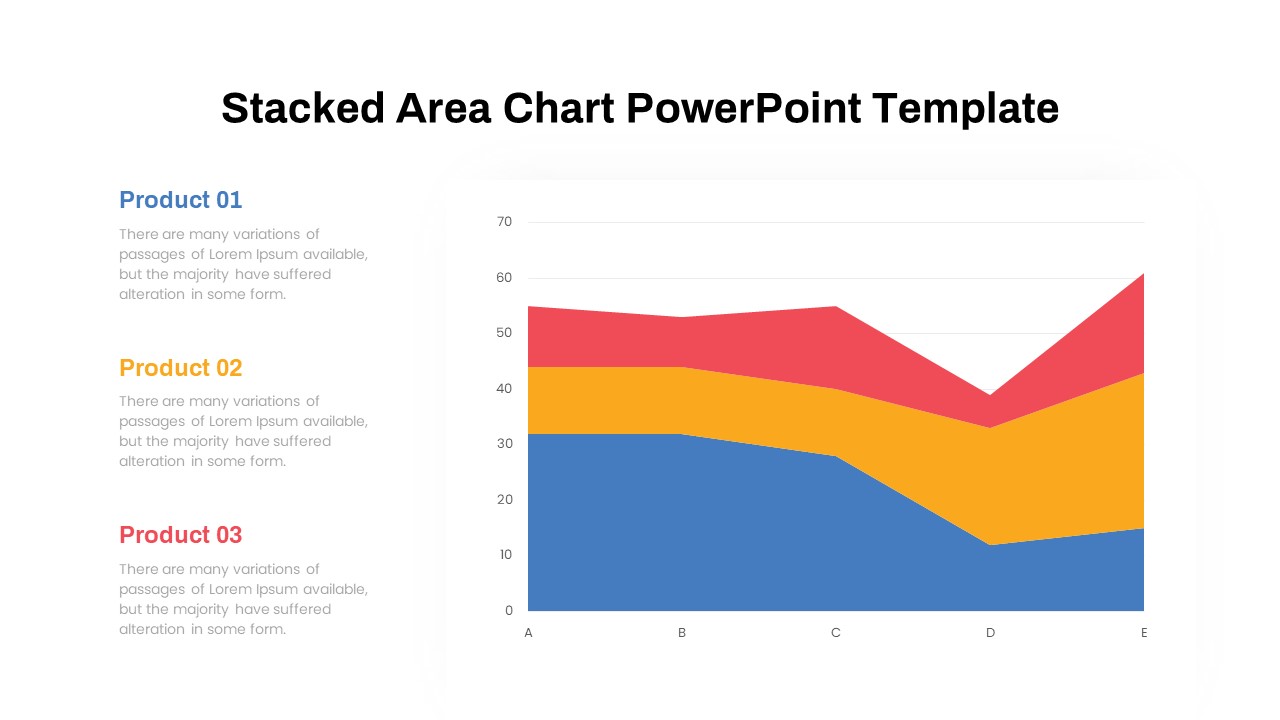
Stacked Area Chart PowerPoint Template
PowerPoint Charts
Premium
-
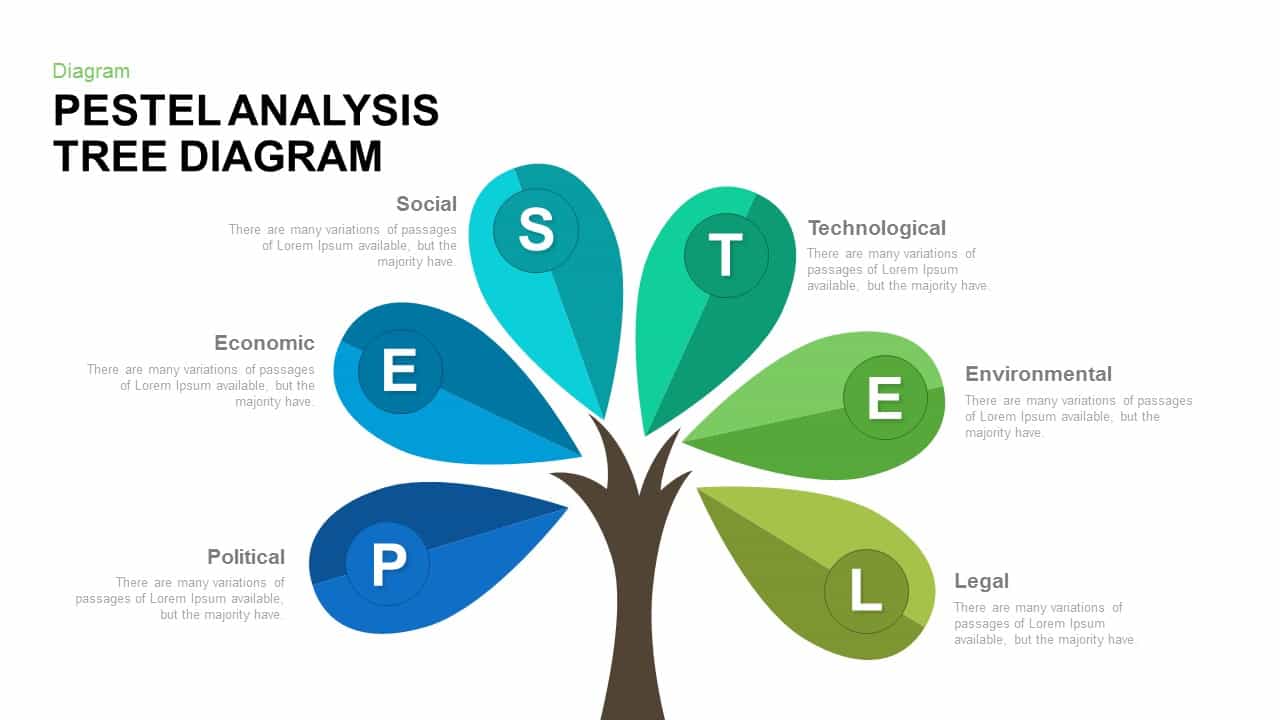
PESTEL Analysis Tree Diagram PowerPoint Template and Keynote
Diagrams
Premium