


Break-Even Analysis PowerPoint Template 6
This template is part of a deck featuring multiple slides. To check out all slides, click on See All.
See All


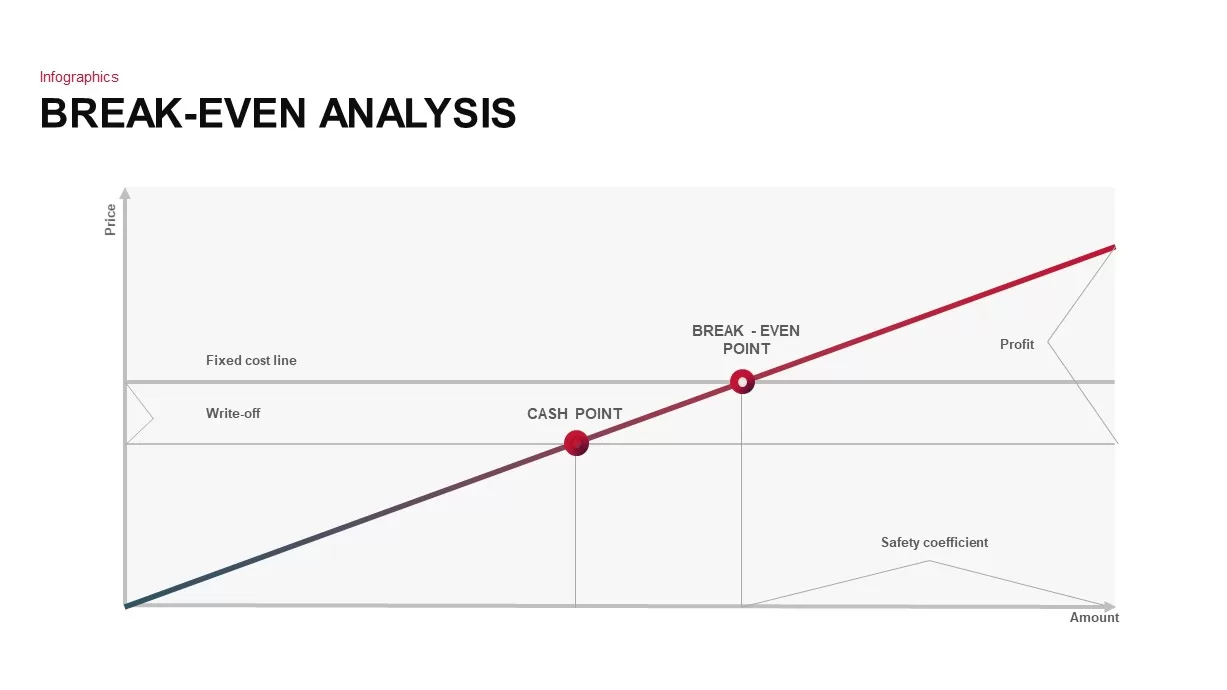
Break-Even Point Curves for PowerPoint
Break-even analysis PowerPoint template contains a set of statistical graphs to point out businesses' existing situations. A break-even analysis is a business tool that helps you to define at what stage your company, or a new service/ product, will be profitable. In other words, it’s a financial calculation for determining the number of products/services a company should sell to cover its costs (mainly fixed costs). The financial PowerPoint template can use to showcase at what point your company or business starts to make profits. This type of analysis tool helps the stakeholders to decide whether they have to invest or not. Break-even analysis is beneficial in reviewing the relationship between the variable cost, fixed cost, and revenue. Why break-even analysis is useful:- It supports determining the remaining/unused capacity of the concern once the break-even is touched. This will help to display the maximum profit on a particular product/service that can be produced.
- It helps to define the impact on profit on changing to automation from manual (a fixed cost replaces a variable cost).
- It helps to determine the change in profits if the price of a product is altered.
- It helps to determine the number of losses that could be continued if there is a sales decline.