


Break-Even Analysis PowerPoint Template


- Version
- Download 66
- File Size 0.00 KB
- File Count 1
- Create Date May 28, 2020
- Last Updated February 15, 2024
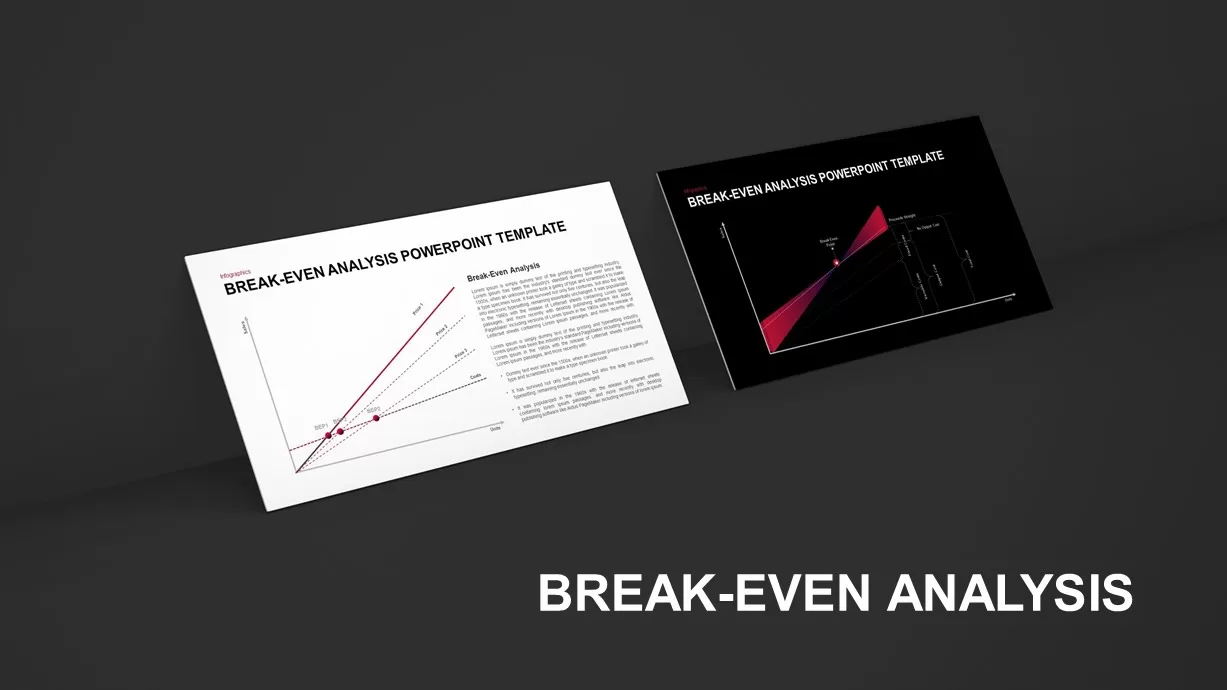
Break-Even Analysis PowerPoint Template
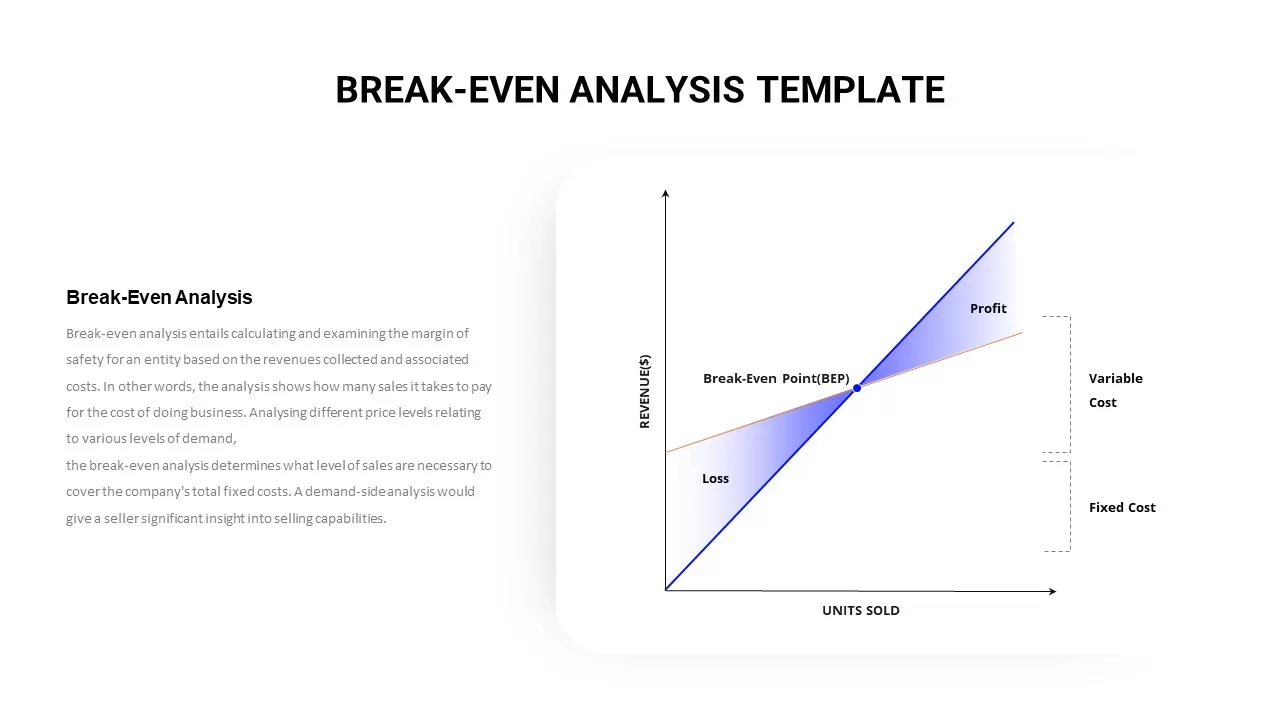
Break-Even Point Curves for PowerPoint
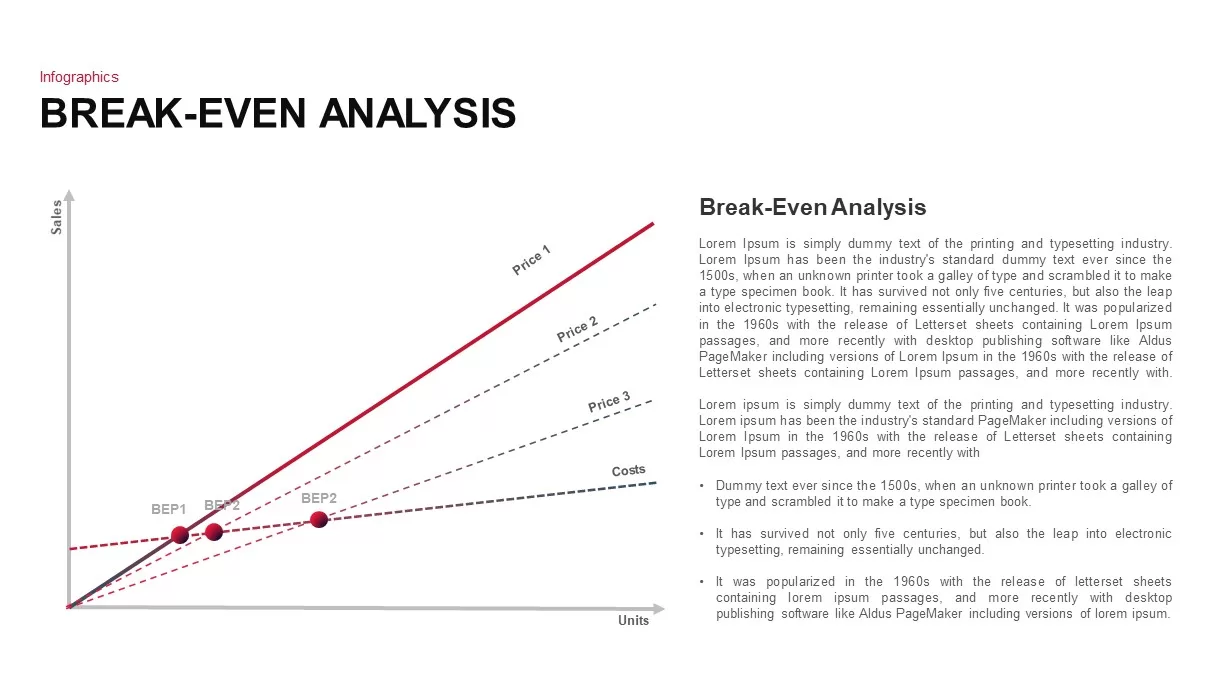
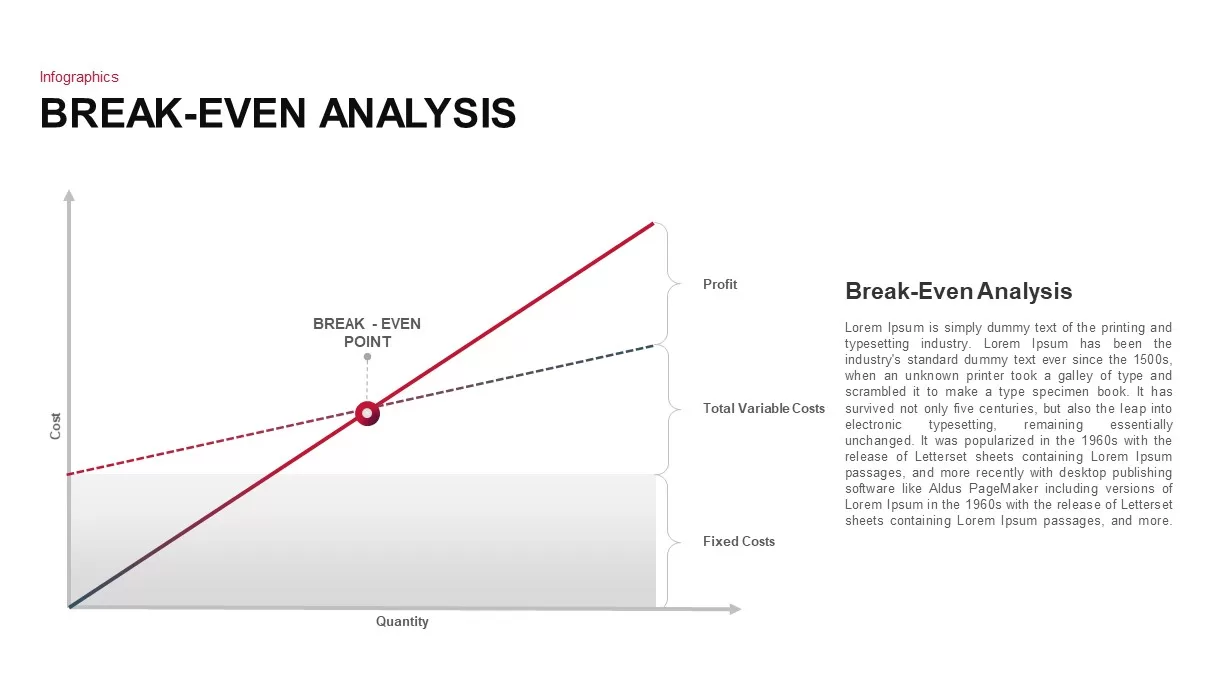
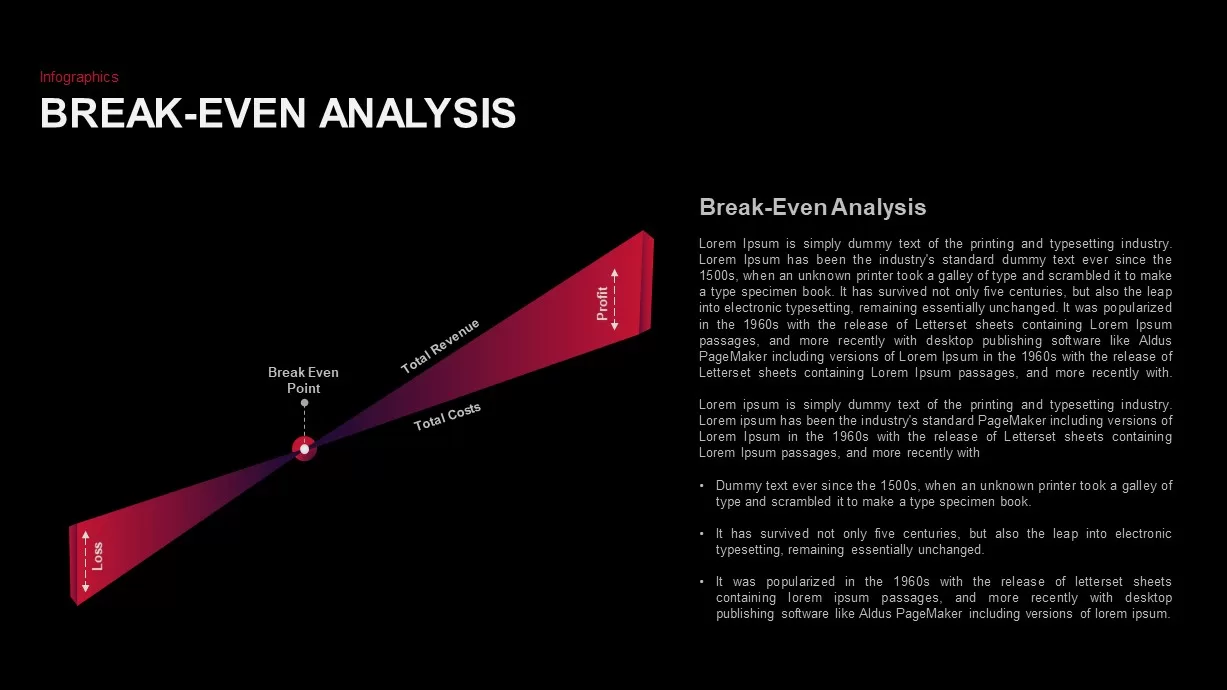
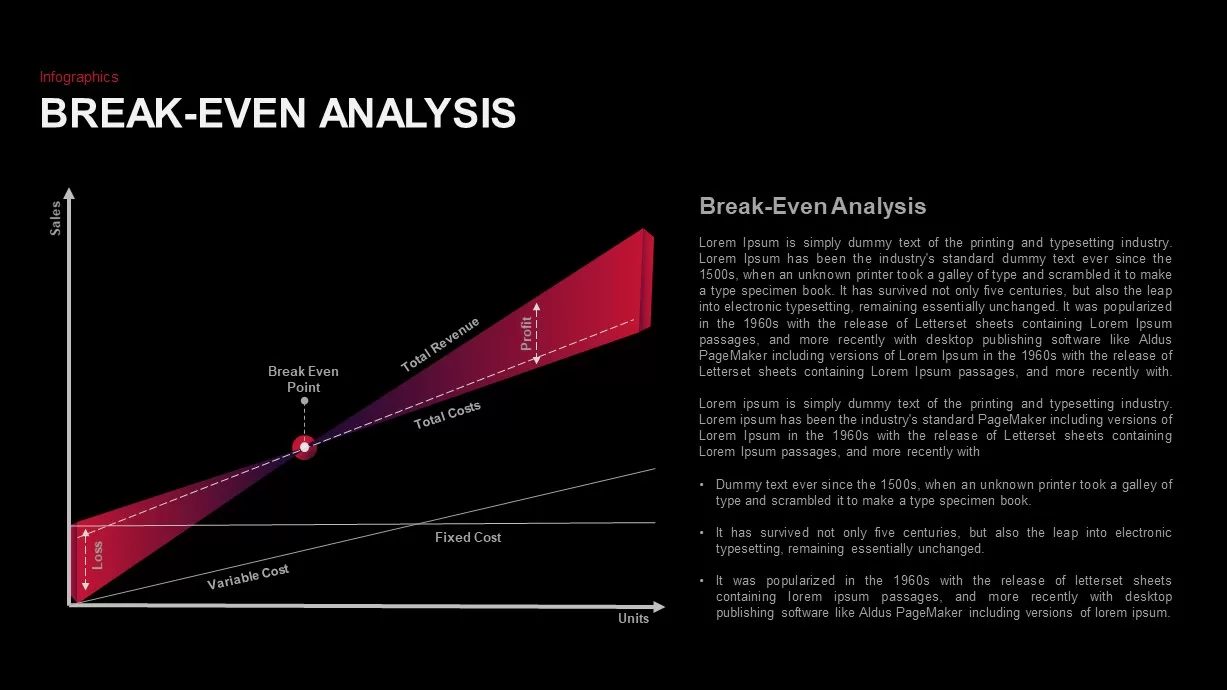
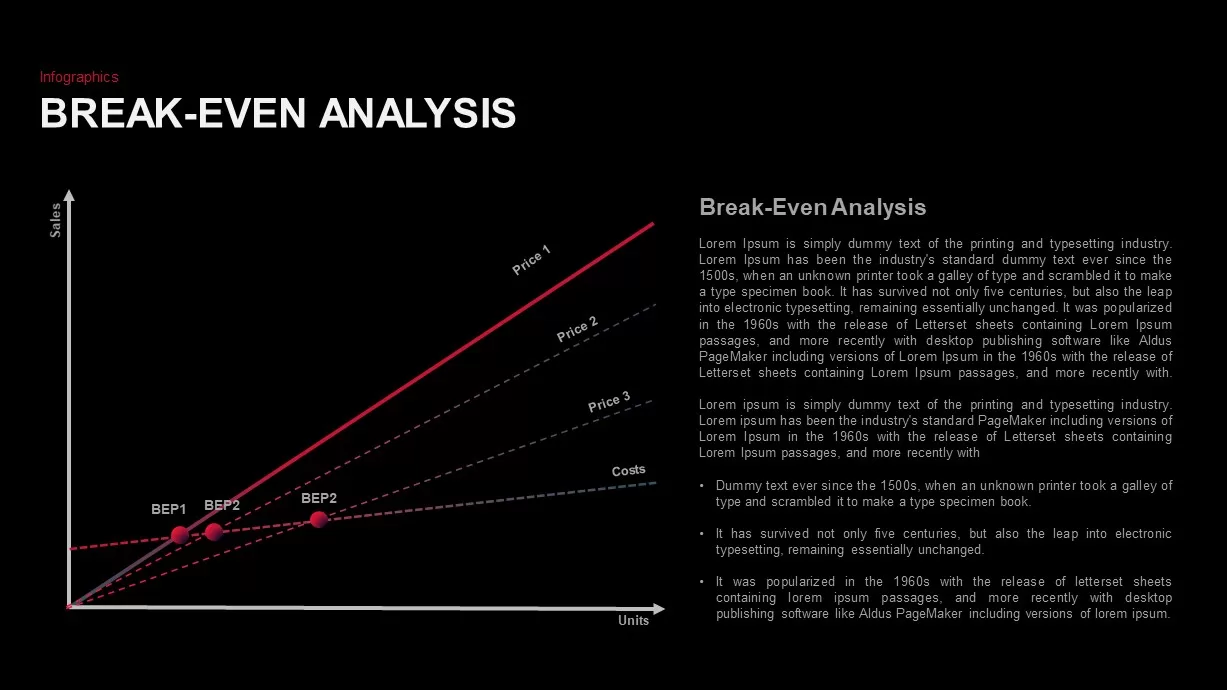
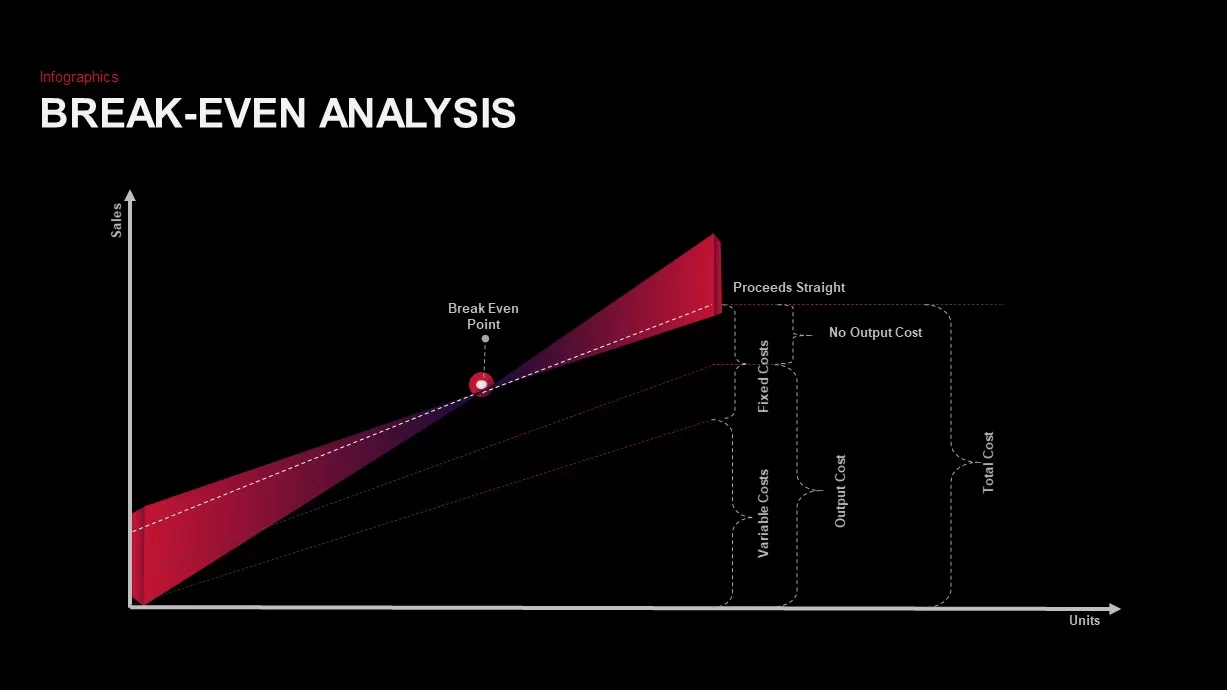
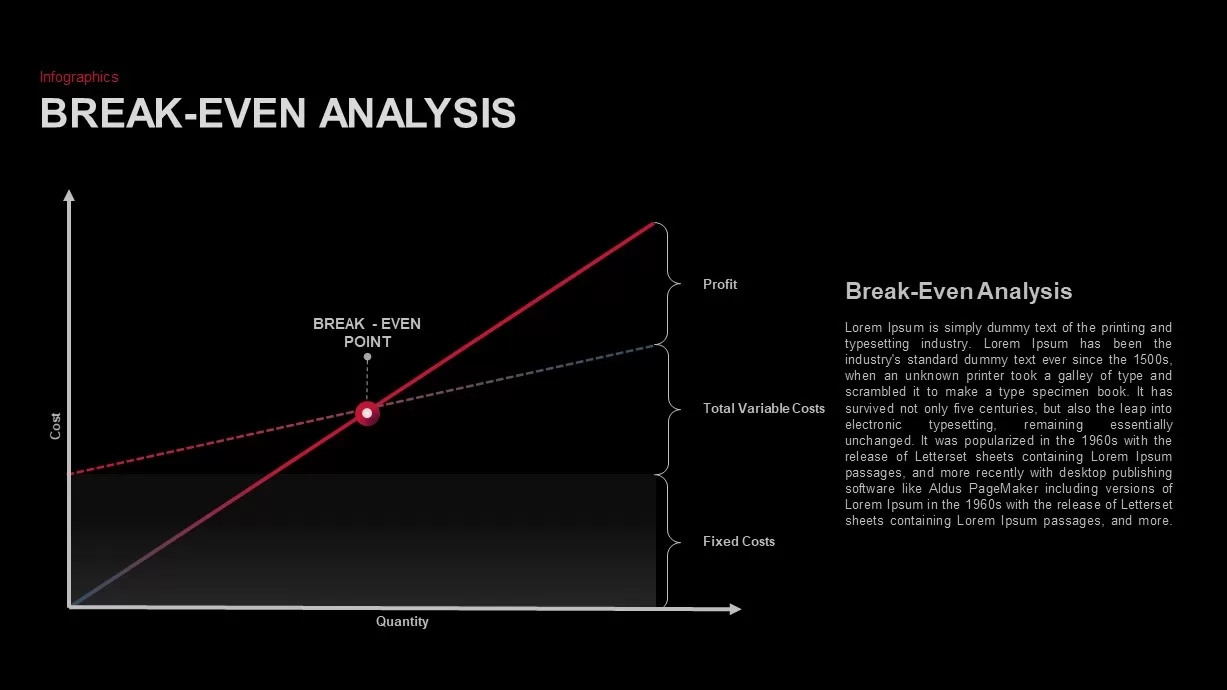
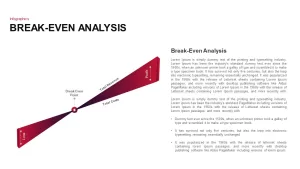
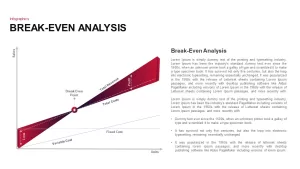
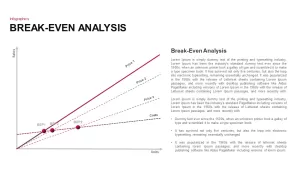
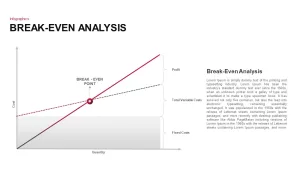
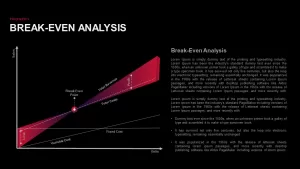
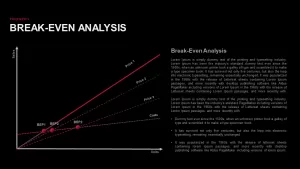
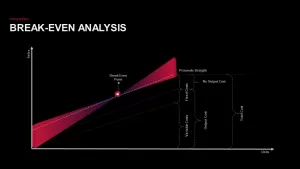
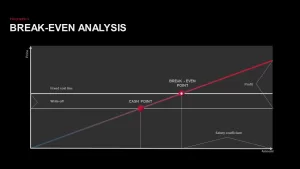
Break-even analysis PowerPoint template contains a set of statistical graphs to point out businesses' existing situations. A break-even analysis is a business tool that helps you to define at what stage your company, or a new service/ product, will be profitable. In other words, it’s a financial calculation for determining the number of products/services a company should sell to cover its costs (mainly fixed costs). The financial PowerPoint template can use to showcase at what point your company or business starts to make profits. This type of analysis tool helps the stakeholders to decide whether they have to invest or not. Break-even analysis is beneficial in reviewing the relationship between the variable cost, fixed cost, and revenue.
Why break-even analysis is useful:
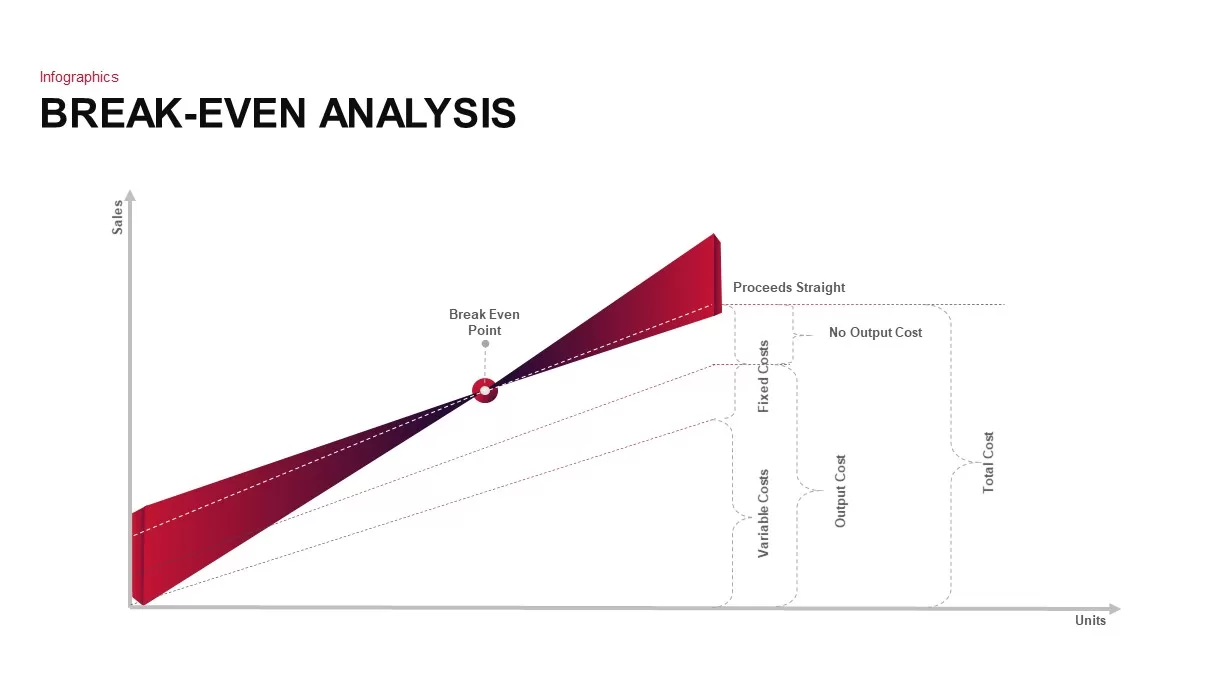
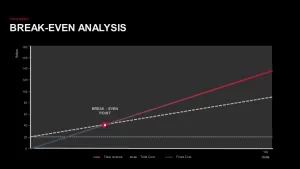
- It supports determining the remaining/unused capacity of the concern once the break-even is touched. This will help to display the maximum profit on a particular product/service that can be produced.
- It helps to define the impact on profit on changing to automation from manual (a fixed cost replaces a variable cost).
- It helps to determine the change in profits if the price of a product is altered.
- It helps to determine the number of losses that could be continued if there is a sales decline.
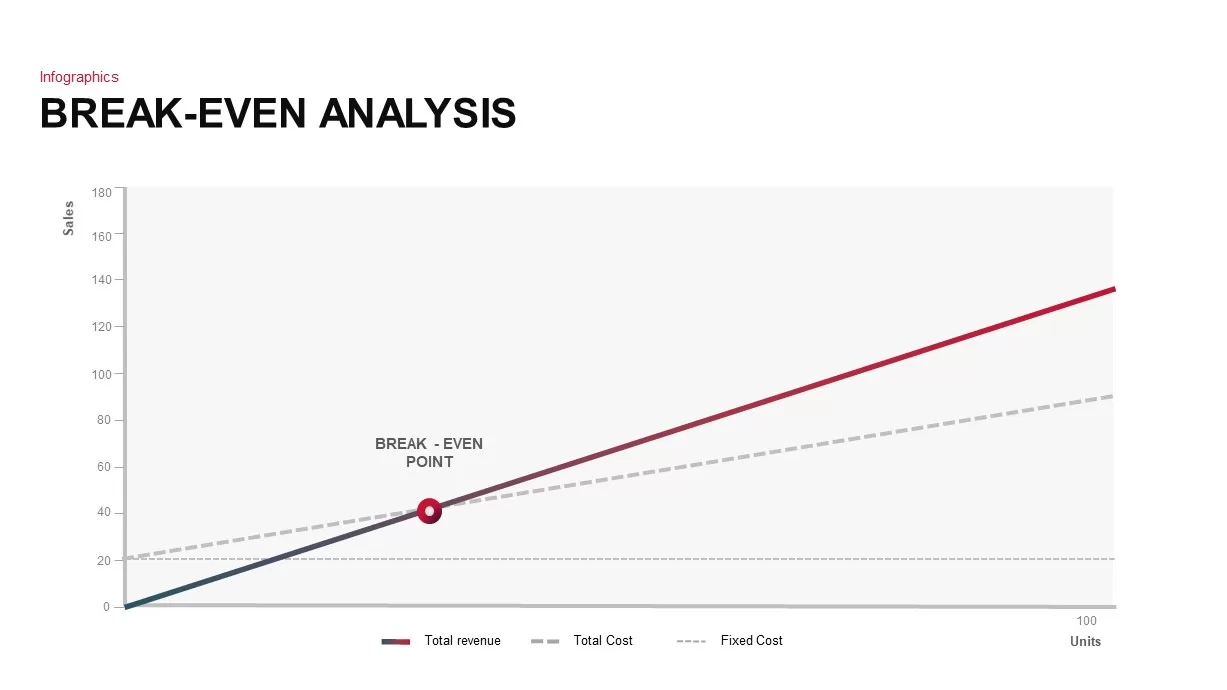
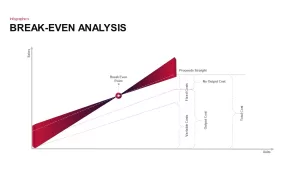
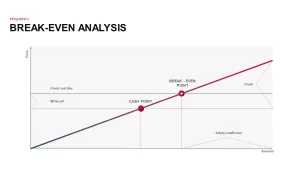
Break-even analysis PowerPoint template is the latest ppt template created with a line graph showing the financial data of the business and its profit-giving points. This statistical template is created for highly professional managers to present the conditions of a business and its financial scenarios. So, the break-even ppt template is a perfect financial diagram ppt presentation for both fundamental and technical analysts. The presenters can make changes in the color and size of the diagram and put their findings on the placeholder zones. It is better to avoid making changes in the line graph PowerPoint because the cumulative points may be disturbed when you are making such efforts. So, it is better to maintain the default structure of the PowerPoint design for accurate presentation.
Attached Files
| File |
|---|
| https://premiumdownloads.s3.amazonaws.com/SB01696-Break Even Analysis PowerPoint Template.zip |
Login to download this file
Add to favorites
Add to collection
-

Item ID
SB01696 -

Related Templates
-
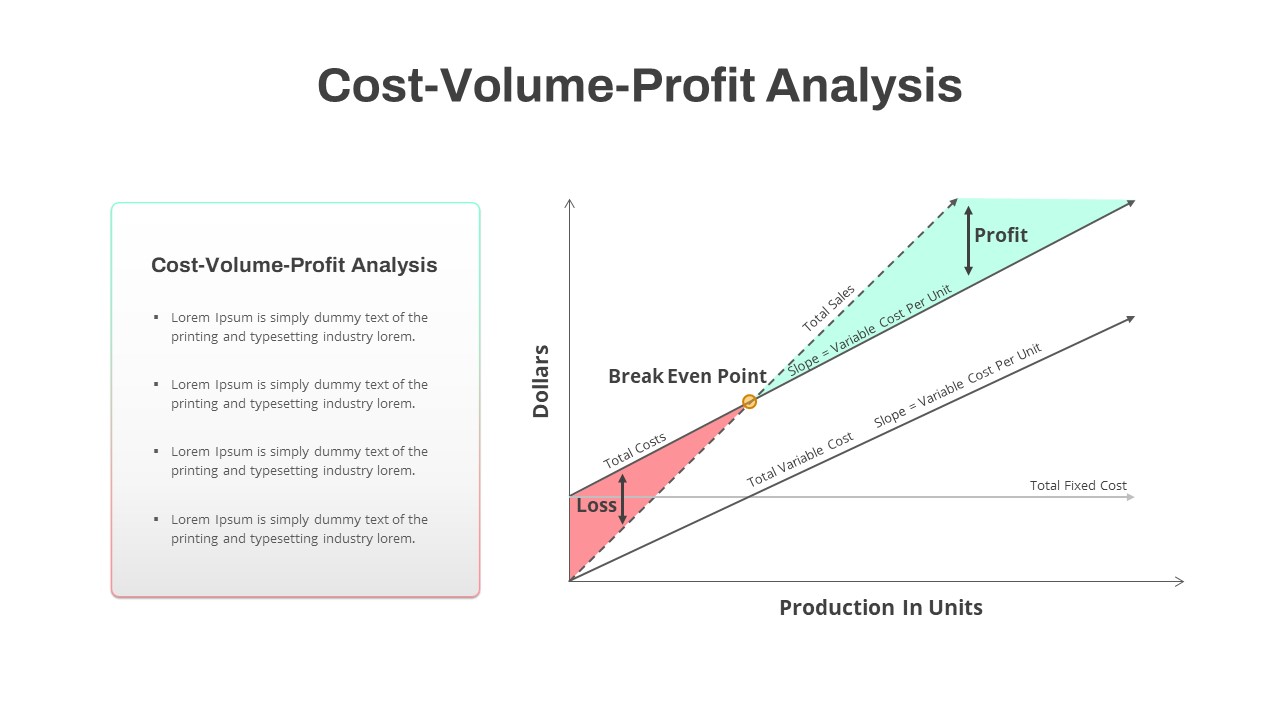
Cost Volume Profit Analysis PowerPoint Template
PowerPoint Templates
Premium
-
Break-Even Analysis Template
PowerPoint Charts
Premium
-
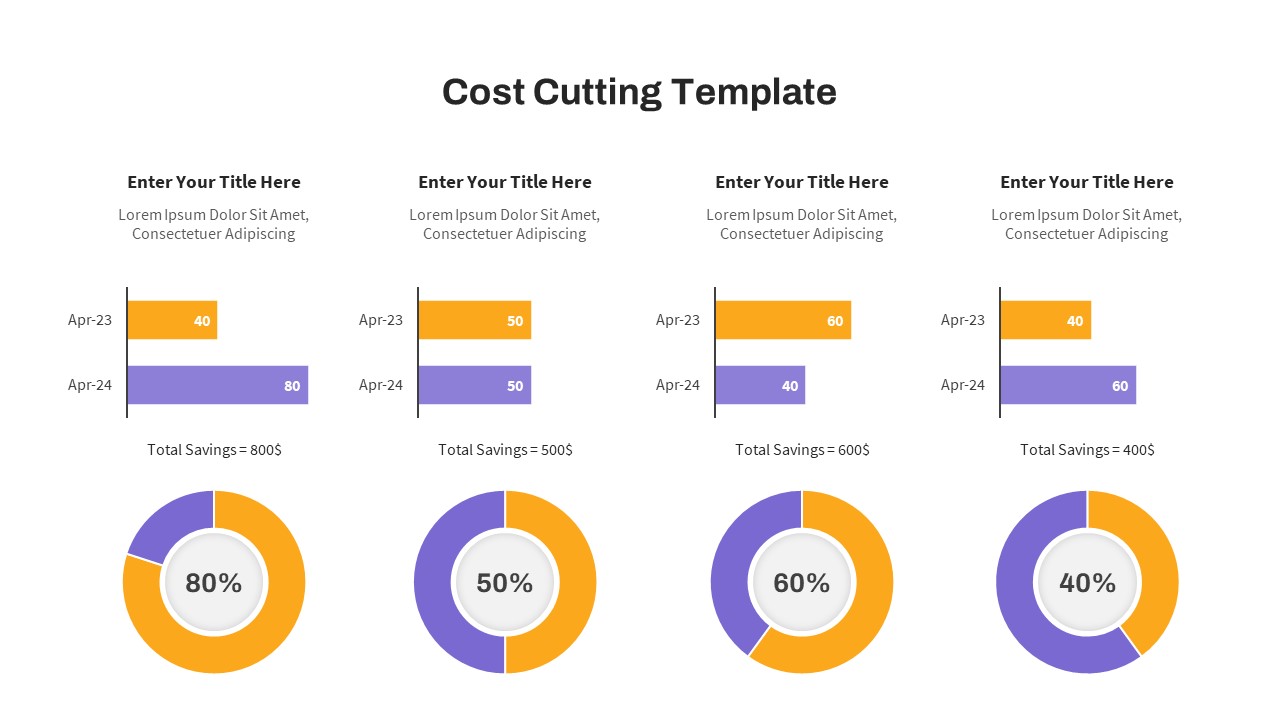
Cost Cutting PowerPoint Template
Infographic
Premium
-
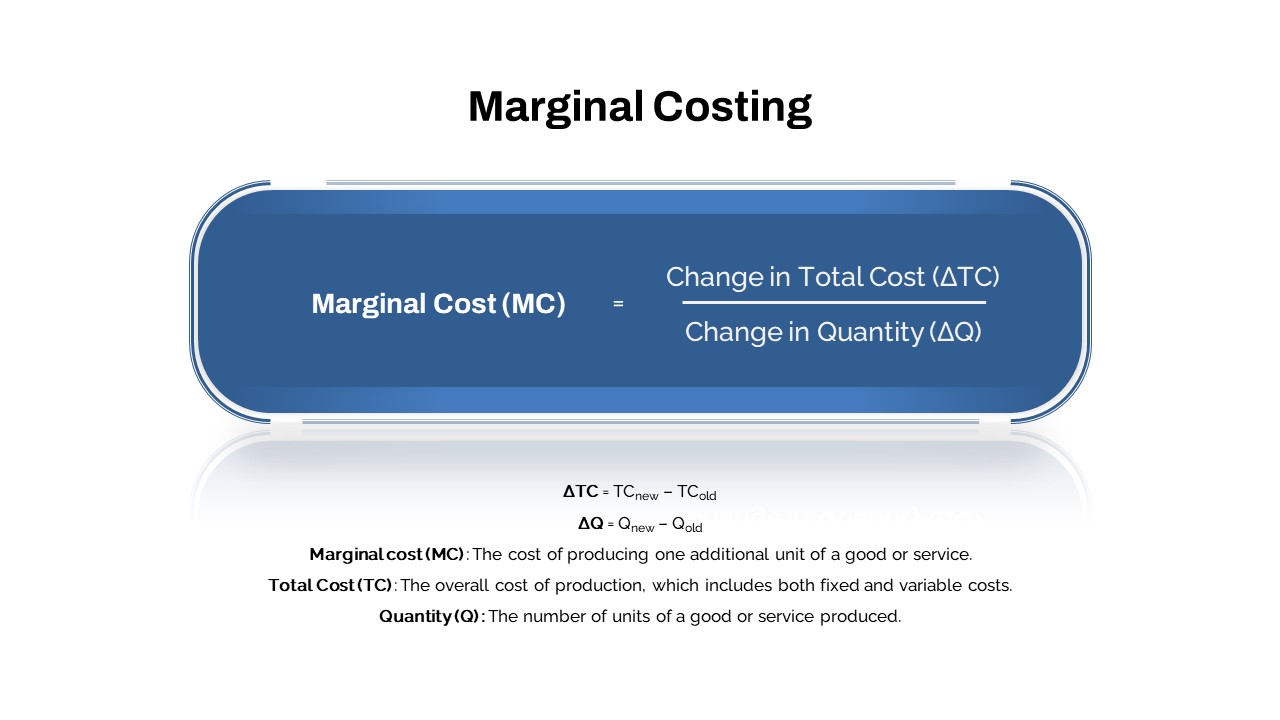
Marginal Costing PowerPoint Template
PowerPoint Templates
Premium
-
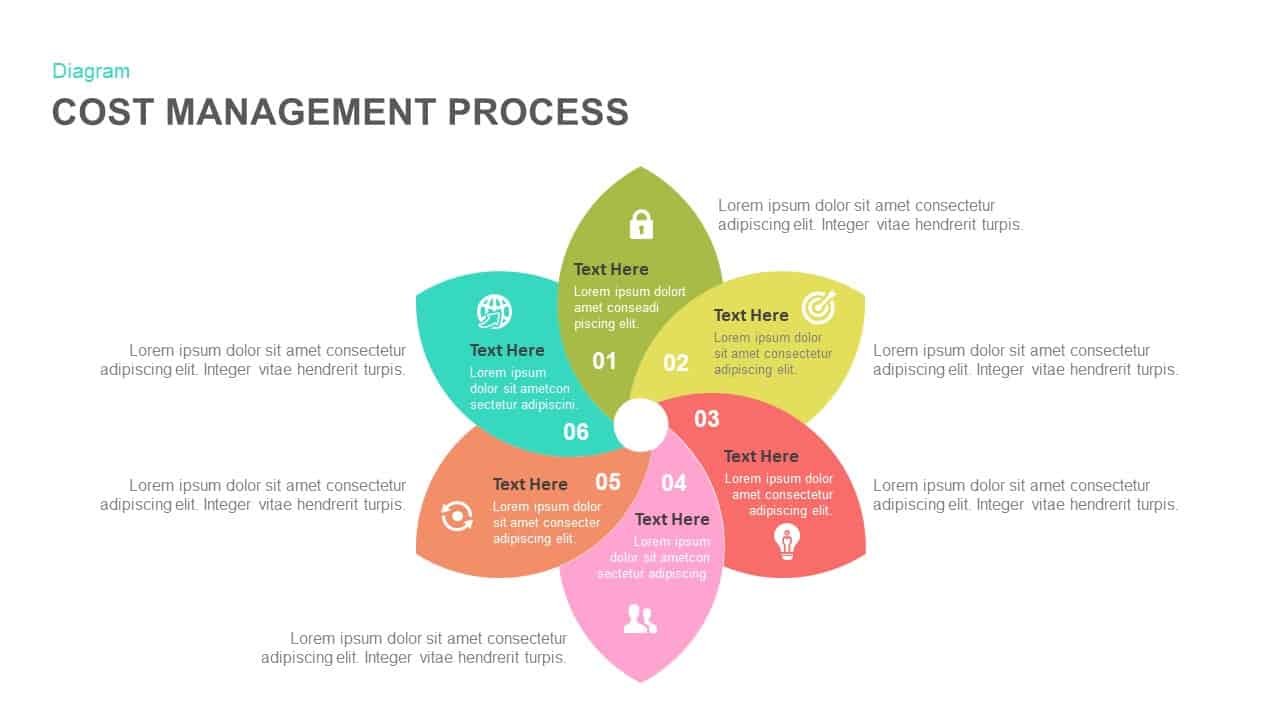
Cost Management Process Template for PowerPoint and Keynote
Diagrams
Premium
-
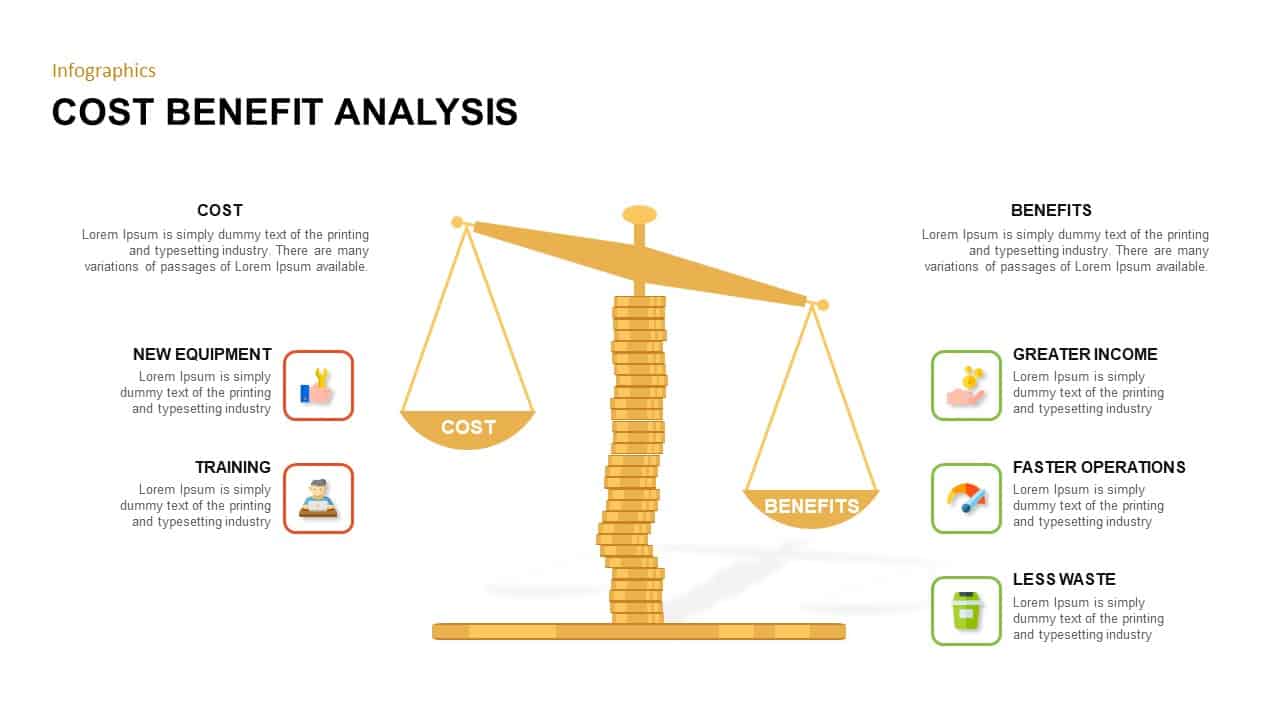
Cost Benefit Analysis PowerPoint Template
Business Models
Premium
-
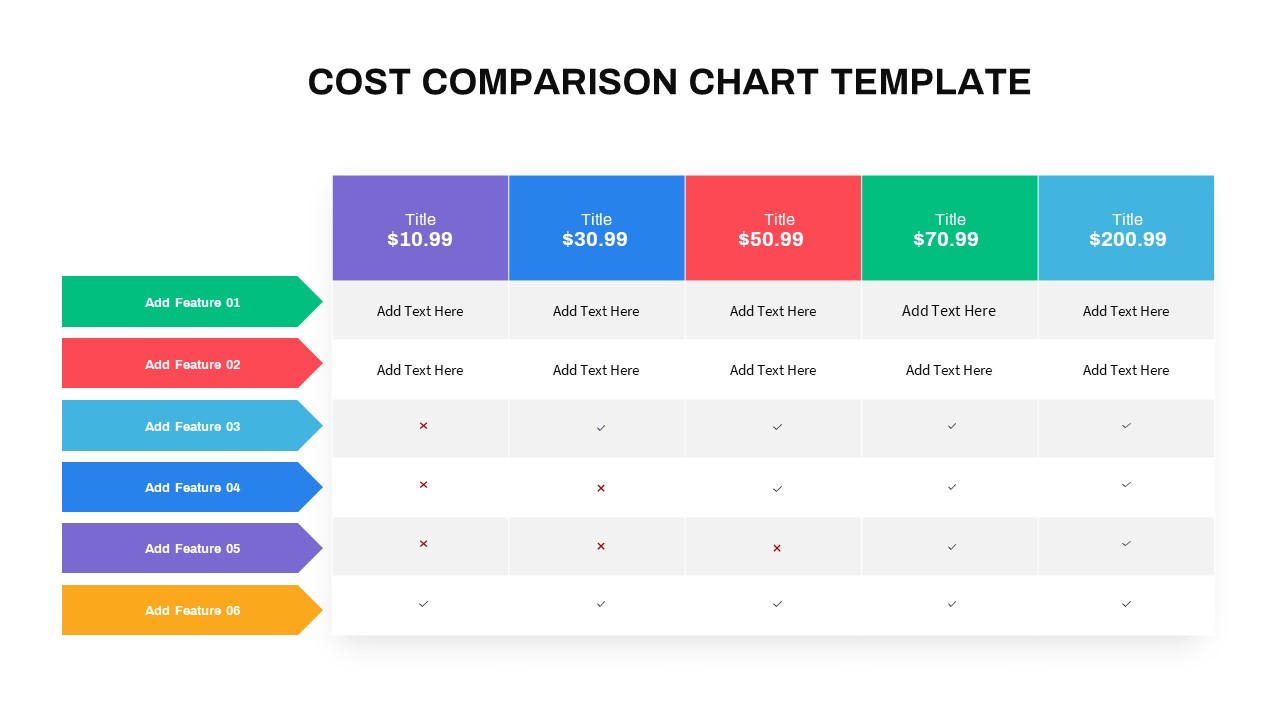
Cost Comparison PowerPoint Template
PowerPoint Templates
Premium
-
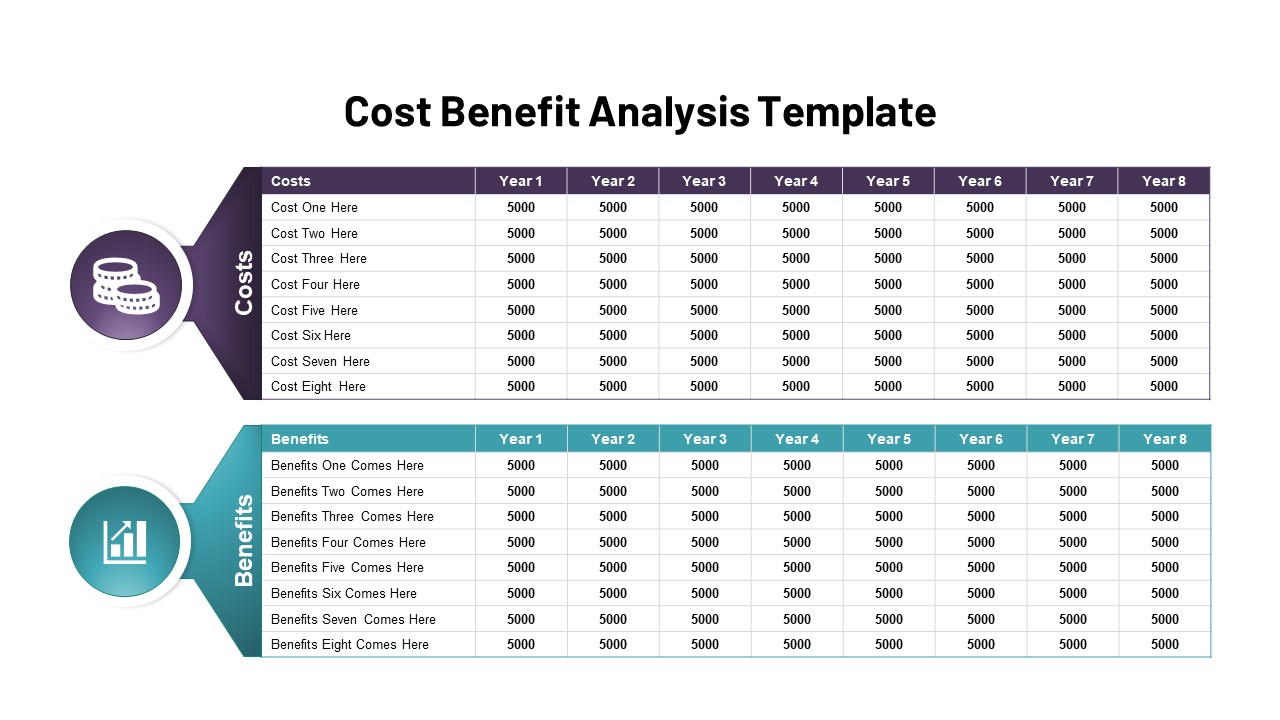
Cost Benefit Analysis Template for PowerPoint and Google Slides
Infographic
Premium
-
Sunk Costs Illustration Analogy Metaphor PowerPoint Template
PowerPoint Templates
Premium
-
Sunk Cost Fallacy PowerPoint Template
PowerPoint Templates
Premium
-
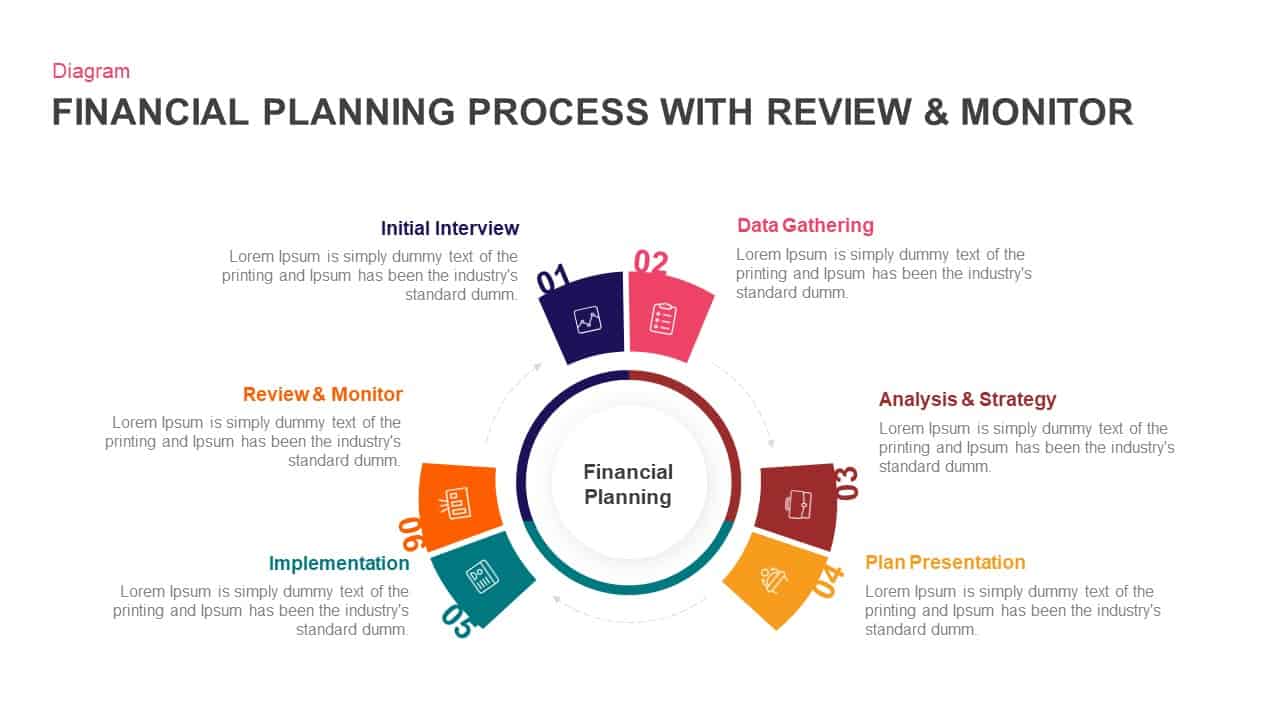
Financial Planning Process With Review and Monitor Template for PowerPoint & Keynote
Business Models
Premium
-
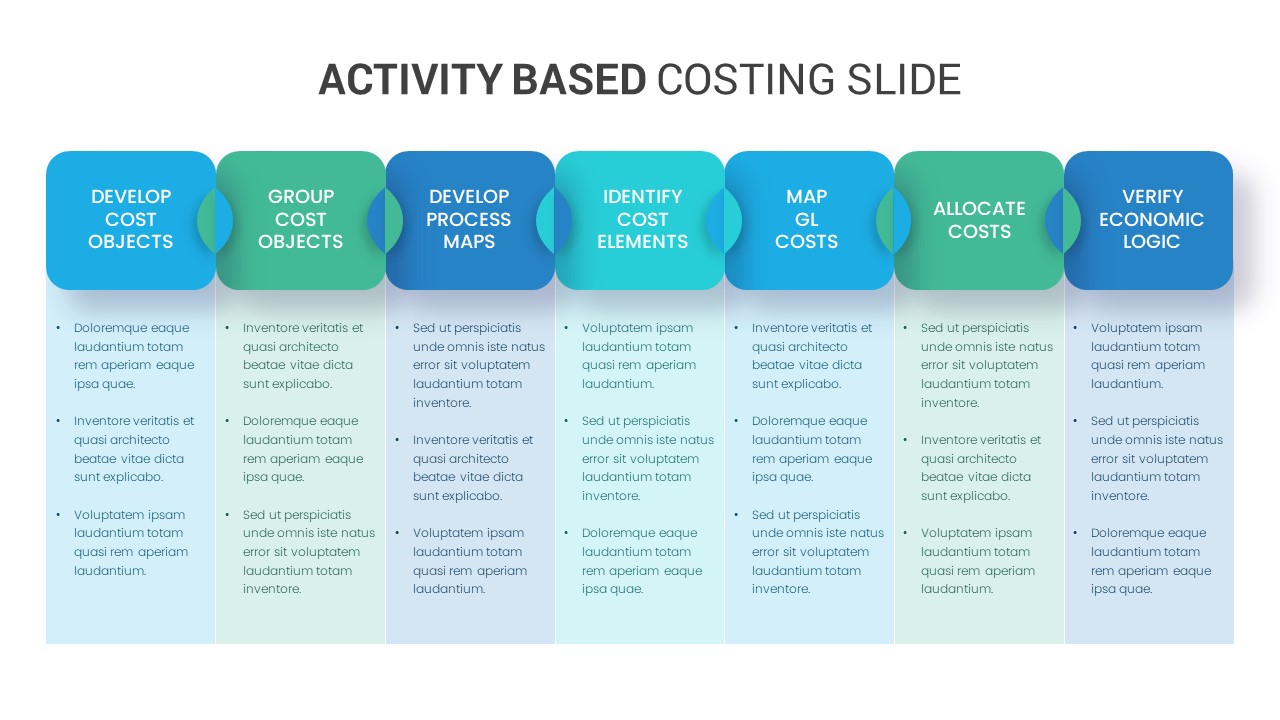
Activity Based Costing Template for PowerPoint and Keynote
PowerPoint Templates
Premium
-
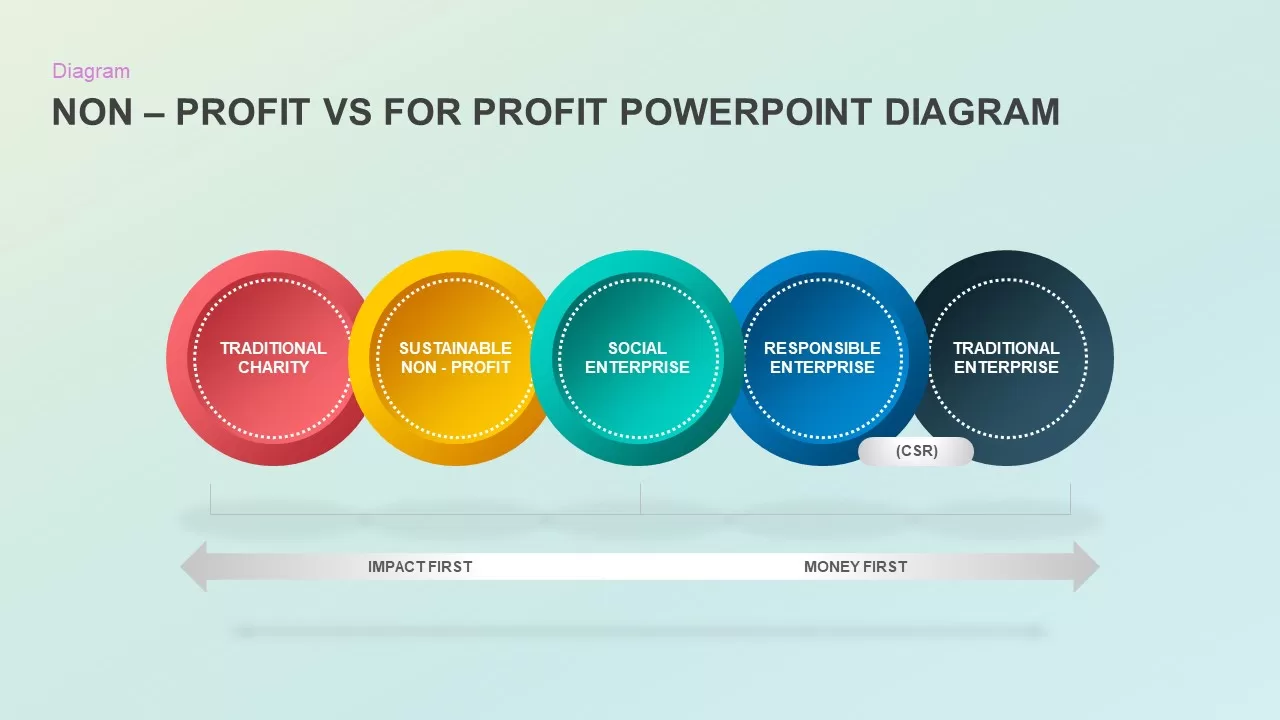
NonProfit Vs For Profit PowerPoint Diagram
PowerPoint Business Templates
Premium
-
Business Model Spectrum PowerPoint Diagram
Business Models
Premium
-
Profit Performance Chart PowerPoint Template
PowerPoint Charts
Premium
-
Cost Reduction Template
PowerPoint Templates
Premium
-
Customer Service PowerPoint Template
PowerPoint Templates
Premium
-
Incentive Plans Profit Sharing Stock Ownership Presentation Template
Business Models
Premium
-
Value Innovation Model PowerPoint Template
Business Models
Premium
-

Free Finance Deck PowerPoint Template
PowerPoint Templates
Free
-

Finance Advisor PowerPoint Template
PowerPoint Templates
Premium
-

Consulting Proposal PowerPoint Template
PowerPoint Templates
Premium
-
Gap Analysis PowerPoint Template
Business Models
Premium
-

Non Profit Organization PowerPoint Template
PowerPoint Templates
Premium
-
Strategy Tactics Pricing PowerPoint Template
Circular Diagrams
Premium
-

Annual Report Template for PowerPoint
Business Models
Premium
-
Key Financial Ratios PowerPoint Template
PowerPoint Templates
Premium
-
Financial Auditing Service Presentation Template
PowerPoint Templates
Premium
-

Financial Report Metaphor PowerPoint Presentation Template
Metaphor, Simile & Analogy
Premium
-
Company Performance Business Growth PowerPoint Template
Business Models
Premium
-
Gap Analysis Strategic Planning PowerPoint Template
Business Models
Premium
-
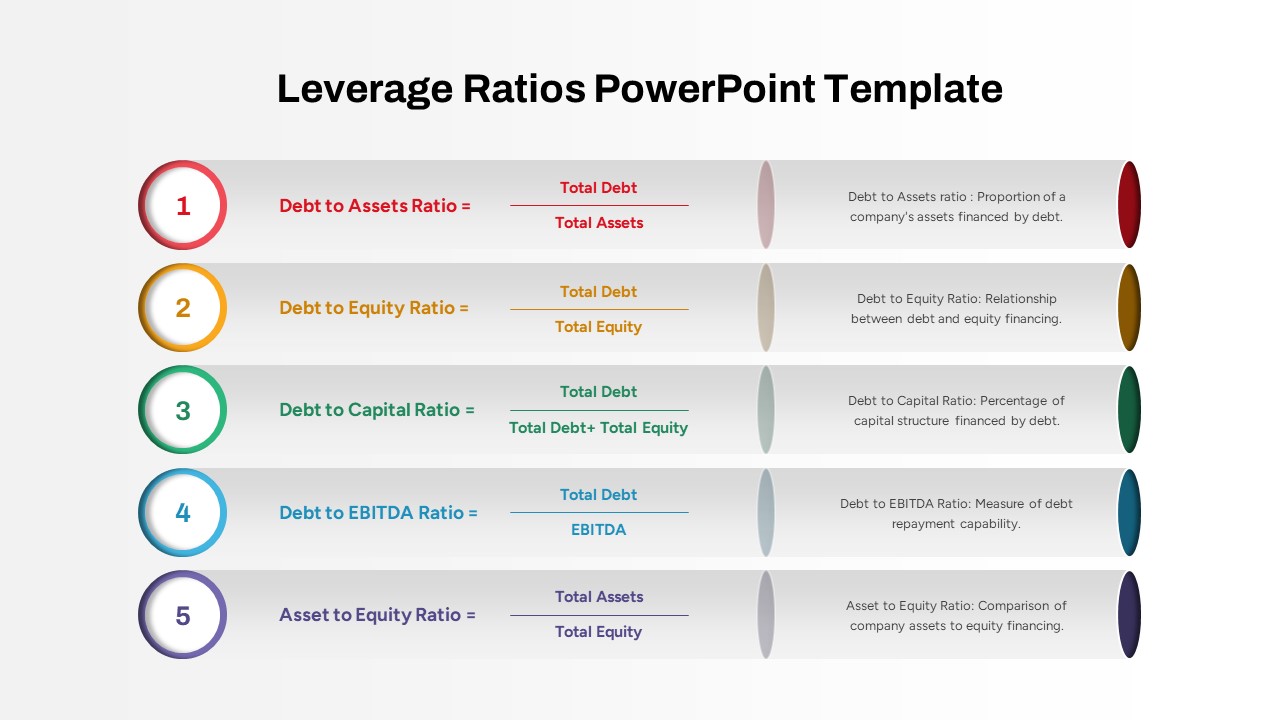
Leverage Ratios PowerPoint Template
PowerPoint Templates
Premium
-
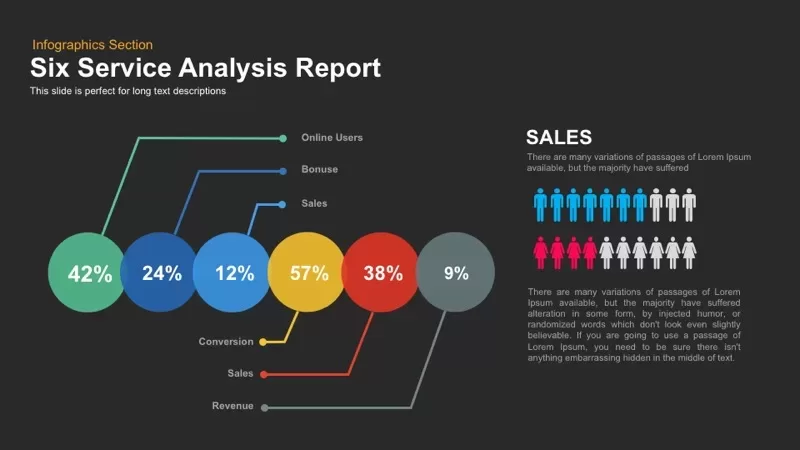
Six Service Analysis Report PowerPoint Template and Keynote
Process Flow Diagrams
Premium
-
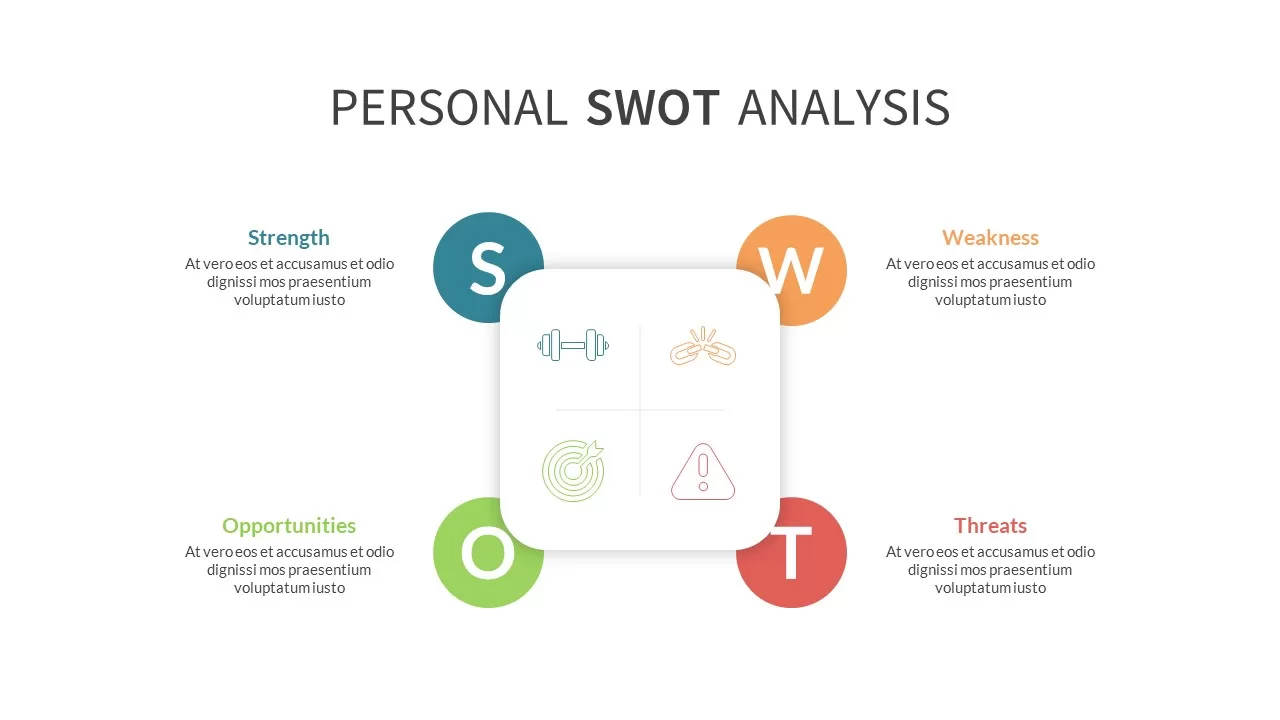
Personal SWOT Analysis PPT
professional
Premium
-
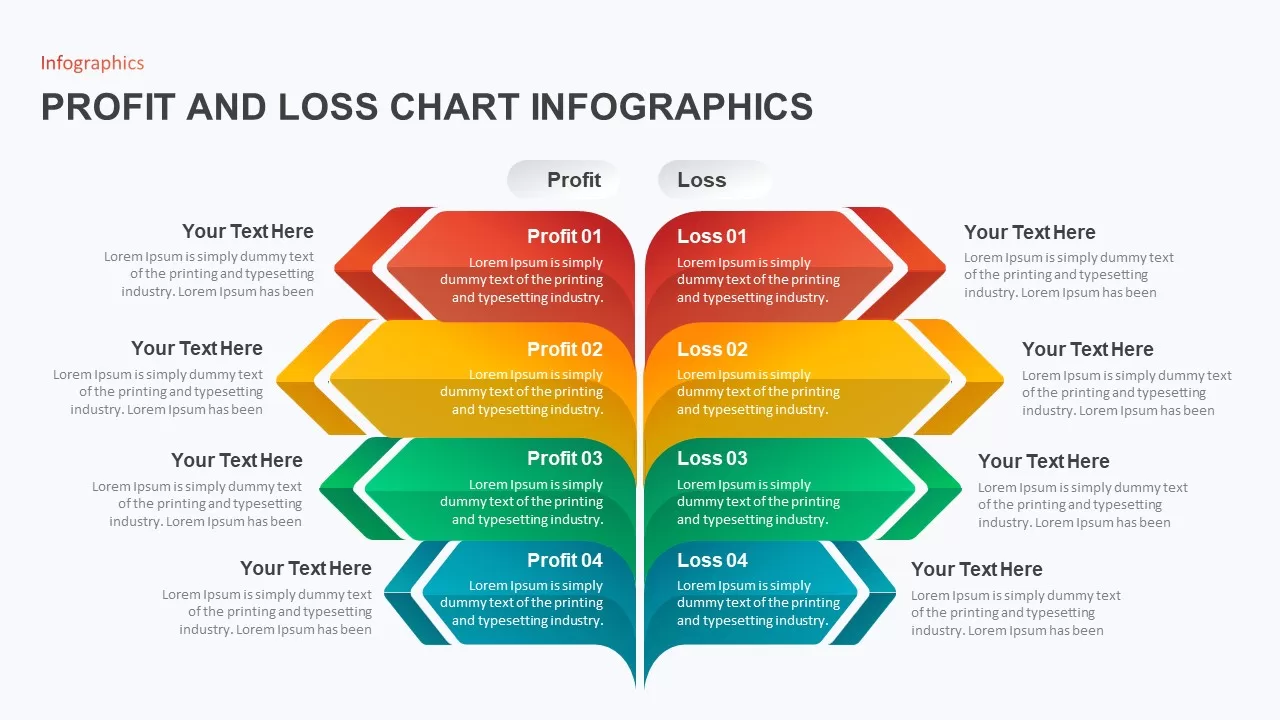
Profit and Loss Chart Infographic for PowerPoint Presentation
PowerPoint Templates
Premium
-
Financial Statement PowerPoint Template
PowerPoint Templates
Premium
-
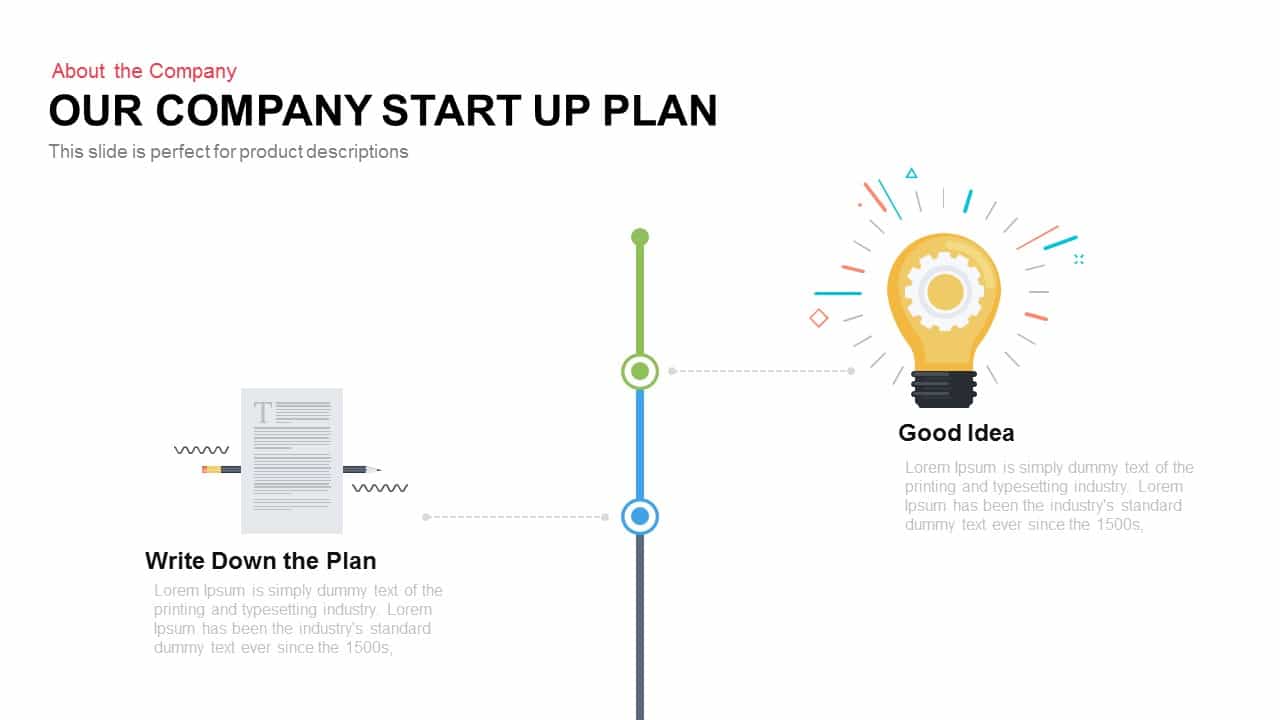
Company Startup Plan Timeline PowerPoint Template and Keynote
Business Models
Premium
-
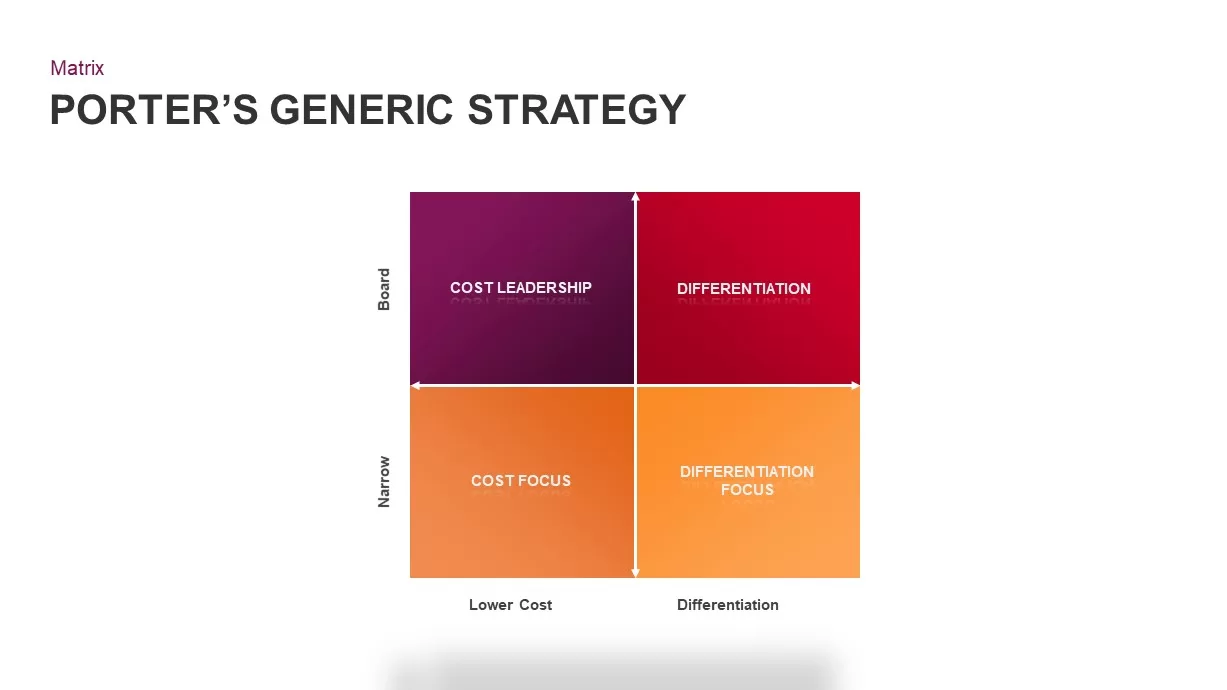
Porter’s Generic Strategy PowerPoint Template
Business Models
Premium
-
Financial Report PowerPoint Template & Keynote
PowerPoint Templates
Premium
-
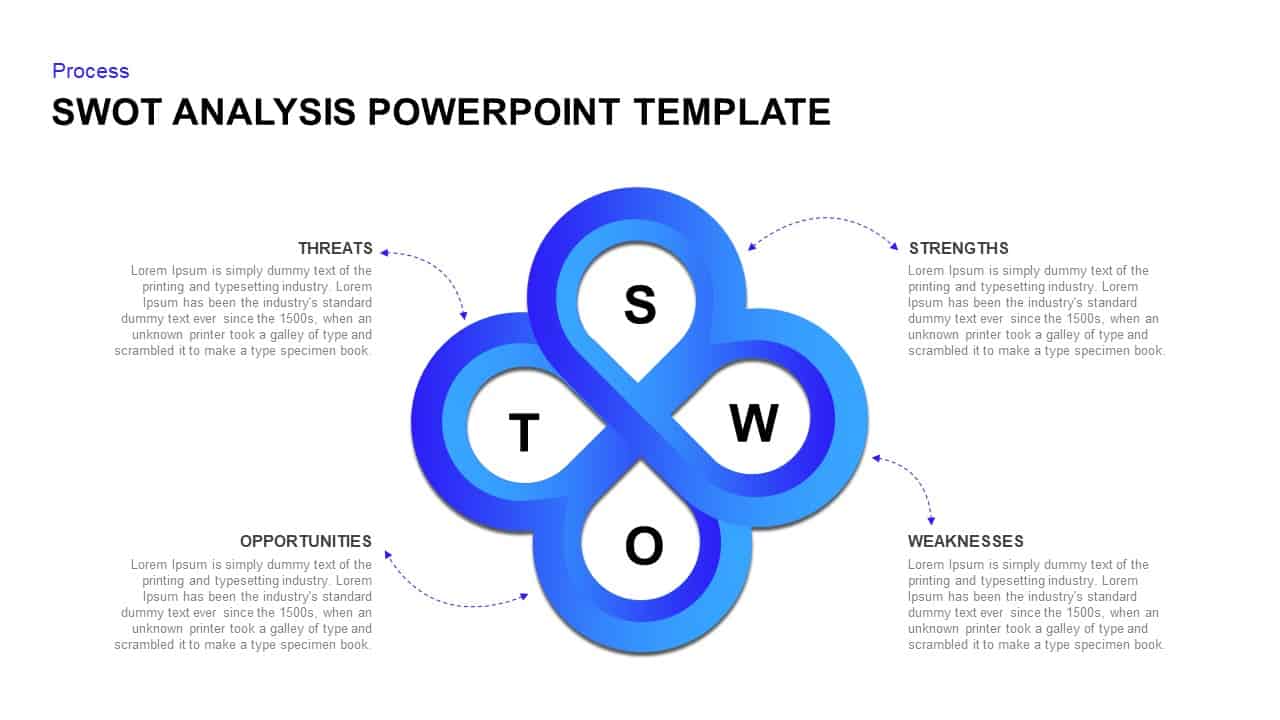
SWOT Template for PowerPoint & Keynote Presentation
Business Models
Premium
-
Free SWOT Analysis PowerPoint Template and Keynote Slide
Business Models
Free
-
Business Service Elements PowerPoint Template and Keynote
Business Models
Premium
-
Root Cause Analysis PowerPoint Template
Arrow Diagrams
Premium
-
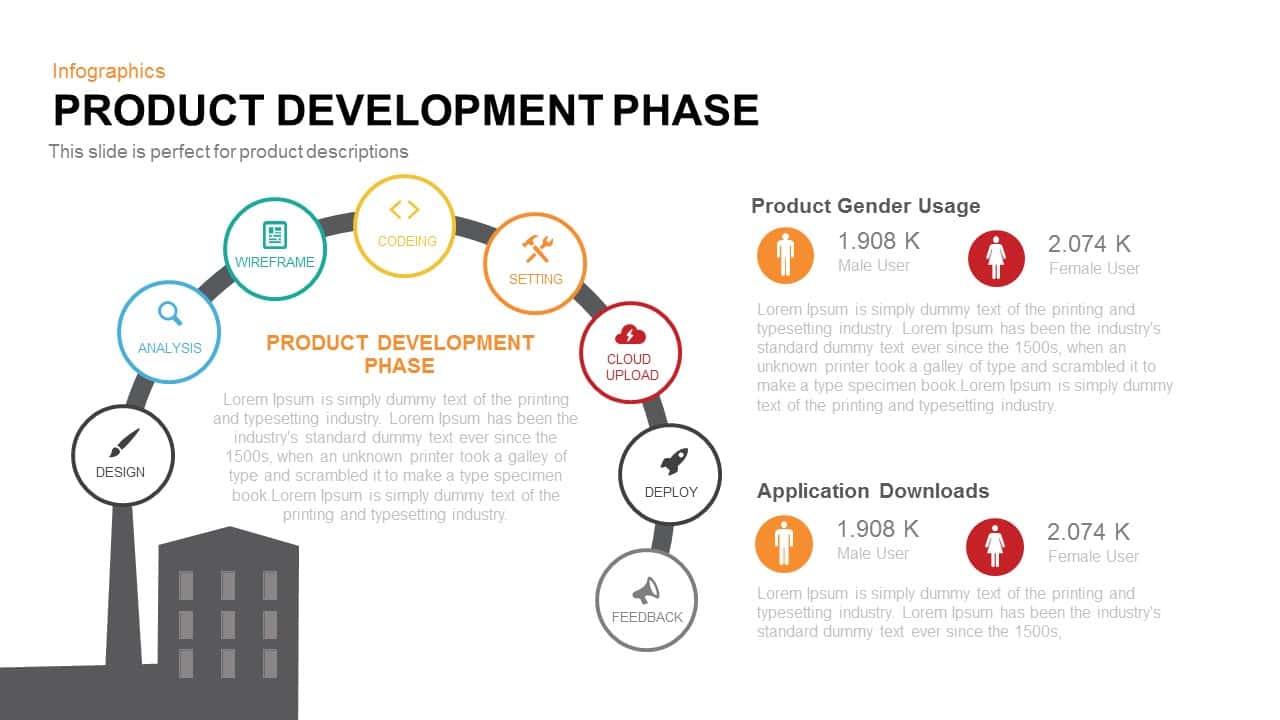
Product Development Phase PowerPoint Template and Keynote
Infographic
Premium
-
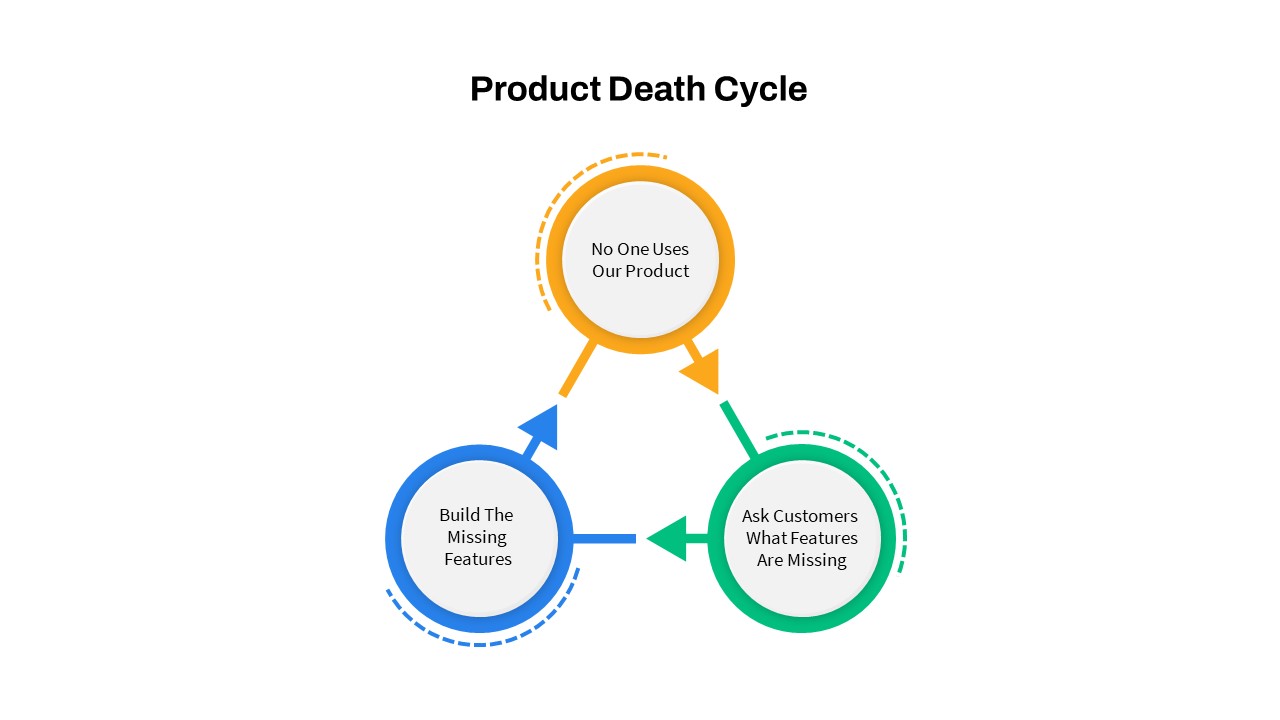
Product Death Cycle PowerPoint Template
PowerPoint Templates
Premium
-
Free Customer Service PowerPoint Template
PowerPoint Templates
Free
-
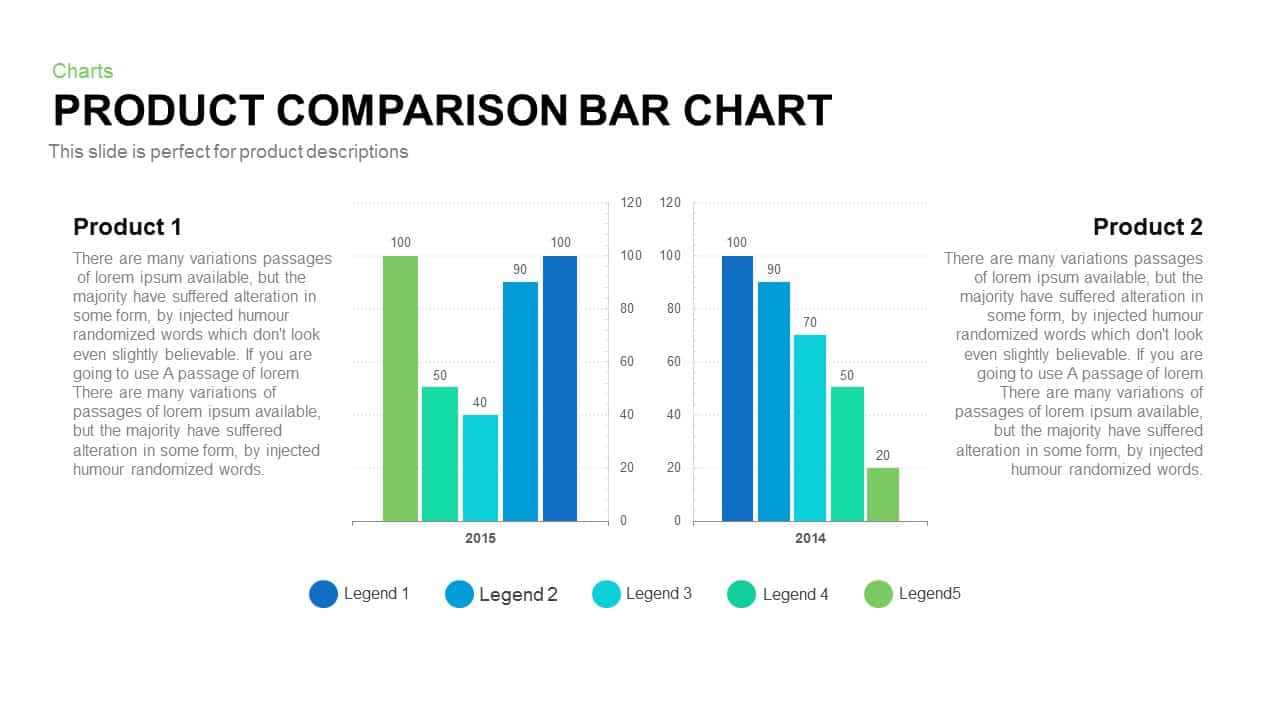
Product Comparison Bar Chart Template for PowerPoint and Keynote
PowerPoint Charts
Premium
-

PESTLE Analysis PowerPoint Template and Keynote
Business Models
Premium
-
Product Management PowerPoint Template
PowerPoint Templates
Premium
-
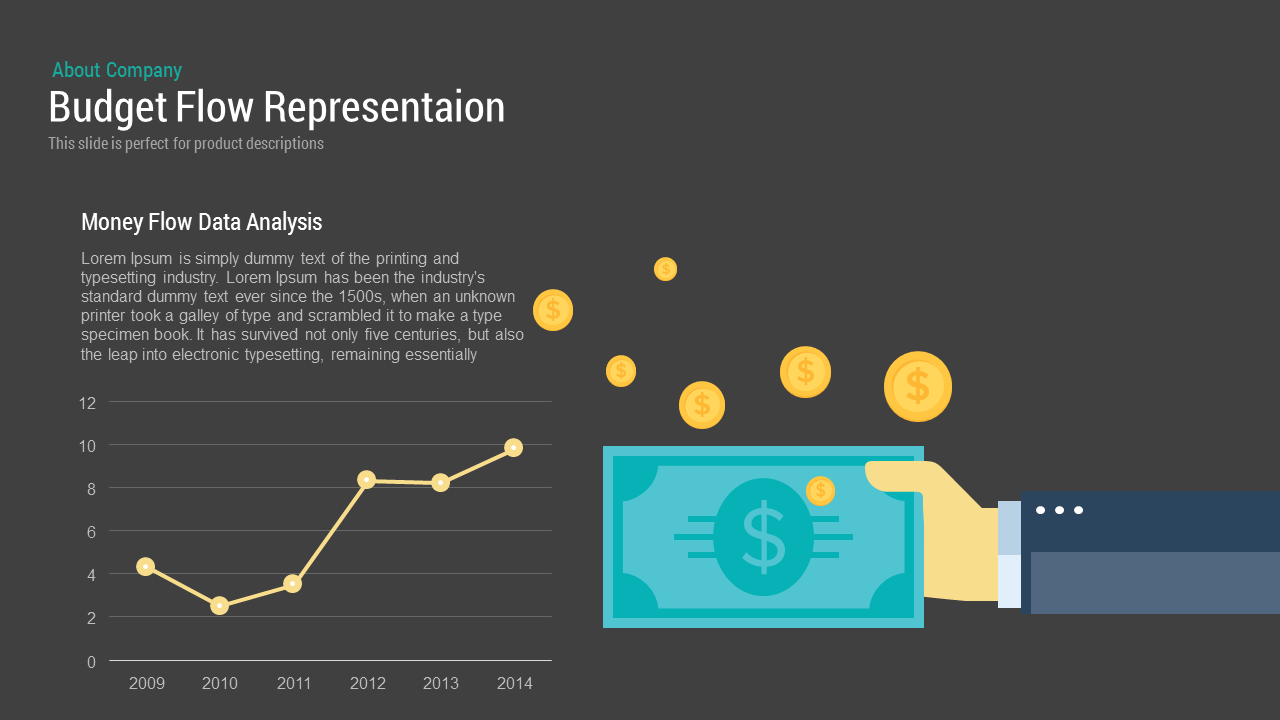
Budget Flow Representation PowerPoint Template and Keynote
Infographic
Premium
-
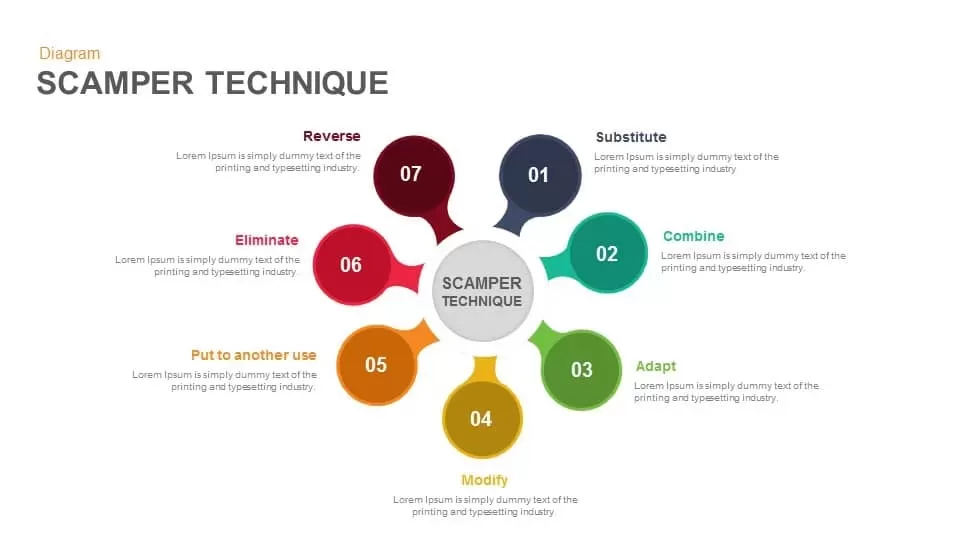
Scamper Technique PowerPoint Template & Keynote
Diagrams
Premium
-
Product Catalog Slide Presentation PowerPoint Template
PowerPoint Templates
Premium
-
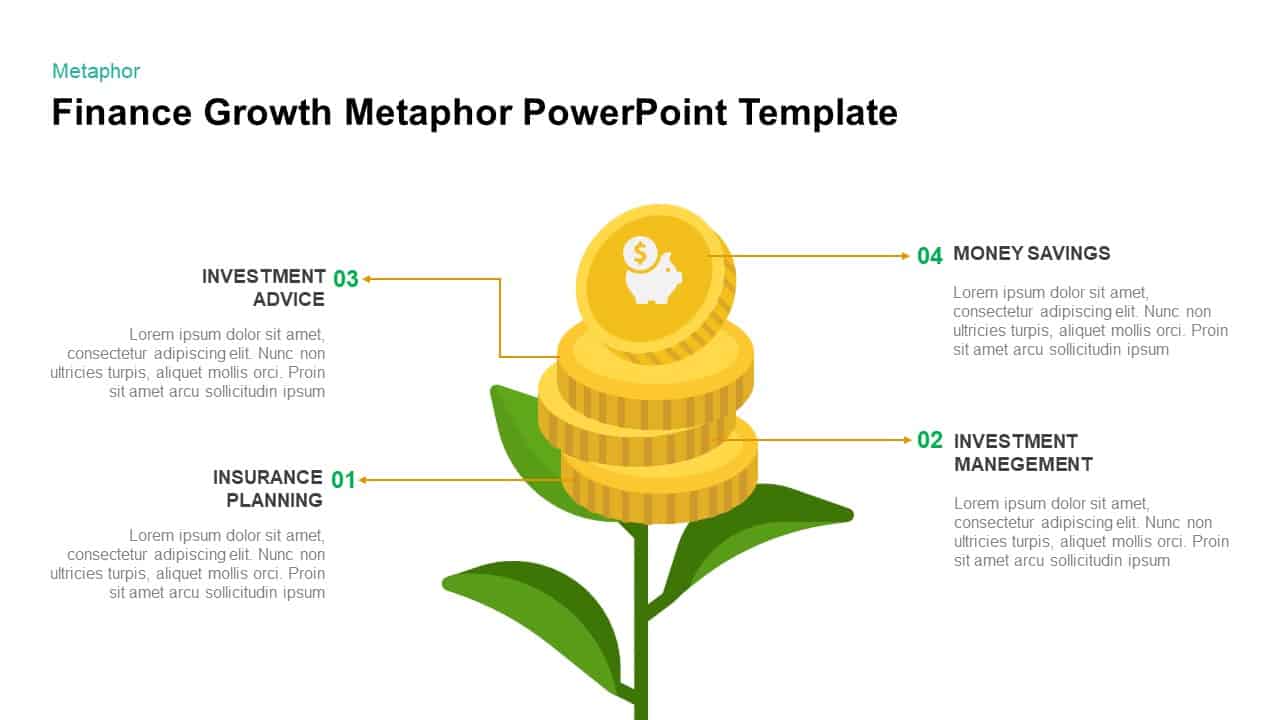
Financial Growth Template for PowerPoint & Keynote
Business Models
Premium
-
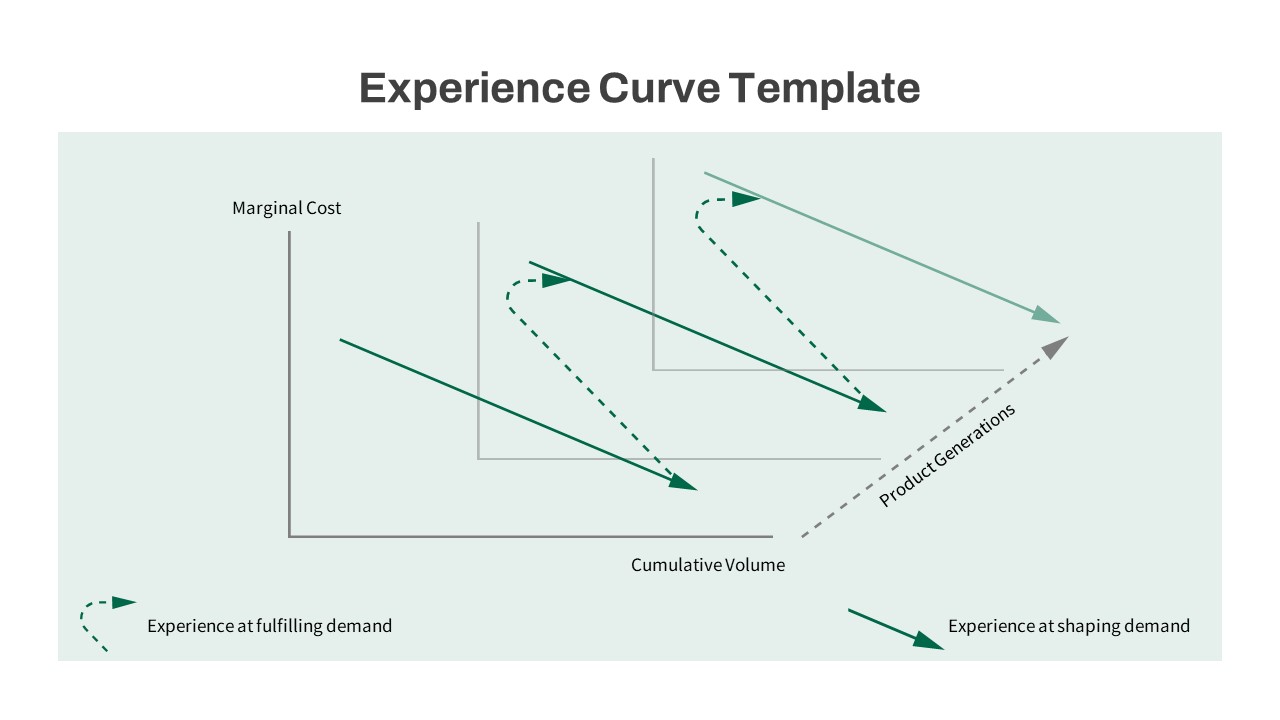
Experience Curve PowerPoint Template
Keynote Templates
Premium
-

Product Launch Checklist Template
Business Models
Premium
-
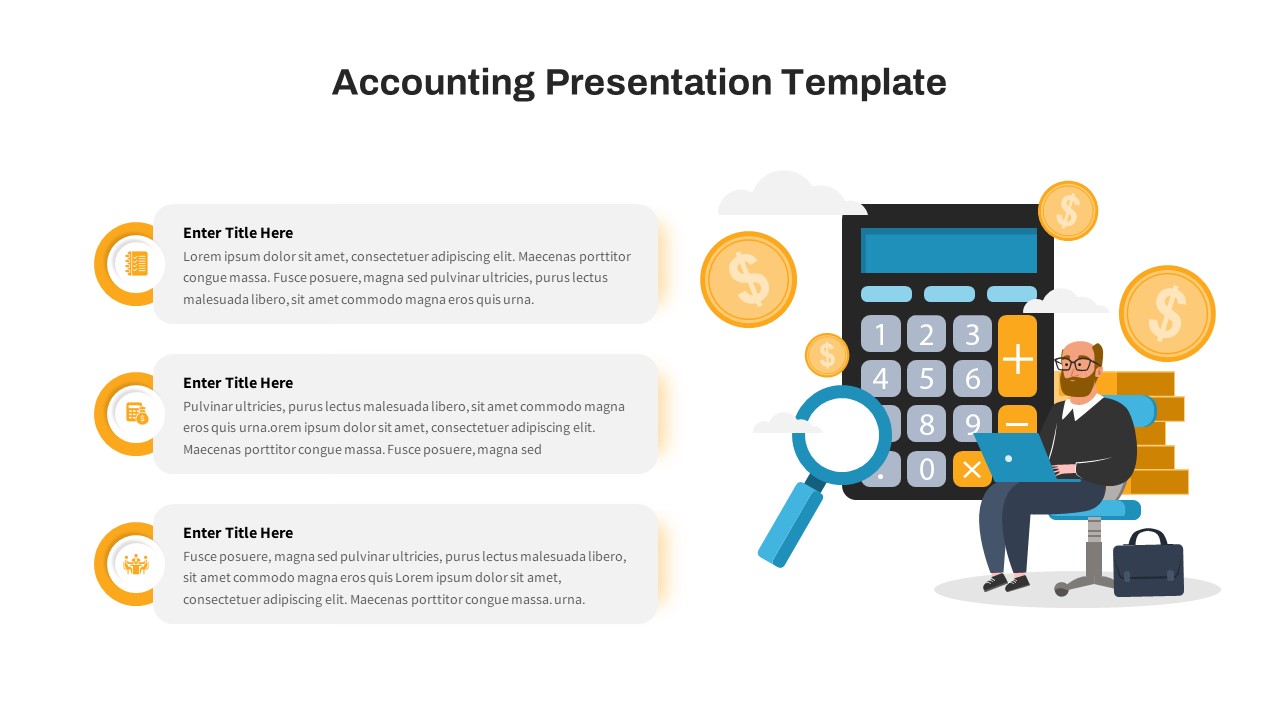
Free Accounting Presentation Template
PowerPoint Templates
Free
-
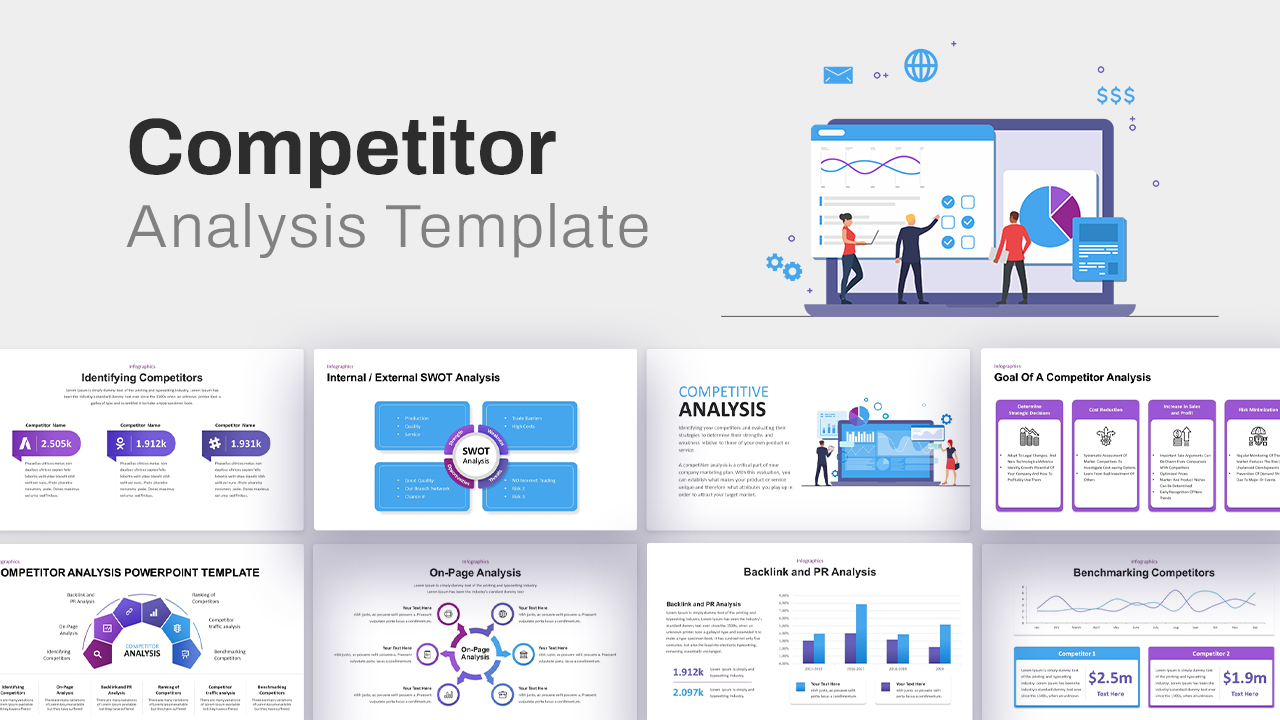
Competitor Analysis Template
PowerPoint Business Templates
Premium
-
SWOT Analysis PowerPoint Template with Gears and Keynote Slide
Gear
Premium
-

Free Community Service PowerPoint Template
Free PowerPoint Templates
Free
-
Line Chart Analysis PowerPoint Template and Keynote Slide
Curves and Lines
Premium
-
Business SWOT Analysis PowerPoint Template and Keynote Slide
Business Models
Premium
-
Product Matrix Template for PowerPoint and Keynote
Keynote Templates
Premium
-

Financial Agreement Signing PowerPoint Template
Business Models
Premium
-
4C marketing model PowerPoint template
PowerPoint Templates
Premium
-
Gap Analysis Strategic Planning Template
PowerPoint Templates
Premium
-
Global Market Drivers Analysis PowerPoint & Keynote
Circular Diagrams
Premium
-
Five Porters Forces Analysis PowerPoint Template
Business Models
Premium
-
Product Usage Analytics Template for PowerPoint and Keynote
Infographic
Premium
-
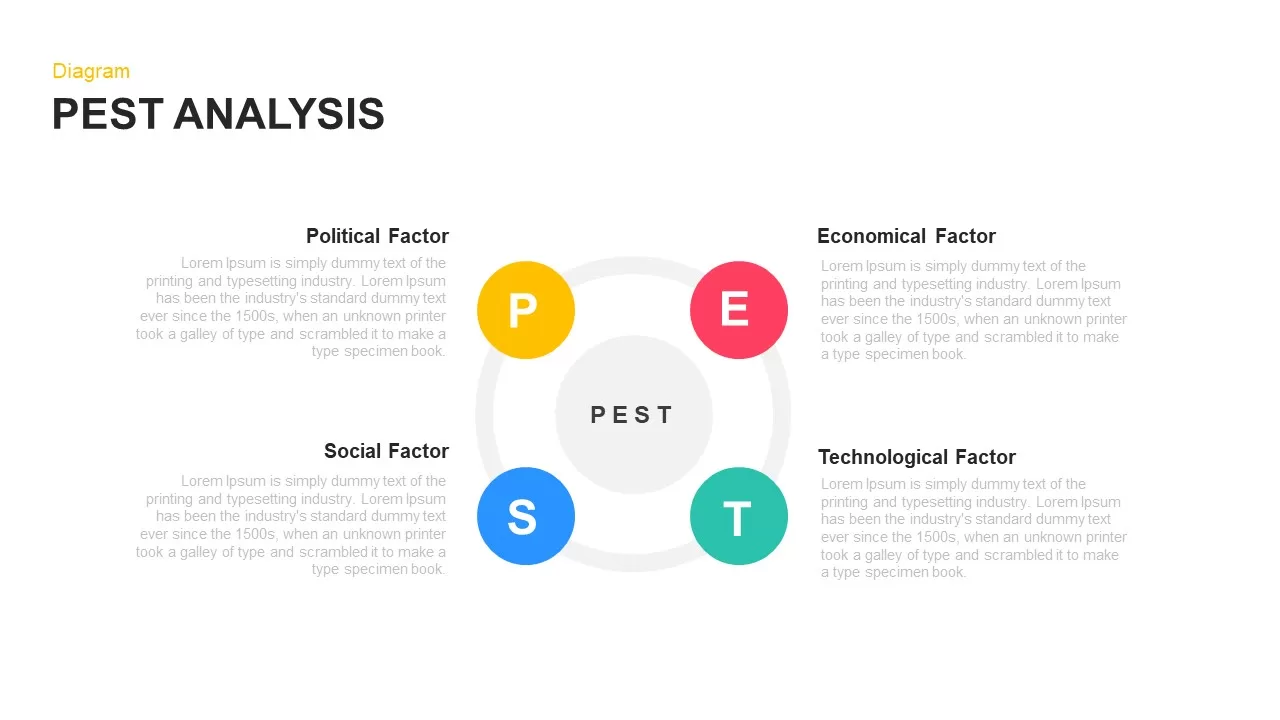
Pest Analysis PowerPoint Template
Diagrams
Premium
-

Financial Institution PowerPoint Template
PowerPoint Business Templates
Premium
-
Porters Five Forces PowerPoint Template
Business Models
Premium
-
PESTLE Analysis Diagram Template
Business Models
Premium
-
Product Comparison A vs B PowerPoint Template
Business Models
Premium
-
Product Sales PowerPoint Pitch Deck
PowerPoint Templates
Premium
-
PEST Analysis PowerPoint Template and Keynote Slide
Business Models
Premium
-
Perceptual Map Template
Infographic
Premium
-
SWOT Analysis Template for PowerPoint & Keynote
Business Models
Premium
-
Product Life Cycle PowerPoint Template and Keynote Diagram
Business Models
Premium
-

Free Break Slide PowerPoint Template
Free PowerPoint Templates
Free
-
MABA Analysis PowerPoint Template
PowerPoint Templates
Premium
-
Pricing Plans Powerpoint and Keynote Template
Keynote Templates
Premium
-
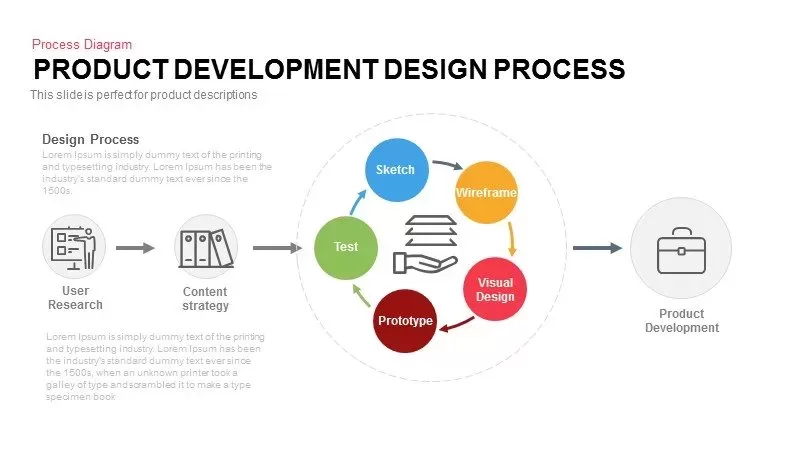
Product Development Design Process Template for PowerPoint and Keynote
Business Models
Premium
-
Product Launch Presentation Template for PowerPoint and Keynote
Infographic
Premium
-

Finance Consulting PowerPoint Template
PowerPoint Templates
Premium
-
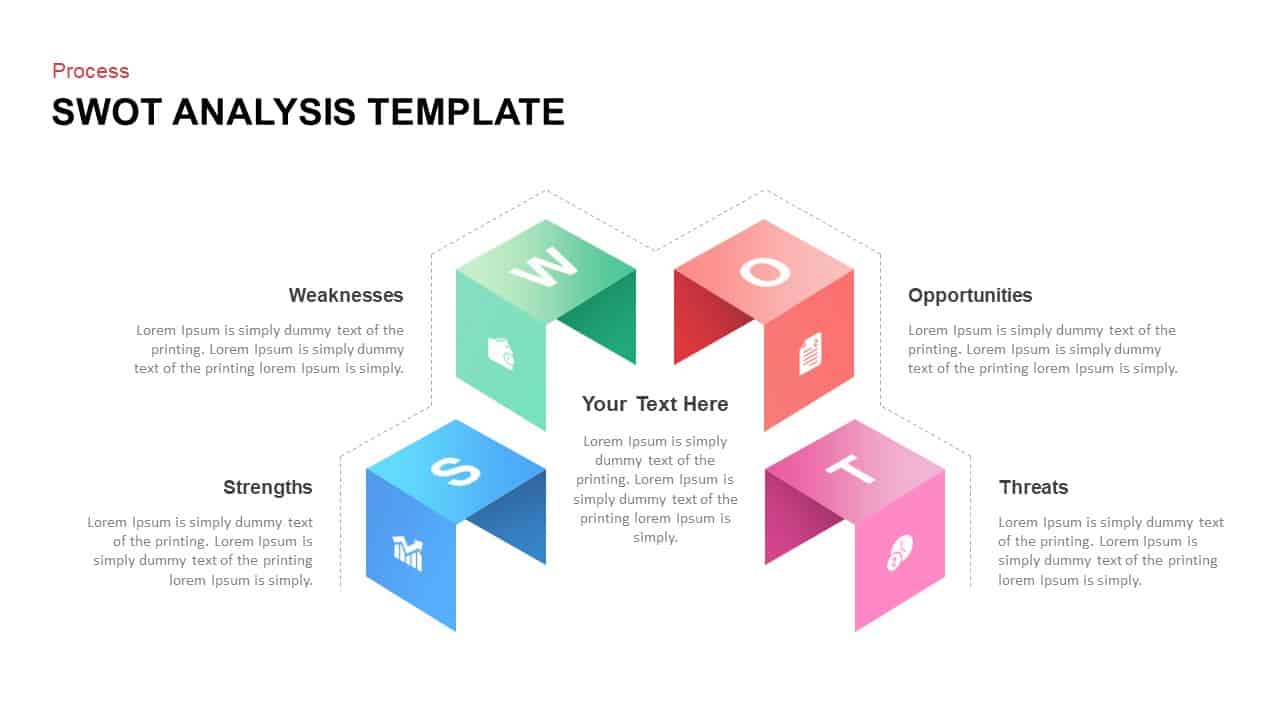
SWOT Analysis PowerPoint Template
Business Models
Premium
-
PEST Analysis PowerPoint Template and Keynote
Diagrams
Premium
-
Product Launch Template for PowerPoint & Keynote
Business Models
Premium
-
Circle SWOT Analysis PowerPoint Template and Keynote Slide
Business Models
Premium
-
Requirements Analysis Ppt Template
Business Models
Premium
-
Types of Budget Template
Infographic
Premium
-
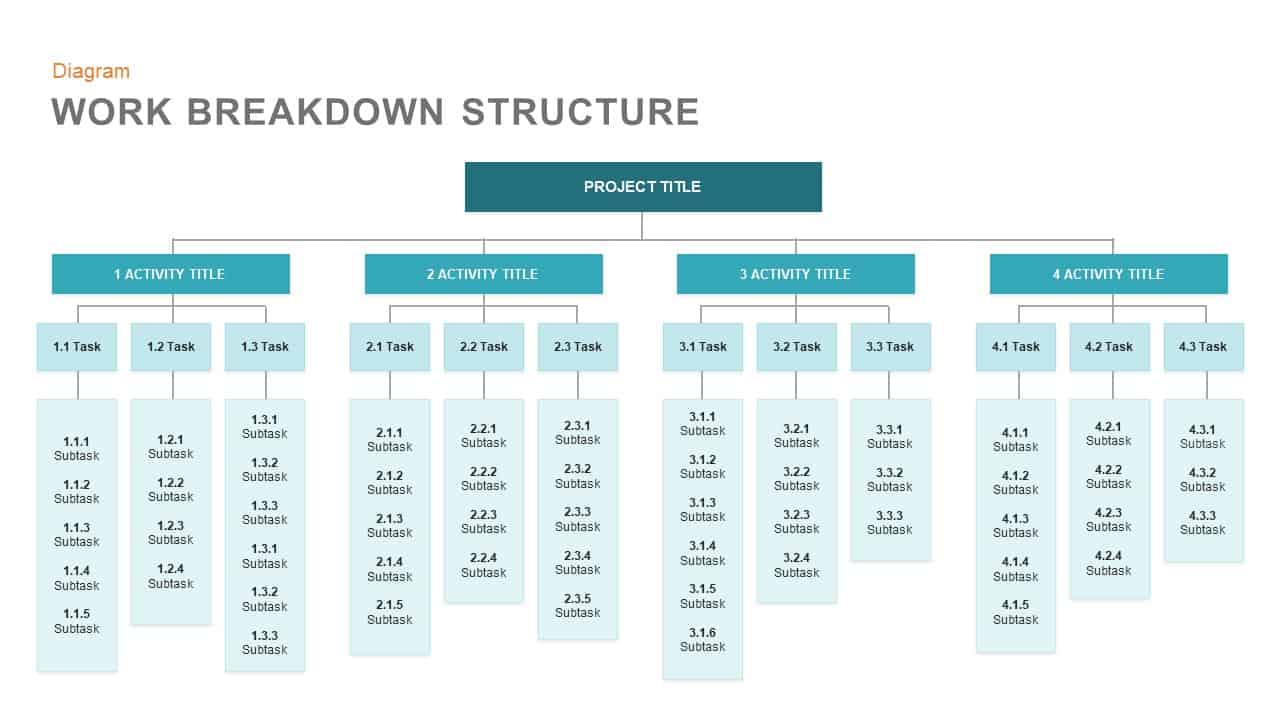
Work Breakdown Structure Template for PowerPoint and Keynote Presentation
PowerPoint Business Templates
Premium
-
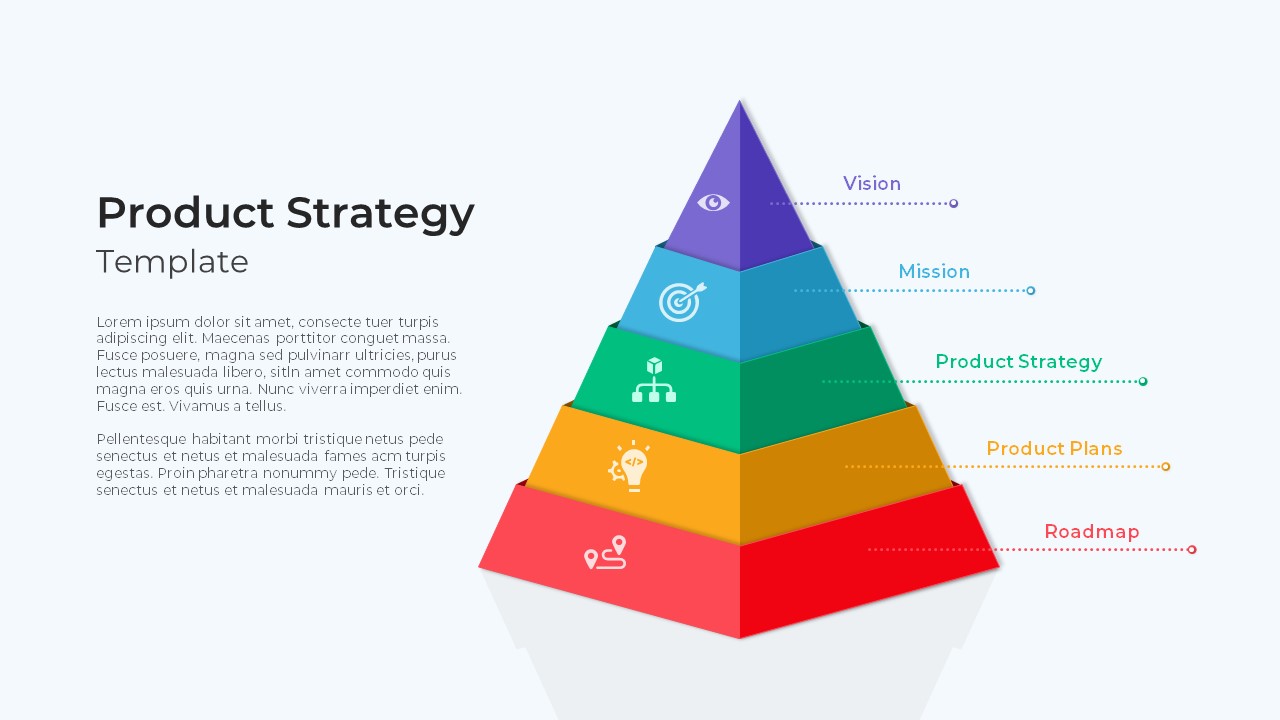
Product Strategy PowerPoint Template
Pyramid
Premium
-

Recruiting Process Template for PowerPoint Presentation
PowerPoint Templates
Premium
-
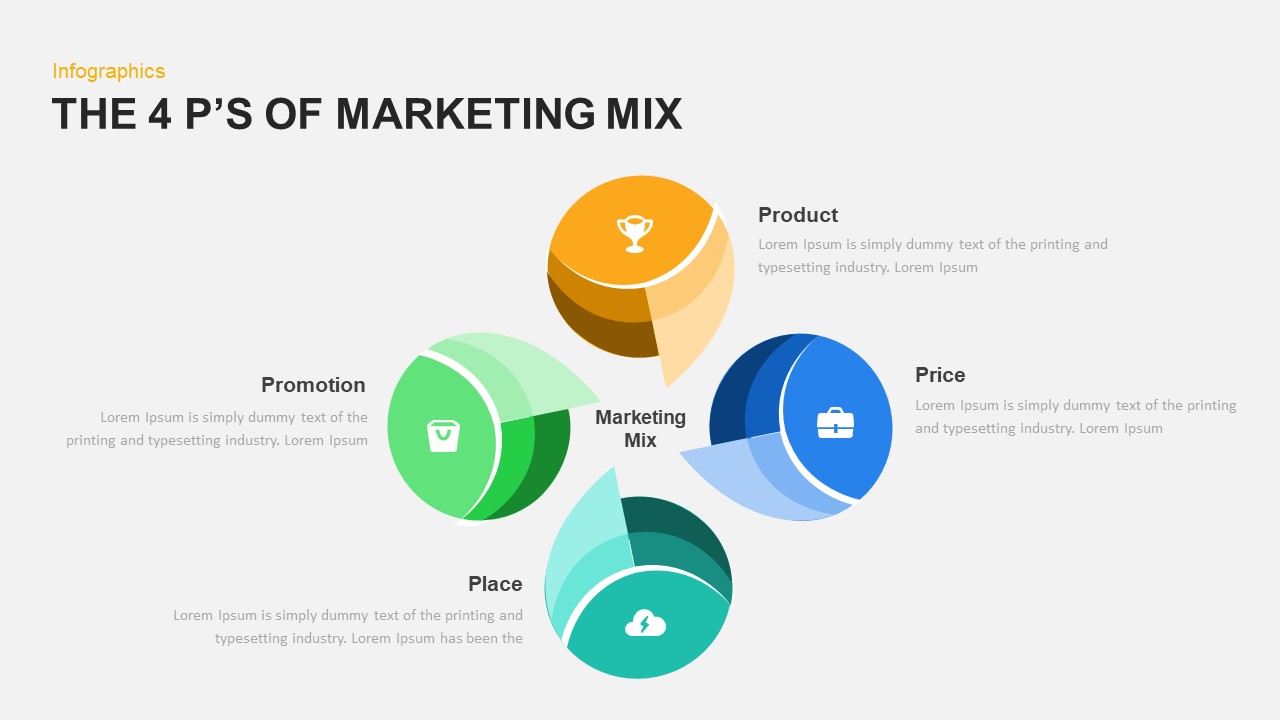
4 Ps of Marketing Mix PowerPoint Template and Keynote
Diagrams
Premium
-
SWOT Analysis Template for Presentation
Business Models
Premium
-
SWOT Analysis PowerPoint Slide
Business Models
Premium
-

Radial Bar Chart PowerPoint Templates and Keynote Slides
PowerPoint Charts
Premium
-
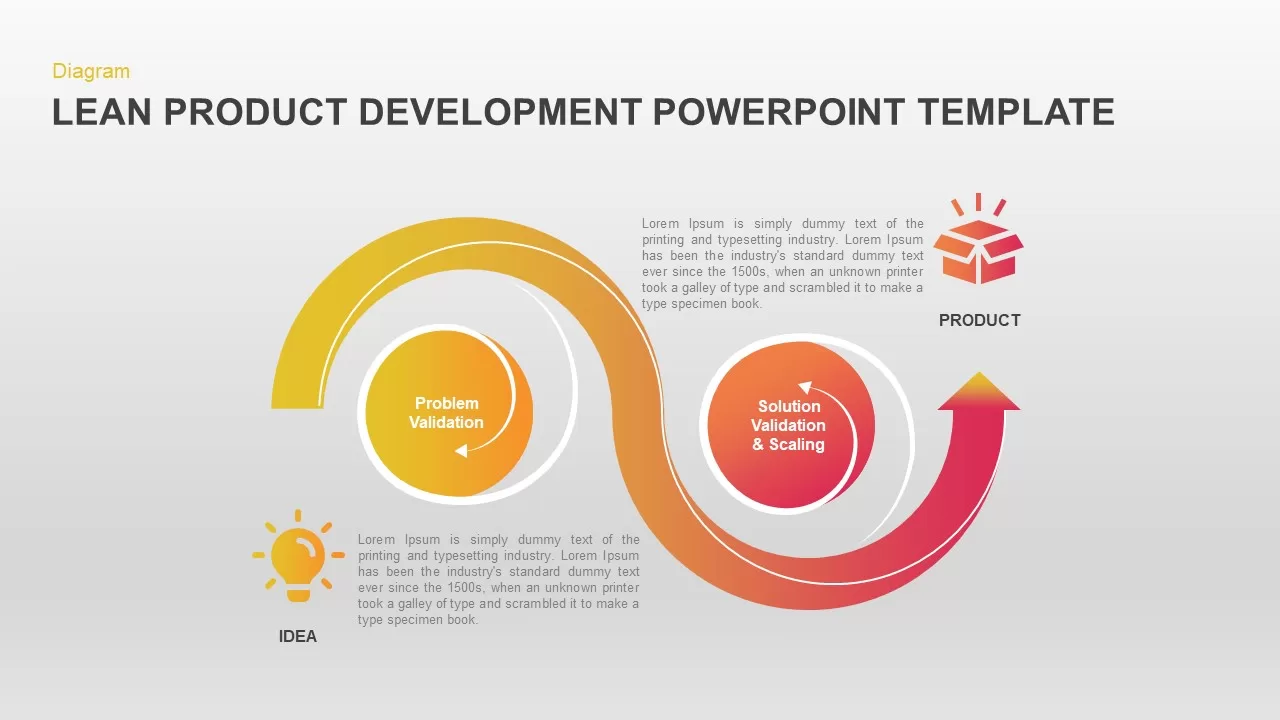
Lean Product Development Diagram for PowerPoint
Business Models
Premium
-
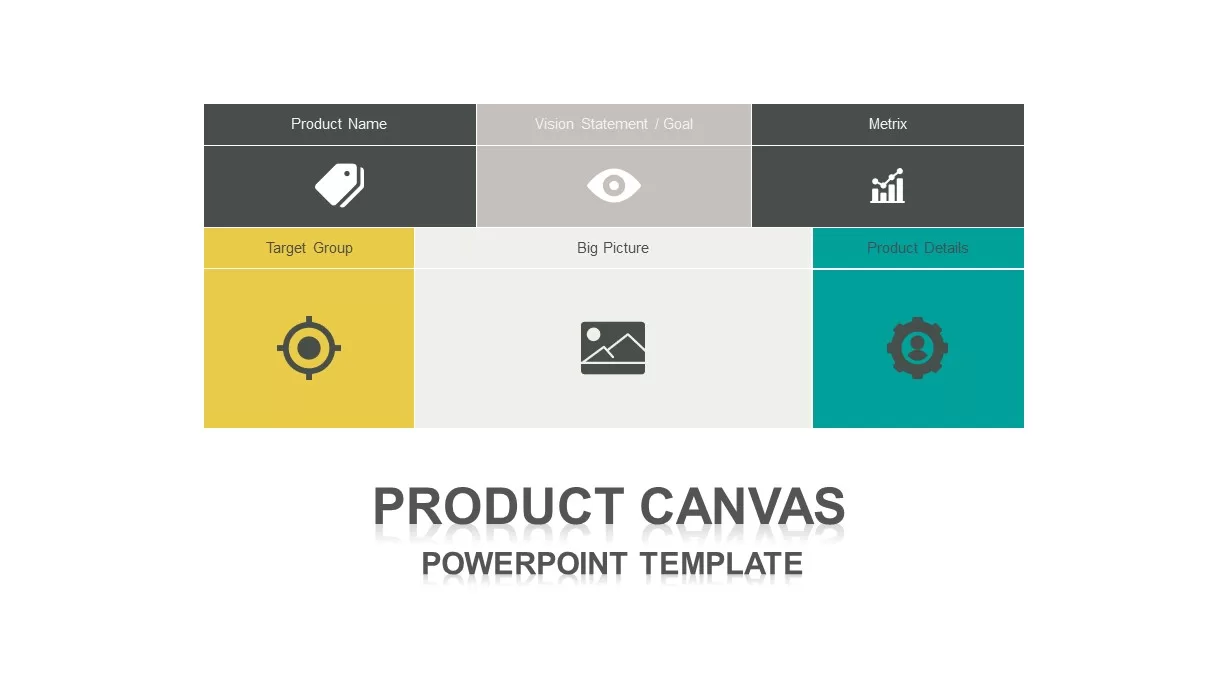
Product Canvas PowerPoint Template
Business Models
Premium
-
Service zoom slides for PowerPoint and Keynote Business Presentation
Keynote Templates
Premium