


BMI Chart PowerPoint Template 13
This template is part of a deck featuring multiple slides. To check out all slides, click on See All.
See All

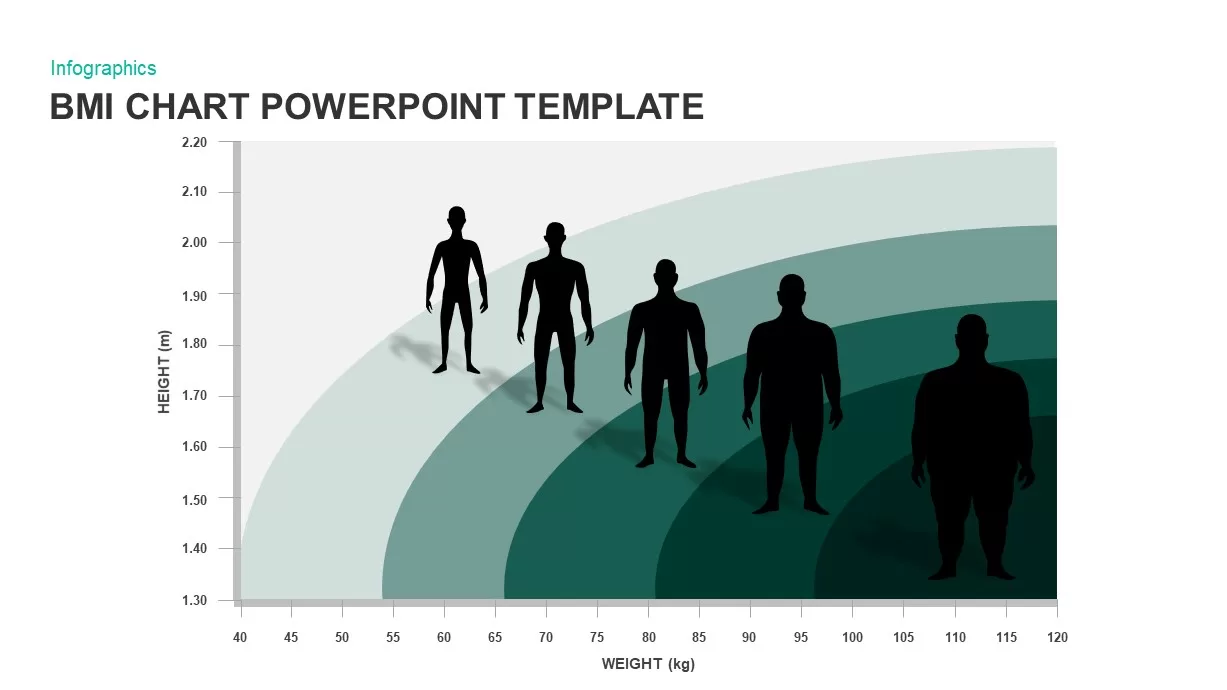
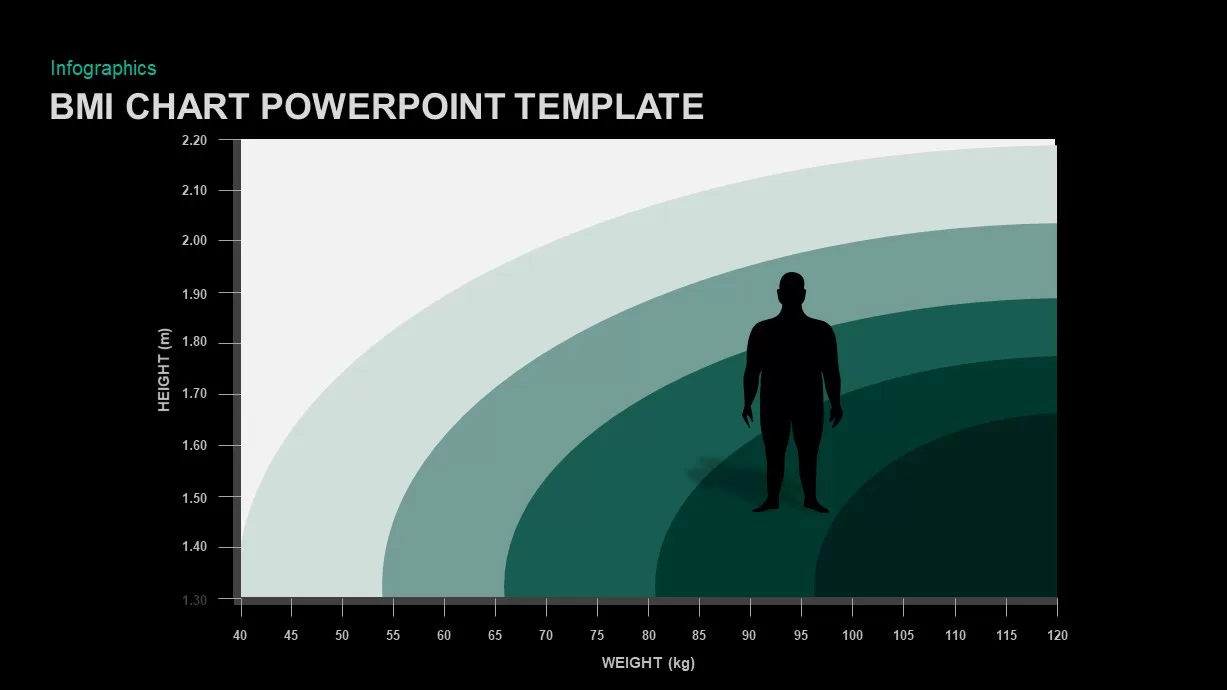
BMI Chart Template for PowerPoint
BMI chart PowerPoint template is a medical PowerPoint design which is created for the nutritionists who is advising what type diets should be followed by a person. The acronym BMI stands for Body Mass Index, it is the value derived from the mass (weight) and height of a person. The BMI may be determined using chart or table which shows BMI as a function of mass and height using contour lines or colors for different BMI groups, and which may use other units of measurement. The BMI chart PowerPoint presentation will give a complete history of human physique and it recommends what should be the diet of a person. BMI facts:- BMI stands for body mass index. BMI is measured by a formula that takes into account both a person's height and weight.
- BMI is stated as weight in kilograms (kg) divided by height in meters squared (m2).
- BMI is useful in grouping of obesity, overweight, and healthy weight.
- Obesity is commonlydemarcated as a BMI of 30 or greater, while healthy weight for grown-ups refers to a BMI of at least 19 and less than 25.
- A BMI of 40 or more is habitually used to identify people who are exceptionally fat and at risk for serious health complications of obesity.