


Creative Bar Chart Data Analysis PowerPoint Template and Keynote

- Version
- Download 410
- File Size 0.00 KB
- File Count 1
- Create Date September 19, 2015
- Last Updated November 15, 2023
Creative Bar Chart Data Analysis PowerPoint Template and Keynote
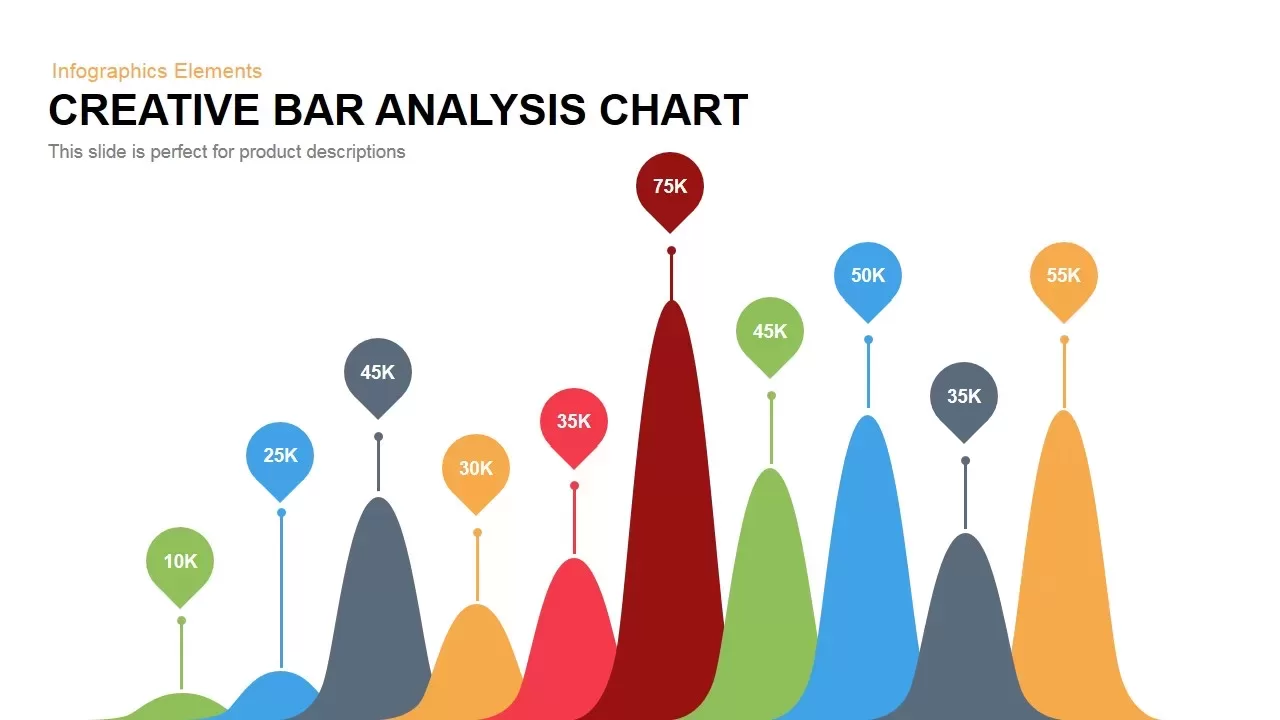
Bar Chart Data Analysis PowerPoint Template
Creative bar chart data analysis PowerPoint template and keynote is a unique bar chat to illustrate your research data. Create an entertaining presentation with the creative data analysis PowerPoint. This is an awesome alternative to the traditional bar pie line and other type graphical charts. Its illustration similar to sound waves gives a catchy and interesting feeling to your presentation while maintaining simplicity. Bar charts are a type of graph that are used to display and compare the number, frequency or other measure for different discrete categories of data. You can present demographic and sales data by using the bar graph template. It is useful to present qualitative data in the form of quantitative illustration using charts and data powerpoint templates.
Bar charts are one of the most commonly used types of graph because they are unpretentious to create and very easy to understand. They are also flexible chart type and there are several variations of a standard bar chart including horizontal bar charts, clustered bar charts and stacked bar charts. This creative bar chart is simple bar chart it provides uncomplicated data to the viewers. The waves design method helps the audience to maintain their focus between the figure and the host. The creative chart is useful for researcher and business professionals to show their data in hand.
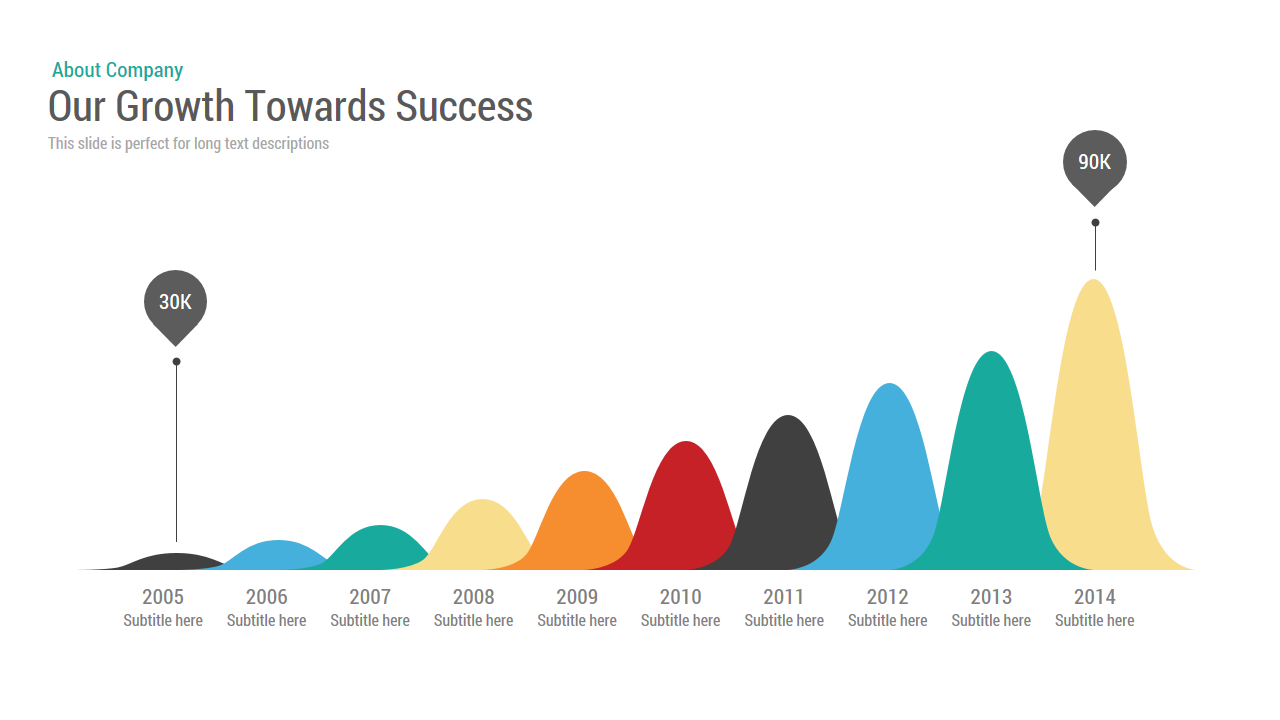
The hill-type bar chart for data analysis is a unique design but operate as a generic bar graph. The presenters can use it for the presentation of statistics. The users from academic fields and business management areas can use this bar diagram with an impressive note. Bar chart analysis PowerPoint template is an alternative version in which you can show how a bar chart can be visualized, you have to manually increase the height of the hills in this template.
The template is designed in both PowerPoint and keynote version in 16:9(widescreen) and 4:3(Normal) Version. You can access more Bar chart PowerPoint Templates
Attached Files
| File |
|---|
| SB00025-Creative-Data-Analysis-Bar-chart.zip |
Login to download this file
Add to favorites
Add to collection
-

Item ID
SB00025 -

Related Templates
-
Creative Bar Chart Analysis PowerPoint Template and Keynote
Column and Bar chart
Premium
-

Sales Deck Free PowerPoint Template
PowerPoint Templates
Free
-

Nature PowerPoint Presentation Template
PowerPoint Business Templates
Premium
-

Free Vertical PowerPoint Template
PowerPoint Business Templates
Free
-

Cab Service PowerPoint Template
PowerPoint Templates
Premium
-

Free Nursing Capstone PowerPoint Deck
PowerPoint Templates
Free
-

Research Proposal PowerPoint Template
PowerPoint Templates
Premium
-

Gym PowerPoint Template
PowerPoint Templates
Premium
-

VET Clinic PowerPoint Template
PowerPoint Templates
Premium
-

Free Space Minimal Deck Template
PowerPoint Templates
Free
-

Free Physical Education PowerPoint Template Deck
Free PowerPoint Templates
Free
-

Travel Agency PowerPoint Template
PowerPoint Templates
Premium
-

IoT Presentation Template
PowerPoint Templates
Premium
-

Effective Communication PowerPoint Template
PowerPoint Templates
Premium
-

Graph Paper PowerPoint Template Deck
PowerPoint Templates
Premium
-

PowerPoint Quiz With Timer
PowerPoint Templates
Premium
-

Macroeconomics PowerPoint Template
PowerPoint Templates
Premium
-

Free Economics PowerPoint Template
Free PowerPoint Templates
Free
-

Free Cartoon PowerPoint Template
Free PowerPoint Templates
Free
-

Free Aviation PowerPoint Template
Free PowerPoint Templates
Free
-

Free Army PowerPoint Template
PowerPoint Templates
Free
-

Free Charity PowerPoint Template Deck
PowerPoint Templates
Free
-

Pencil Bar Chart PowerPoint Template and Keynote Slide
Column and Bar chart
Premium
-

Customer Experience Loyalty PowerPoint Deck Template
PowerPoint Templates
Premium
-

Free Real Estate Listing PowerPoint Template
Free PowerPoint Templates
Free
-

Animated Agriculture PowerPoint Deck Template
PowerPoint Templates
Premium
-

Free University Presentation PowerPoint Template
PowerPoint Templates
Free
-

Free Book Review PowerPoint Template
Free PowerPoint Templates
Free
-

Free Event Planning PowerPoint Template
Free PowerPoint Templates
Free
-

Annual Report PowerPoint Template and Keynote
PowerPoint Templates
Premium
-
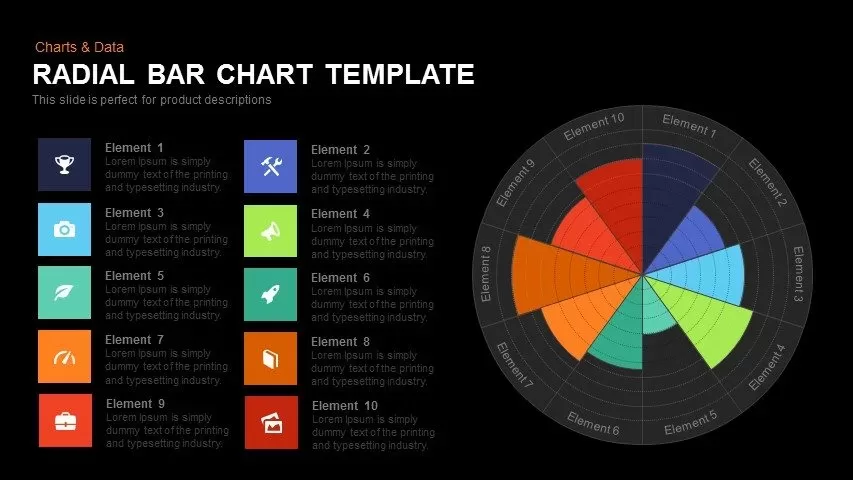
Radial Bar Chart Template for PowerPoint and Keynote
Circular Diagrams
Premium
-

Data Science PowerPoint Template
PowerPoint Templates
Premium
-
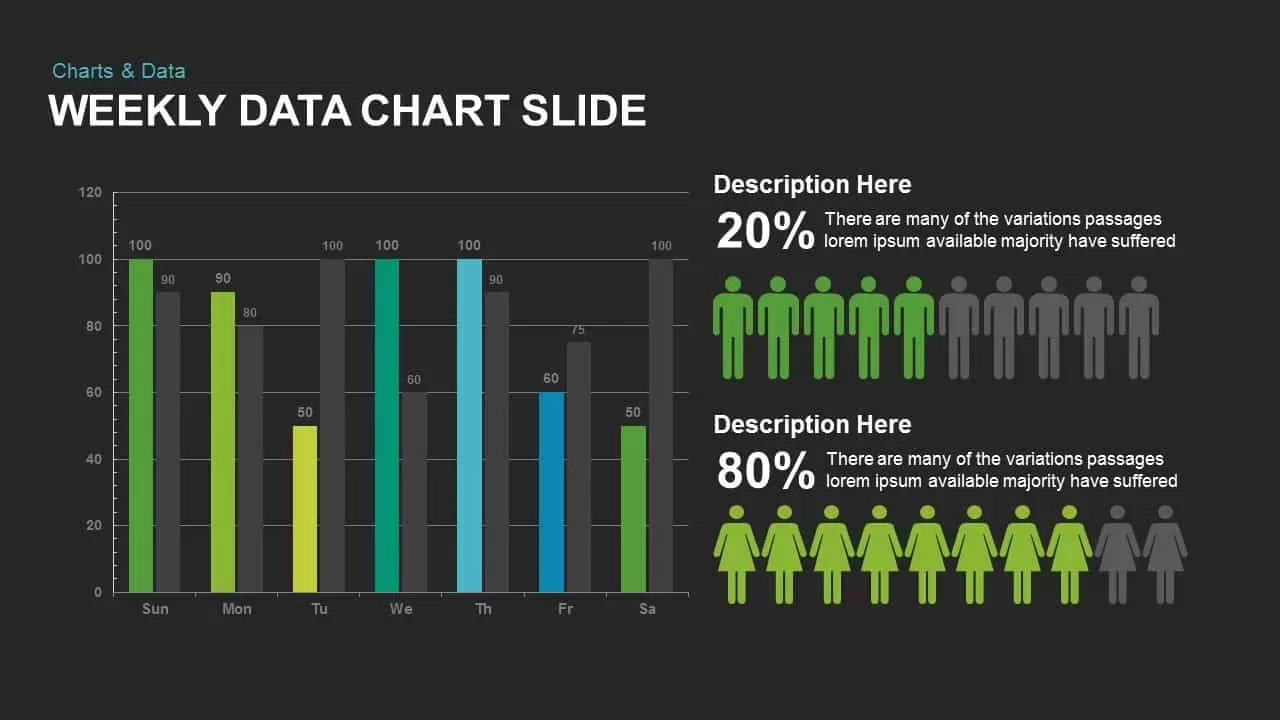
Weekly Data Charts PowerPoint Presentation Template and Keynote Slide
Infographic
Premium
-

Global Warming Infographic PowerPoint Template Deck
PowerPoint Templates
Premium
-

Radial Bar Chart PowerPoint Templates and Keynote Slides
PowerPoint Charts
Premium
-

Combination Chart PowerPoint Template
PowerPoint Charts
Premium
-
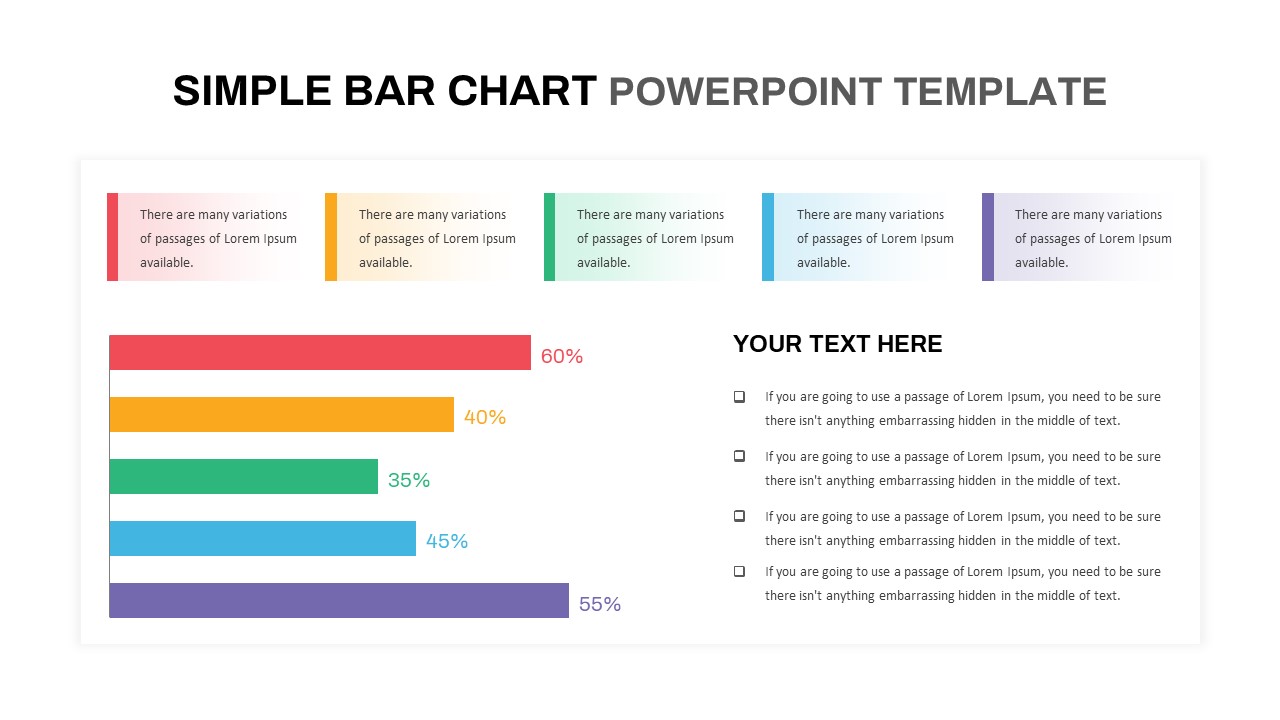
Simple Bar Chart PowerPoint Template
Column and Bar chart
Premium
-

Free Dunder Mifflin Paper Company Pitch Deck
Free PowerPoint Templates
Free
-

EFQM Model PowerPoint Template
PowerPoint Templates
Premium
-
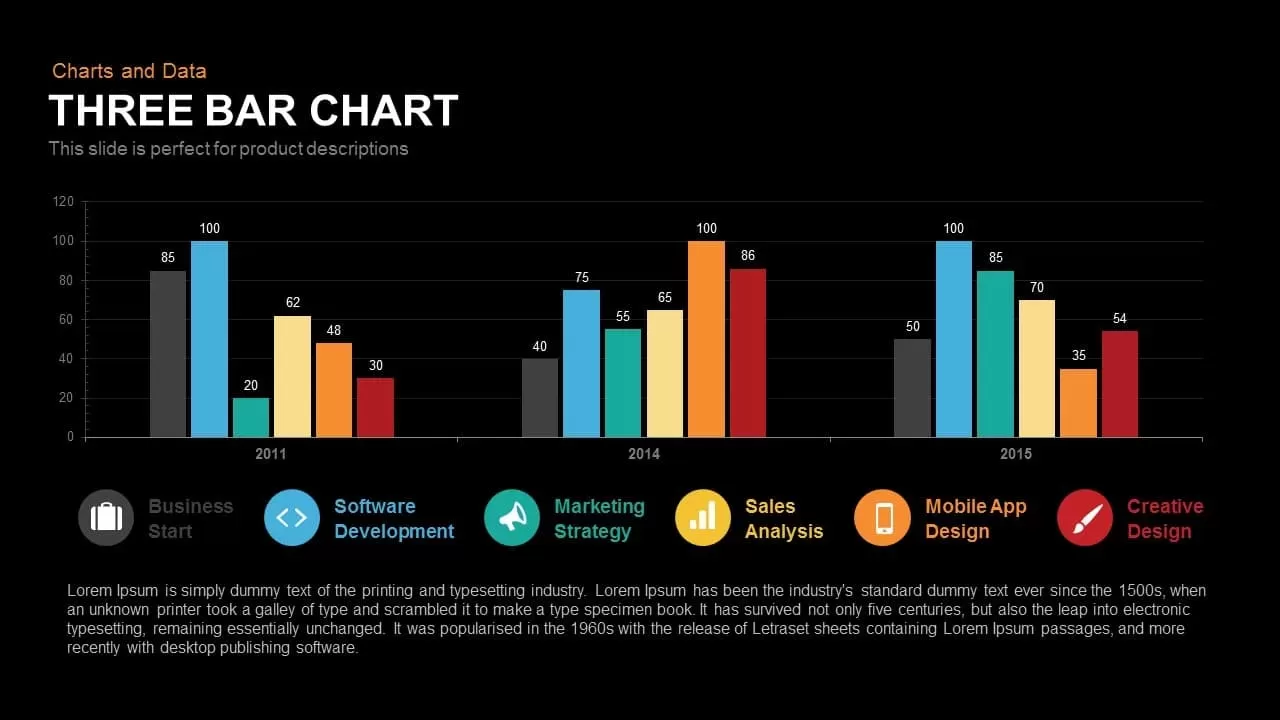
3 Bar Chart PowerPoint Template and Keynote Slide
Column and Bar chart
Premium
-

Animated Clustered Bar Chart PowerPoint Template
PowerPoint Charts
Premium
-
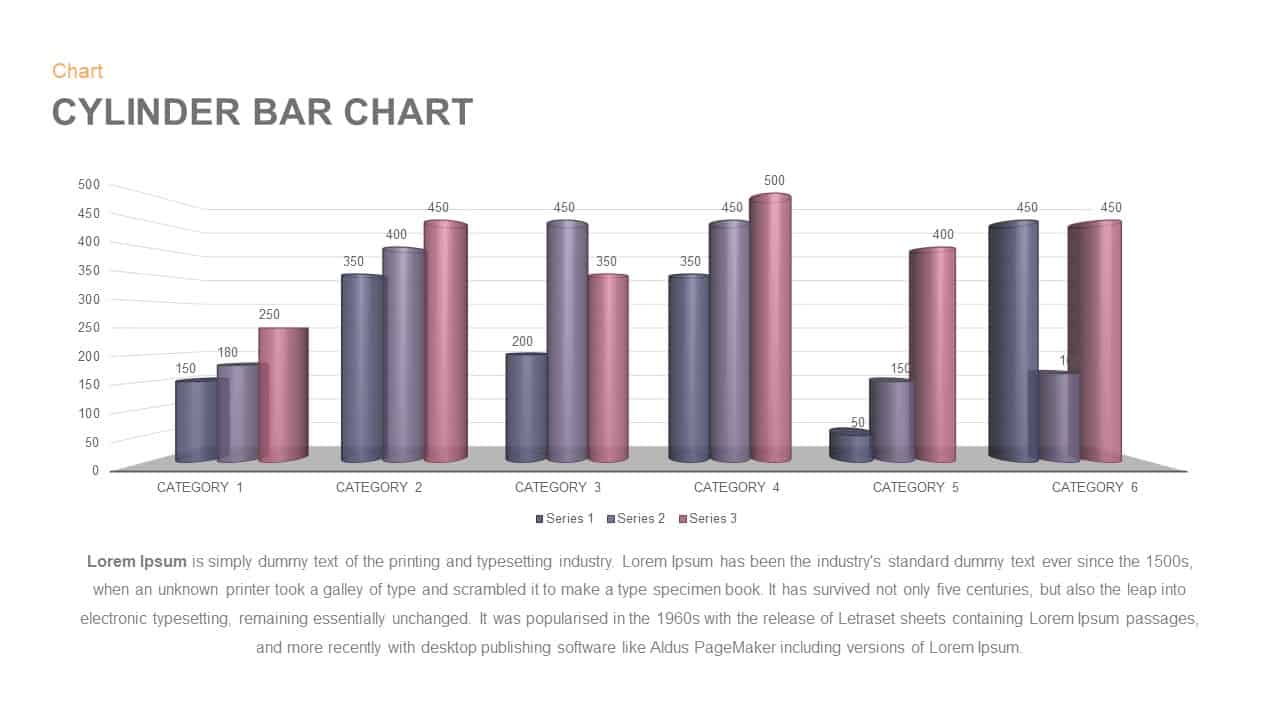
Cylinder Bar Chart PowerPoint Template and Keynote Slide
Column and Bar chart
Premium
-
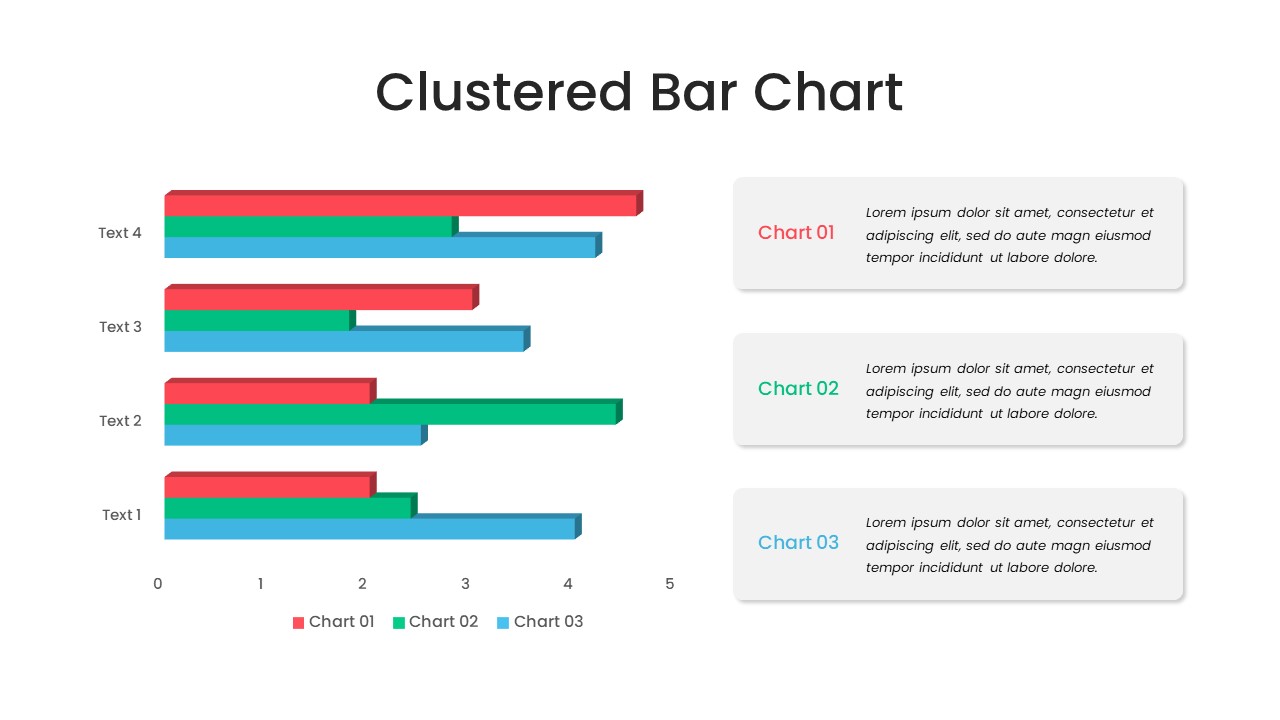
Clustered Bar Chart PowerPoint Template
Column and Bar chart
Premium
-
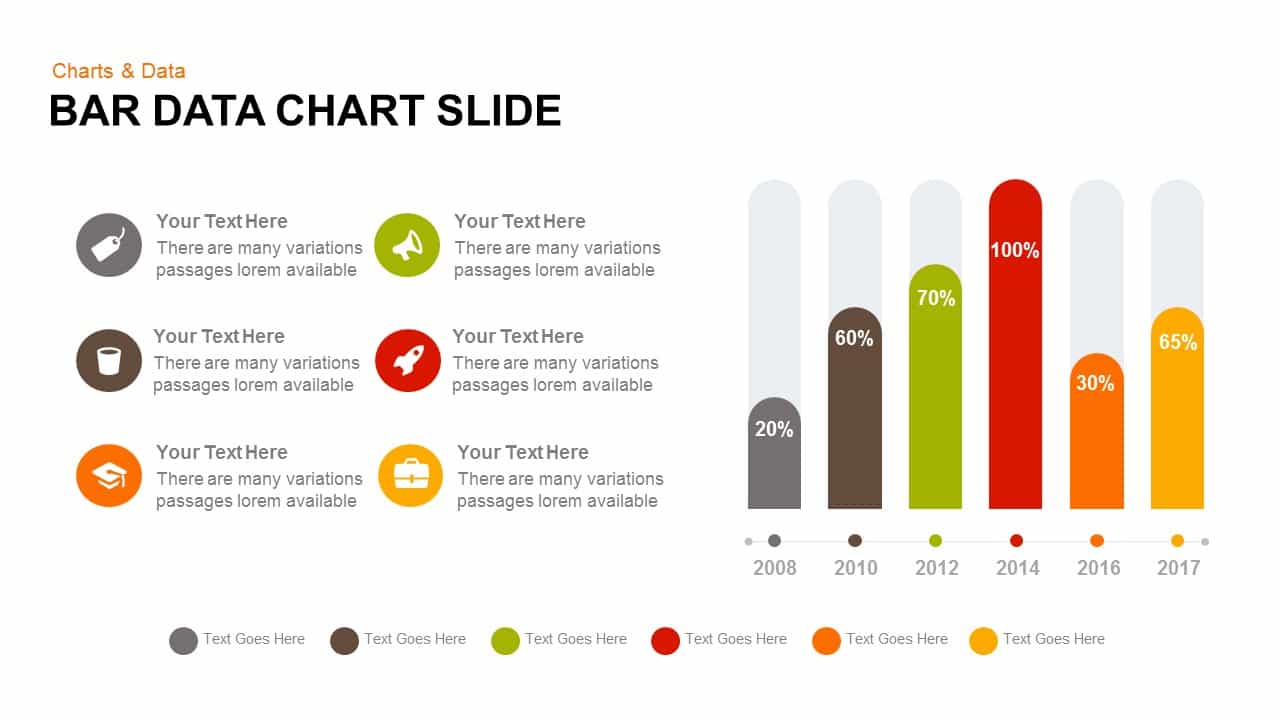
Data Bar Chart Template for PowerPoint and Keynote
Column and Bar chart
Premium
-
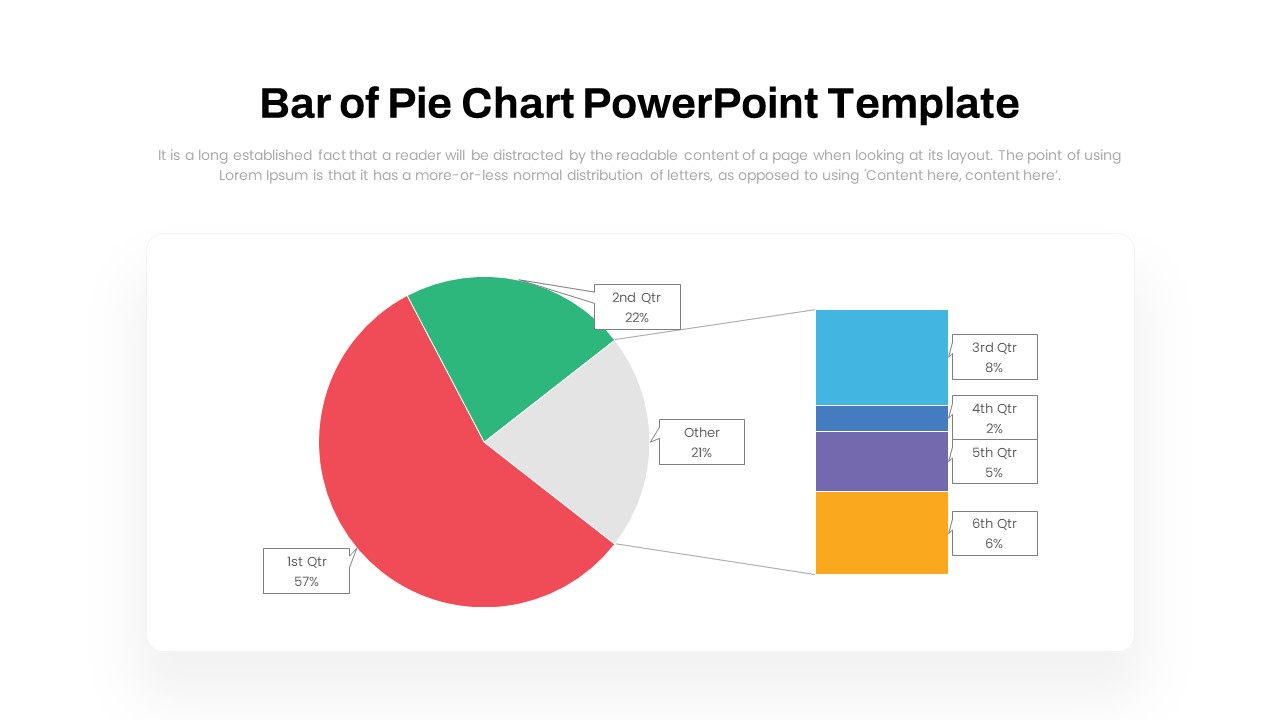
Bar of Pie Chart PowerPoint Template
PowerPoint Templates
Premium
-

Real Estate PowerPoint Theme
PowerPoint Themes
Premium
-
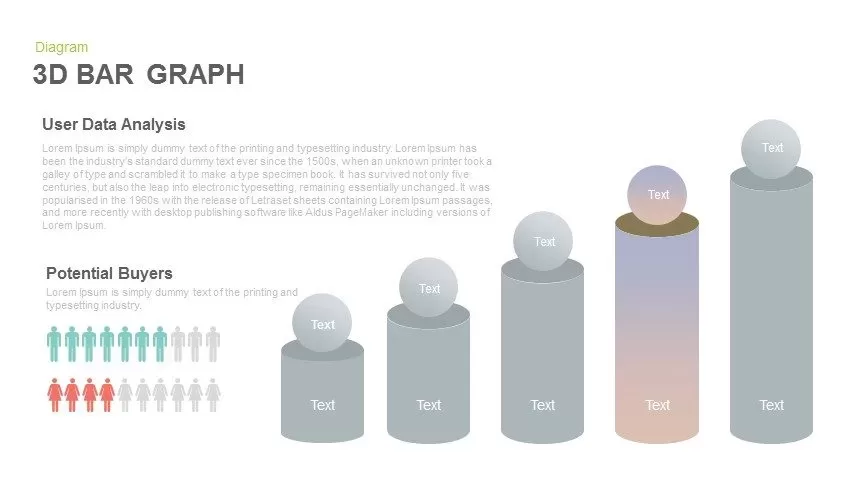
3d Bar Graph PowerPoint Template and Keynote Slide
Diagrams
Premium
-
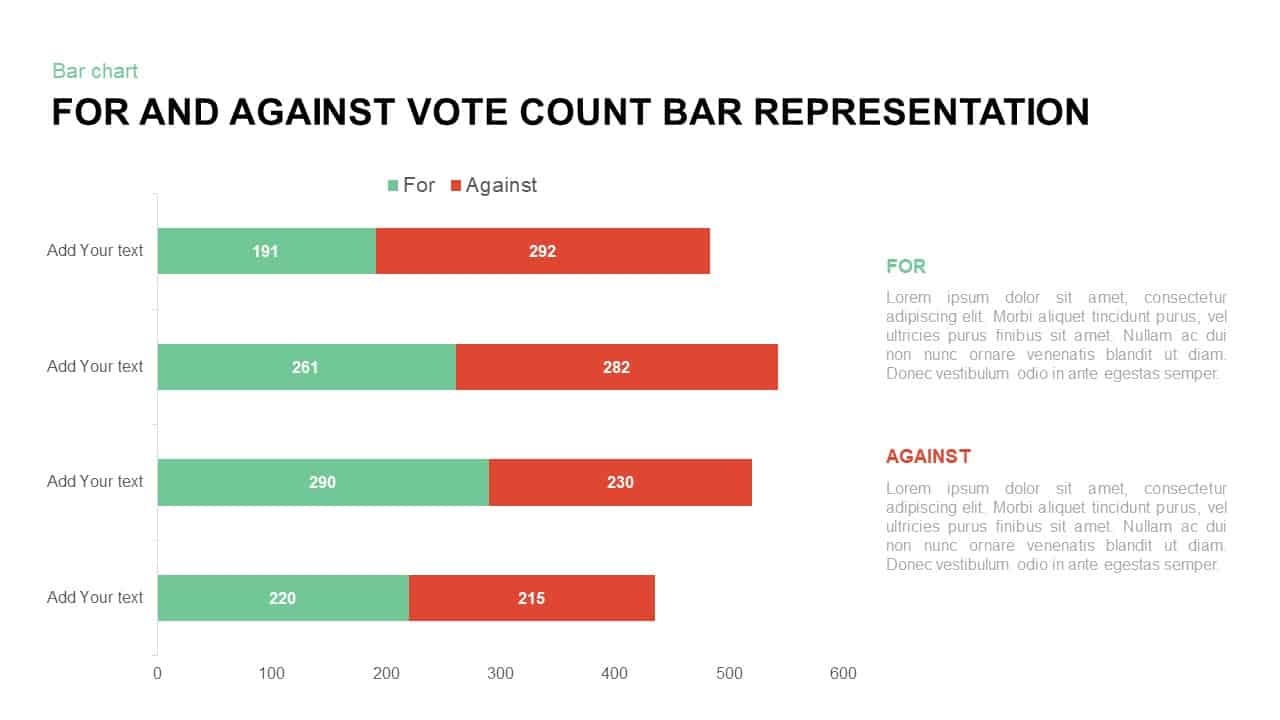
For and Against Vote Count Bar Chart for PowerPoint Presentation
Column and Bar chart
Premium
-
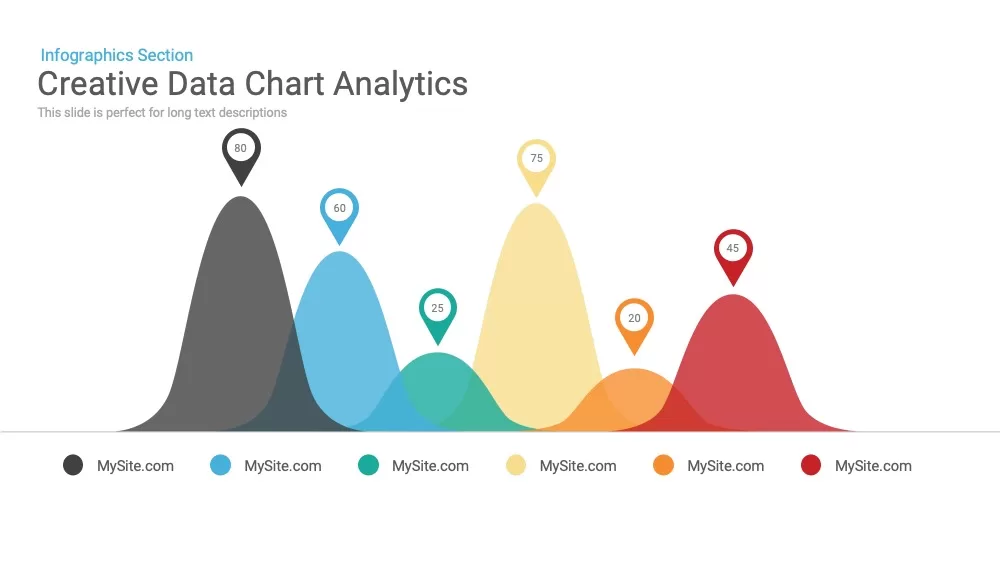
Data Analytics Chart PowerPoint Template and Keynote Slide
Diagrams
Premium
-
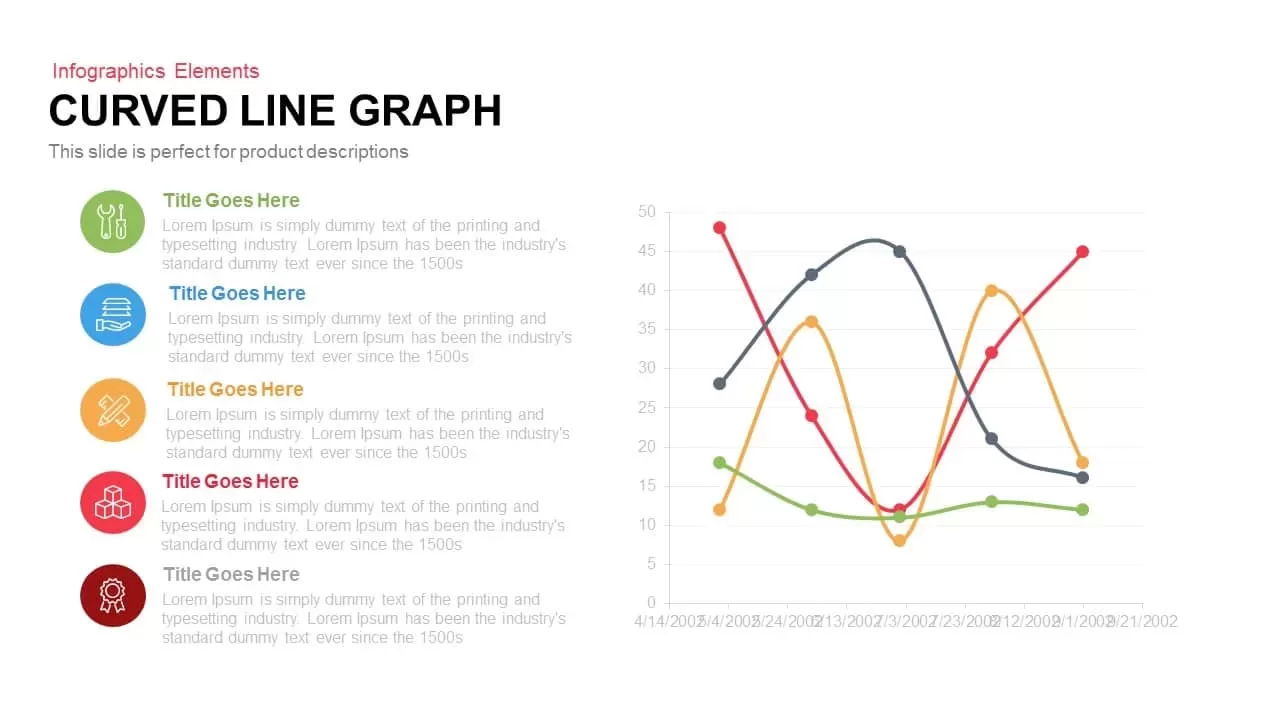
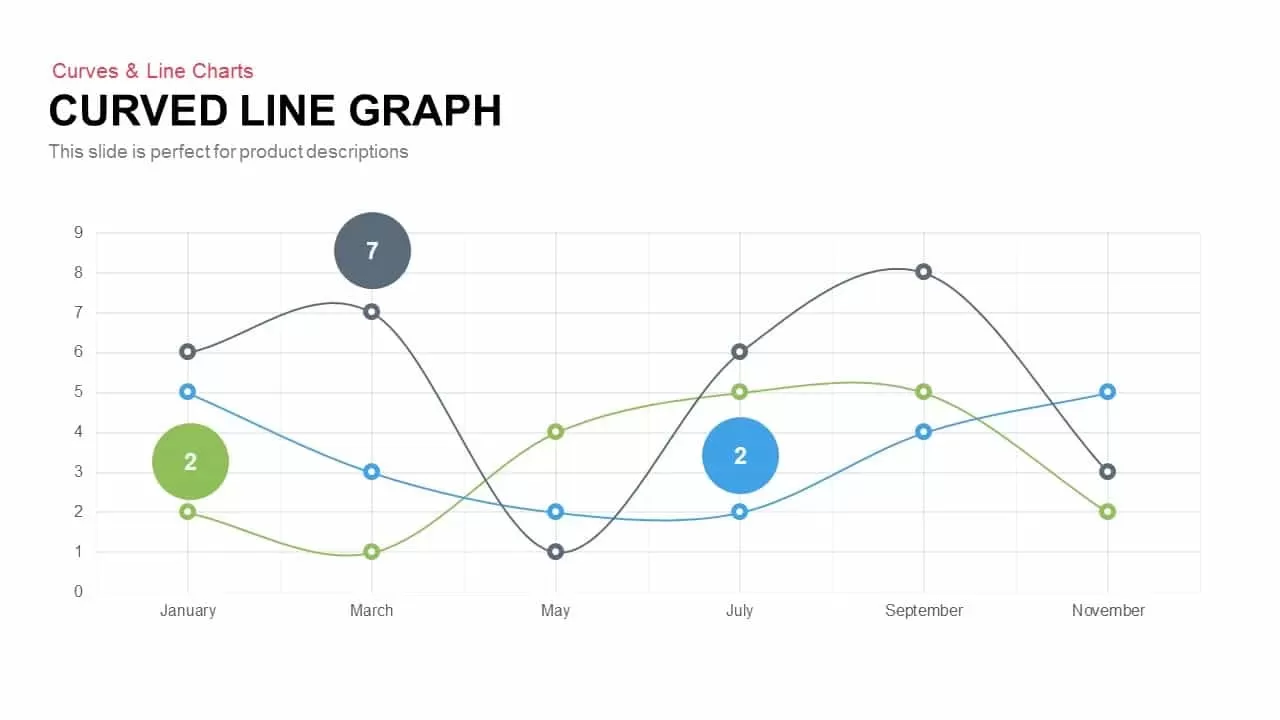
Curved Line Graph PowerPoint Template and Keynote Slide
Curves and Lines
Premium
-
Free Charts & Graphs Deck PowerPoint Template
PowerPoint Templates
Free
-
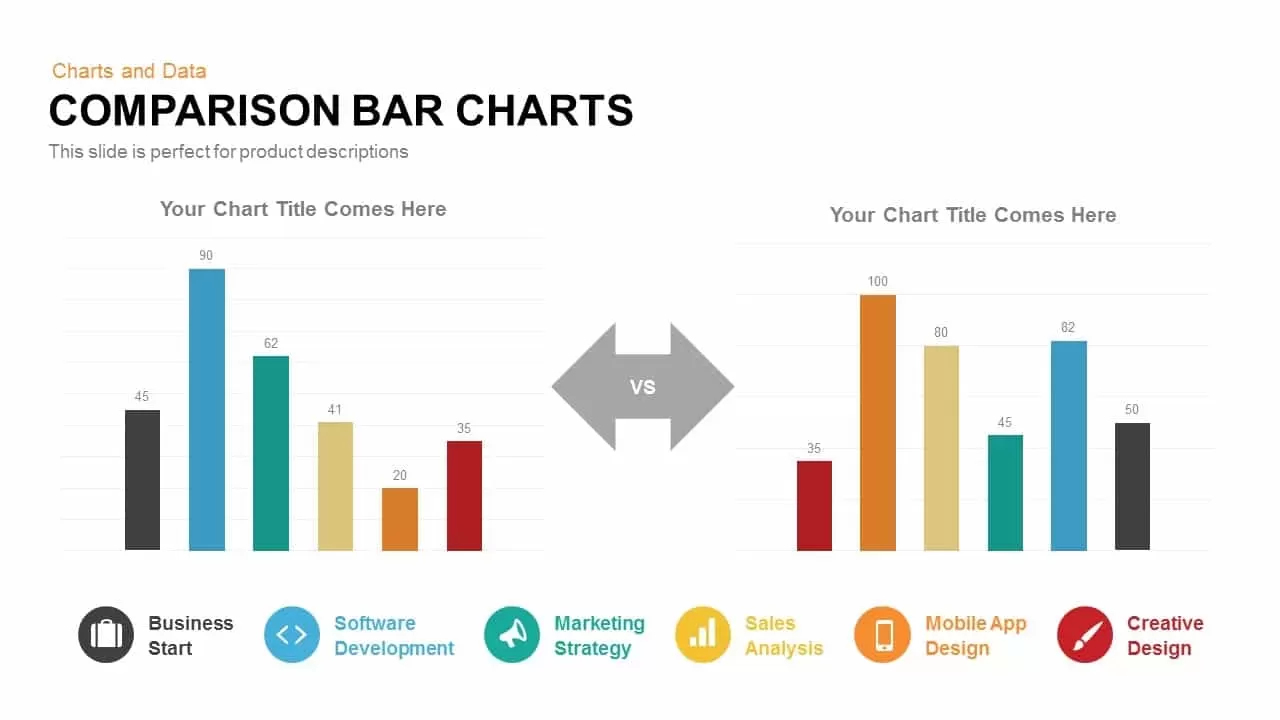
Comparison Bar Charts PowerPoint Template and Keynote Slide
Column and Bar chart
Premium
-
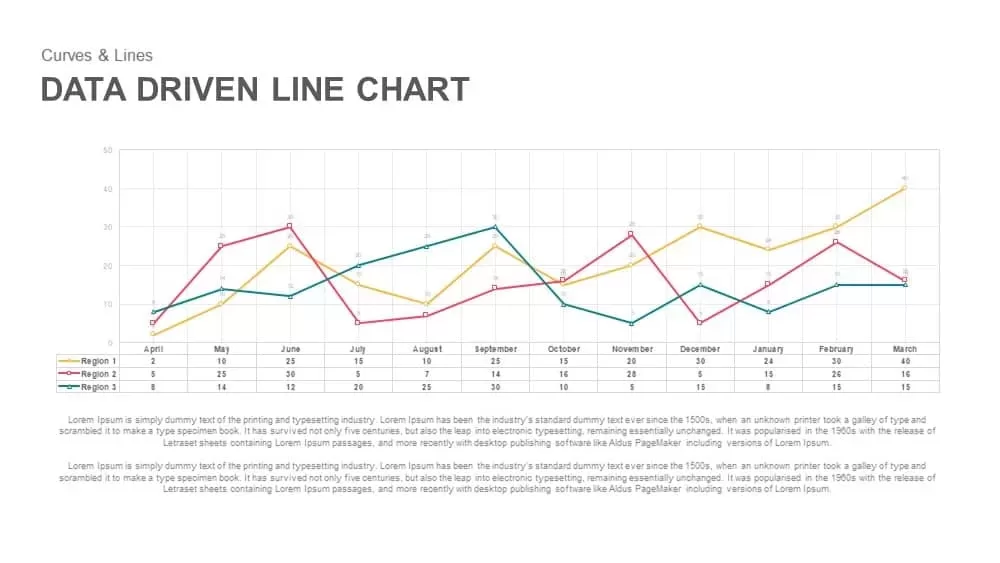
Data Driven Line Chart Template for PowerPoint & Keynote
Curves and Lines
Premium
-

Stakeholder Register PowerPoint Template
PowerPoint Templates
Premium
-

Free AI Artificial Intelligence PowerPoint Template
PowerPoint Templates
Free
-

Clustered Column Chart PowerPoint Template
PowerPoint Charts
Premium
-
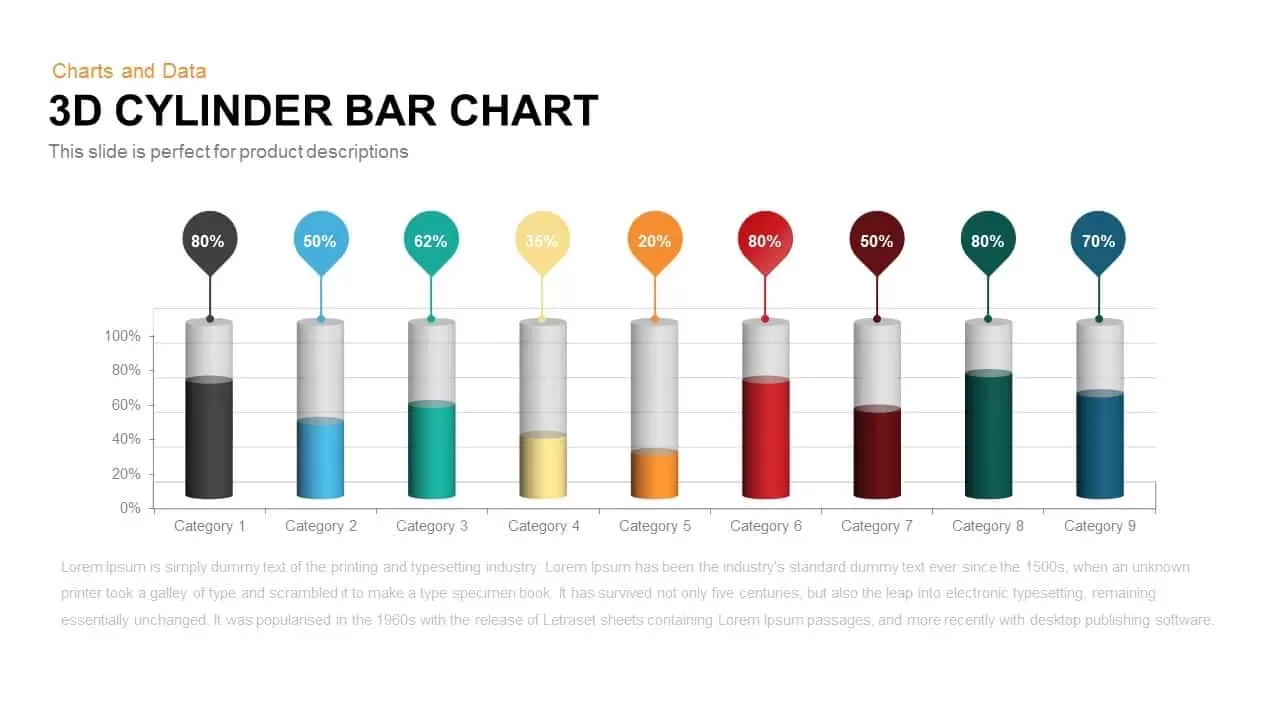
3D Cylinder Bar Chart PowerPoint Template and Keynote Slide
Column and Bar chart
Premium
-

Mekko Chart Template
PowerPoint Templates
Premium
-

Business Process Reengineering Template
PowerPoint Templates
Premium
-

Free Charts and Graphs PowerPoint Template
PowerPoint Templates
Free
-

Animated Upcoming Event Poster PowerPoint Template
PowerPoint Templates
Premium
-
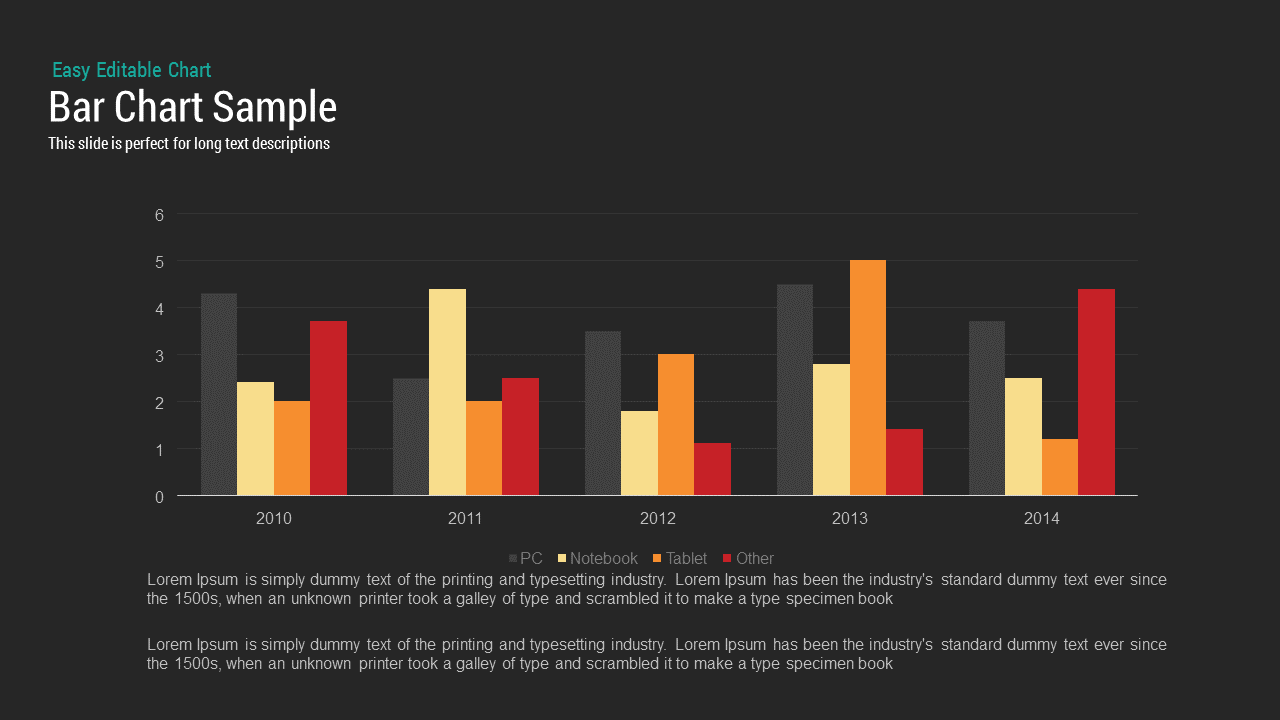
Sample Bar Chart Template for PowerPoint and Keynote Presentation
Column and Bar chart
Premium
-
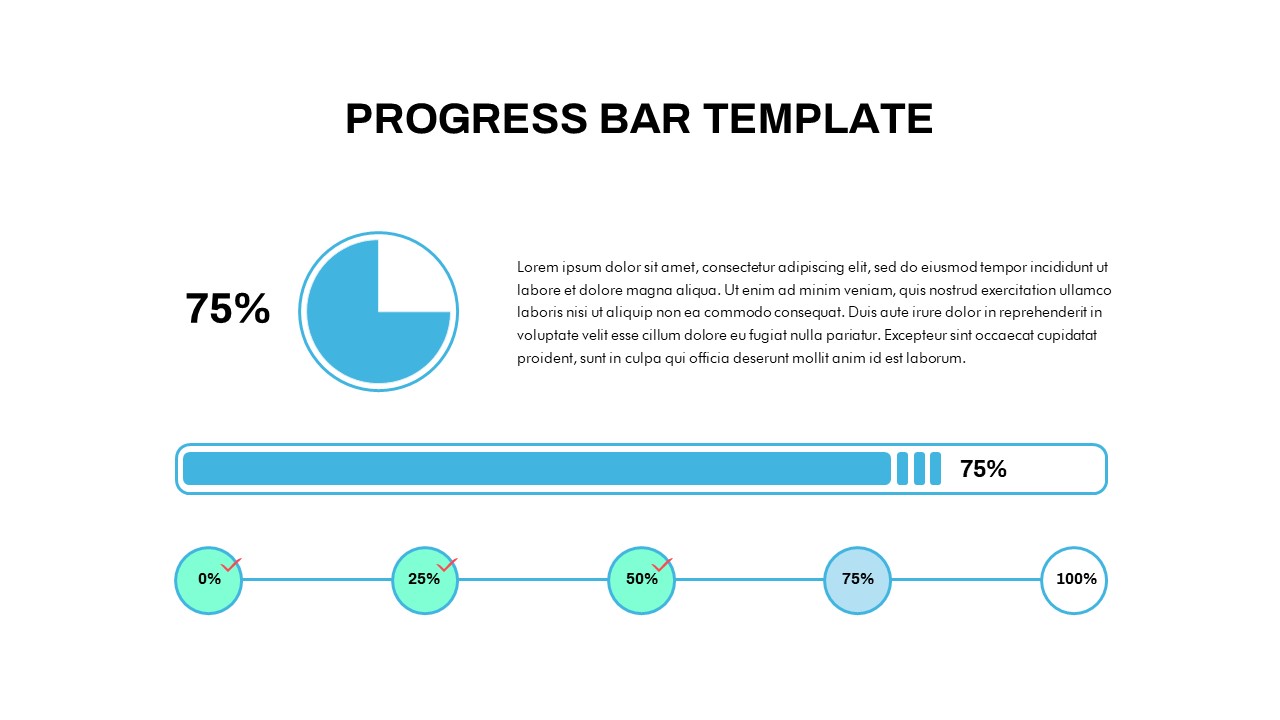
Progress Bar Chart PowerPoint Template
PowerPoint Templates
Premium
-
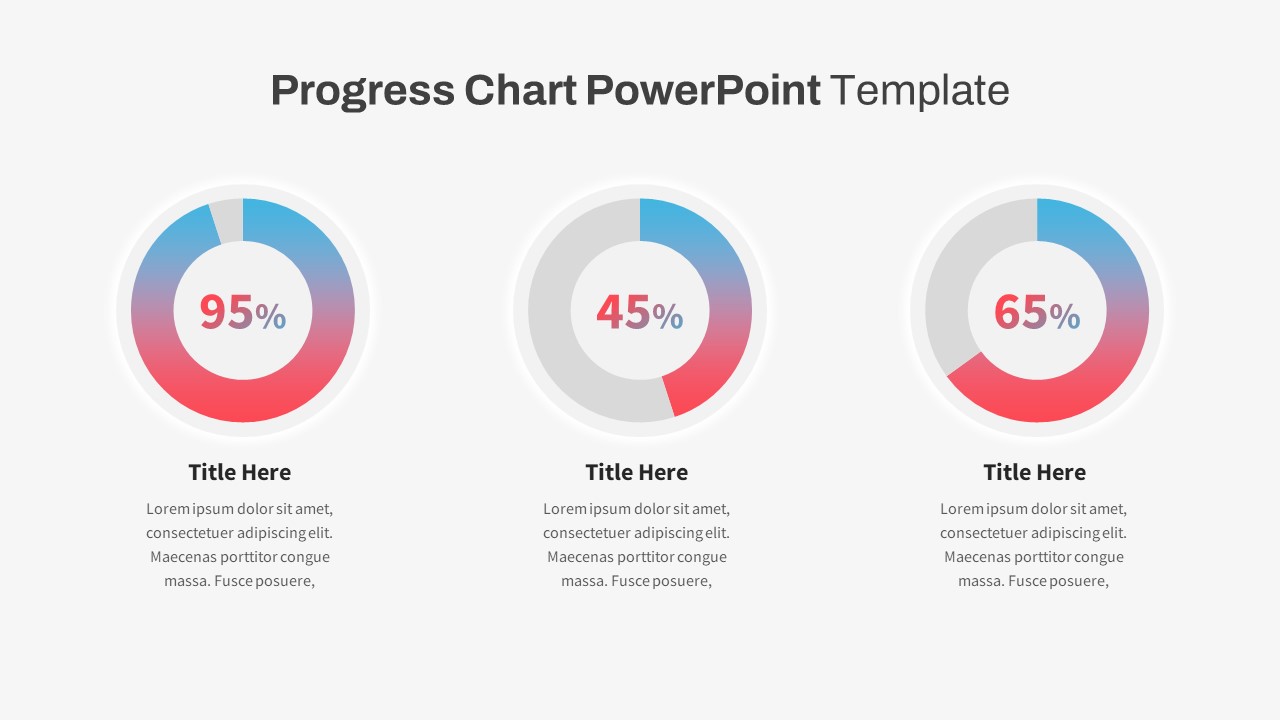
Progress Chart PowerPoint Template
PowerPoint Templates
Premium
-
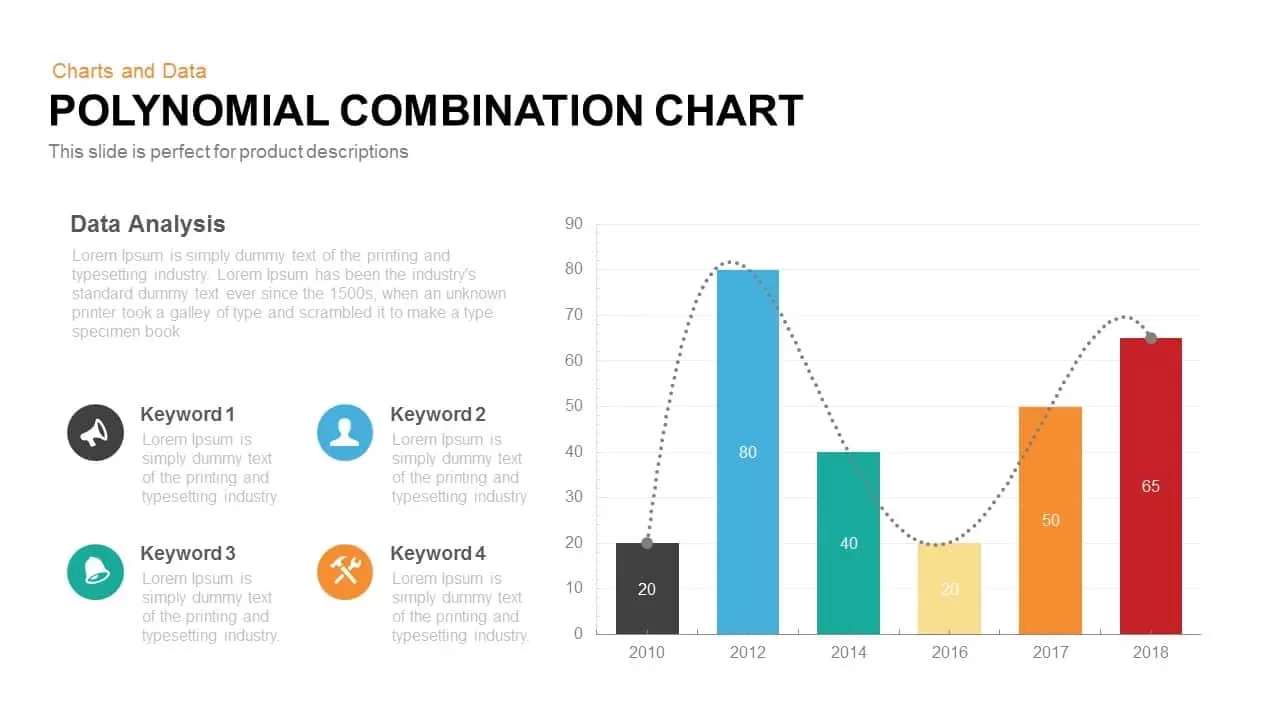
Polynomial Combination Chart PowerPoint Template and Keynote Slide
Column and Bar chart
Premium
-
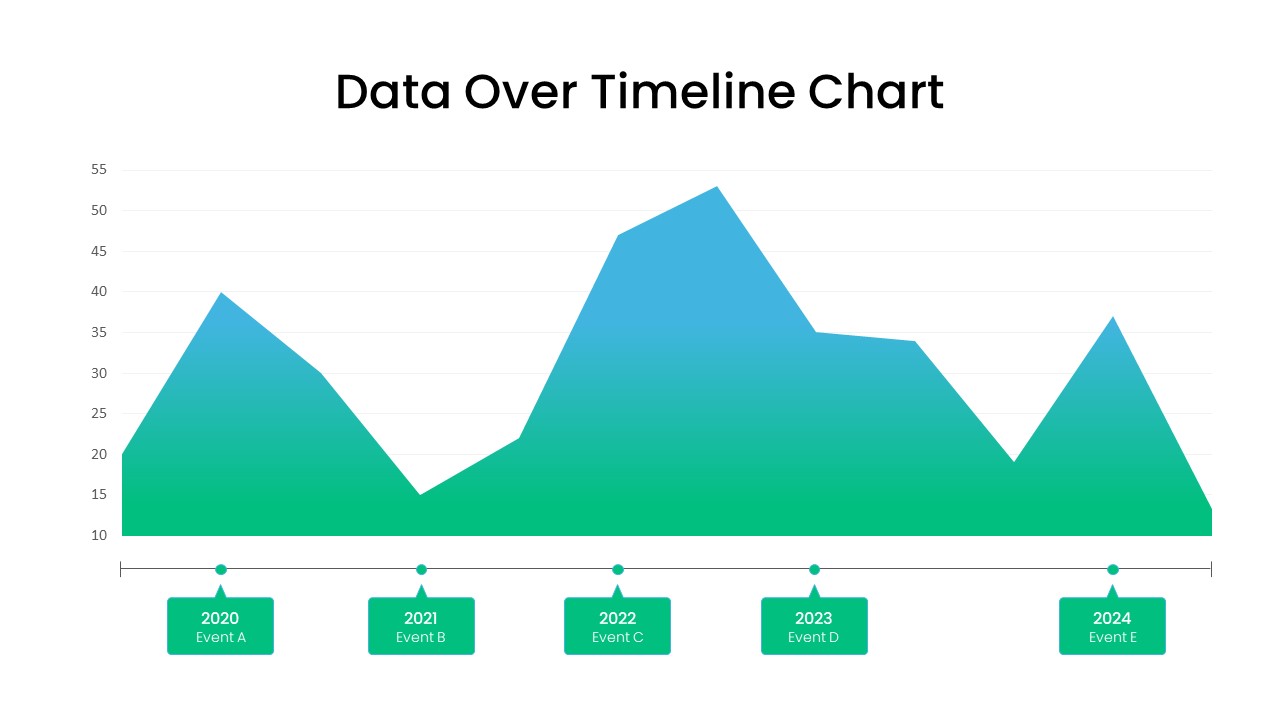
Data Over Time Line Chart PowerPoint Template
PowerPoint Charts
Premium
-
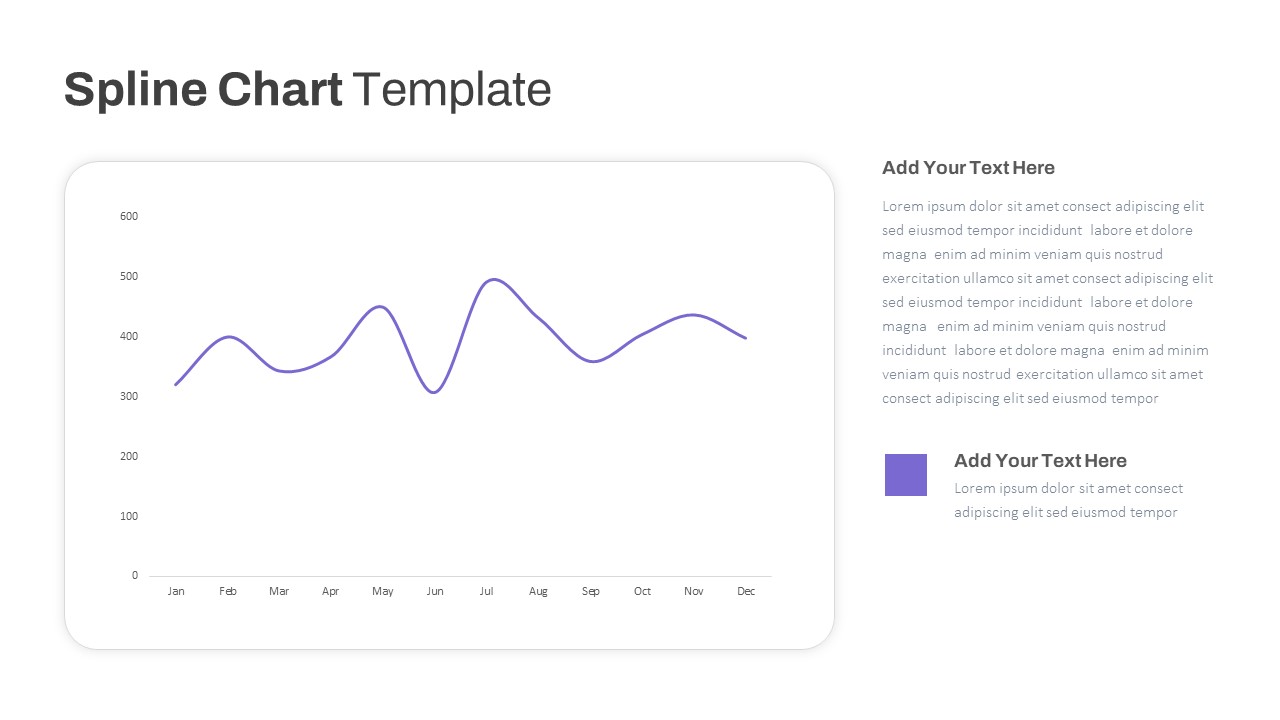
Spline Chart PowerPoint Template
PowerPoint Charts
Premium
-
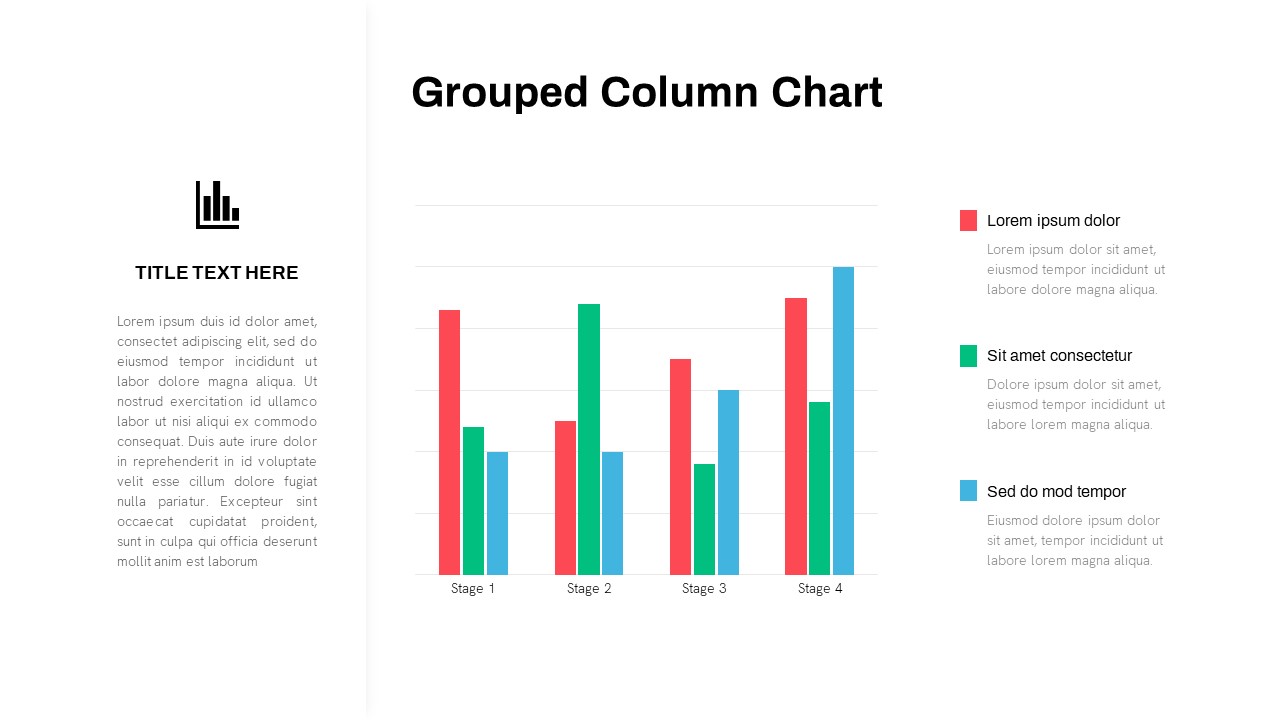
Grouped Column Chart PowerPoint Template
Column and Bar chart
Premium
-
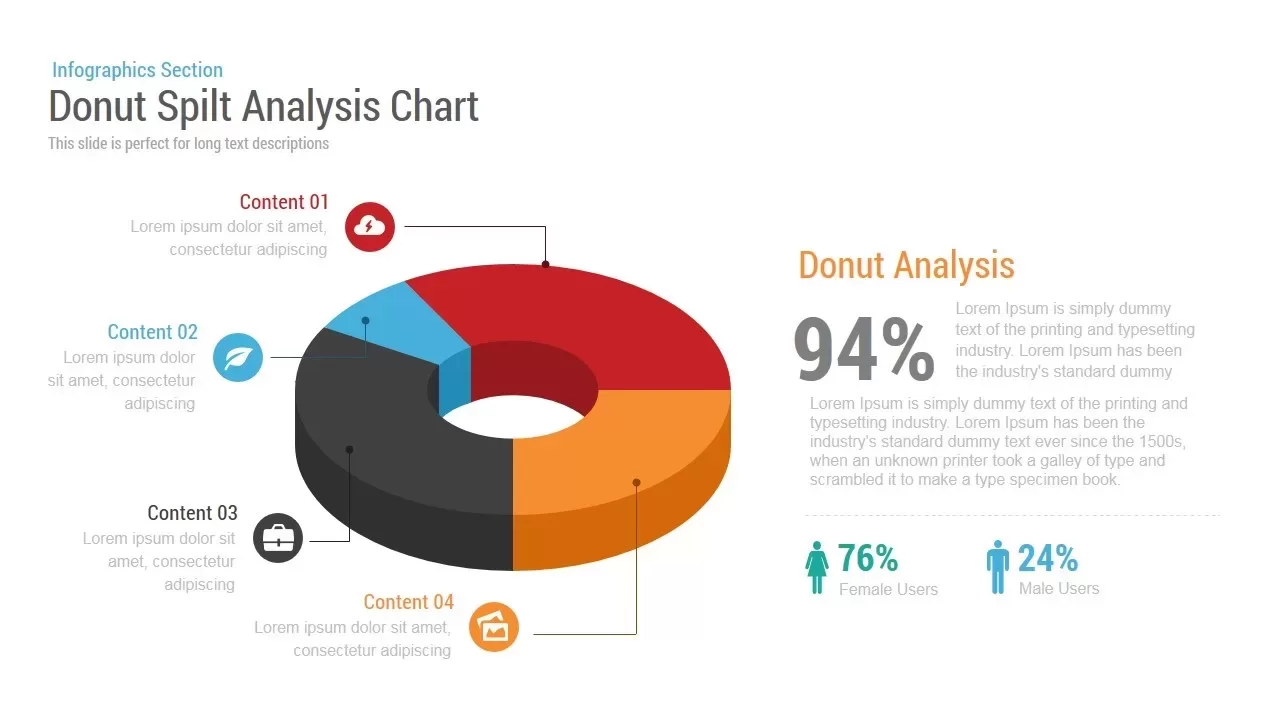
Donut Split Analysis Chart PowerPoint Template and Keynote Slide
Infographic
Premium
-
Timeline Bar Chart PowerPoint
Column and Bar chart
Premium
-
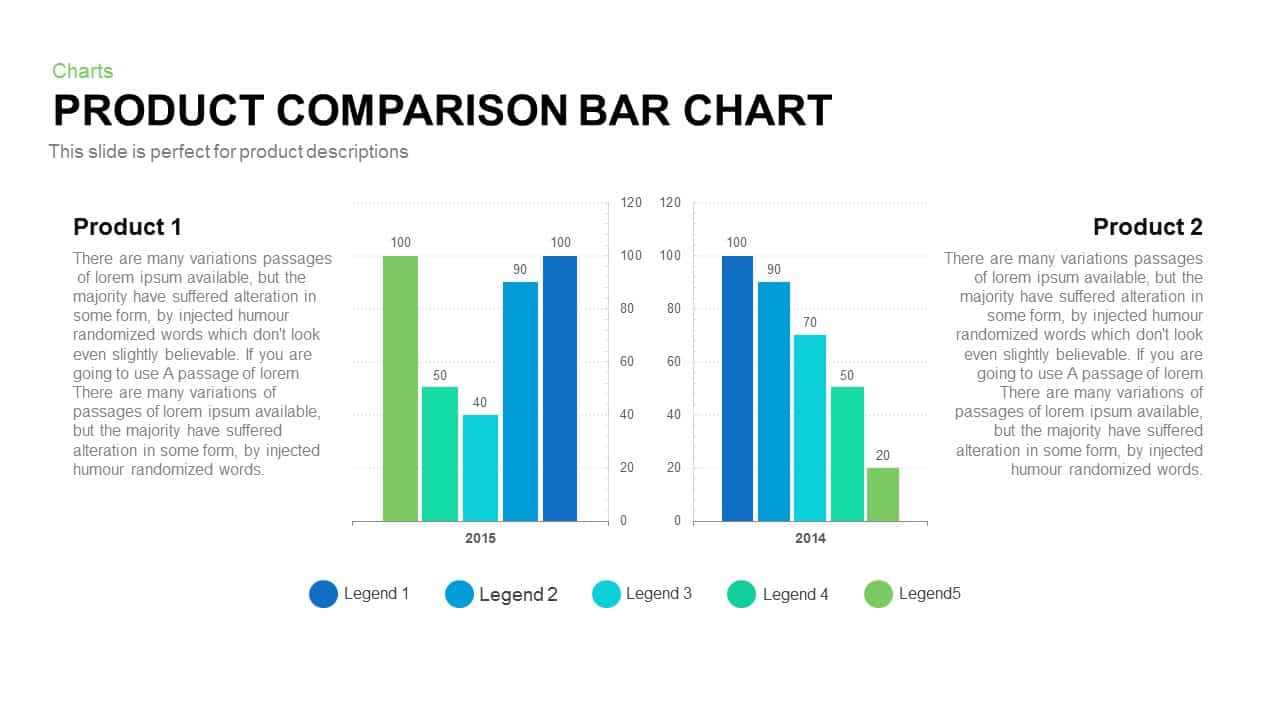
Product Comparison Bar Chart Template for PowerPoint and Keynote
PowerPoint Charts
Premium
-
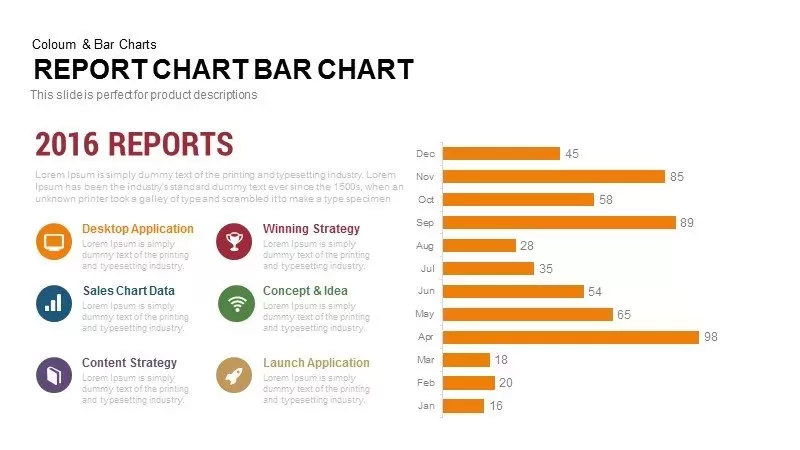
Report Bar Chart PowerPoint Template and Keynote
Column and Bar chart
Premium
-

Open Door Policy PowerPoint Template
PowerPoint Templates
Premium
-

Biotechnology PowerPoint Presentation Template
PowerPoint Templates
Premium
-
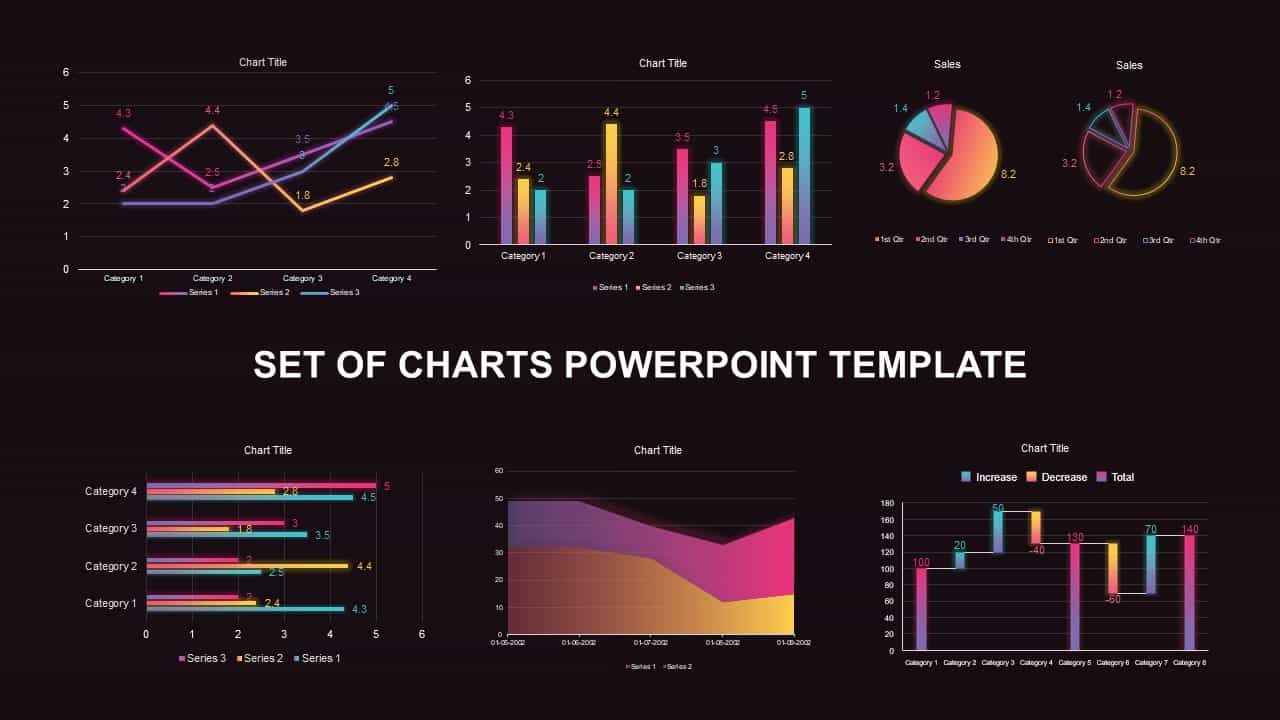
Set of Chart PowerPoint Template and Keynote Diagram
PowerPoint Charts
Premium
-
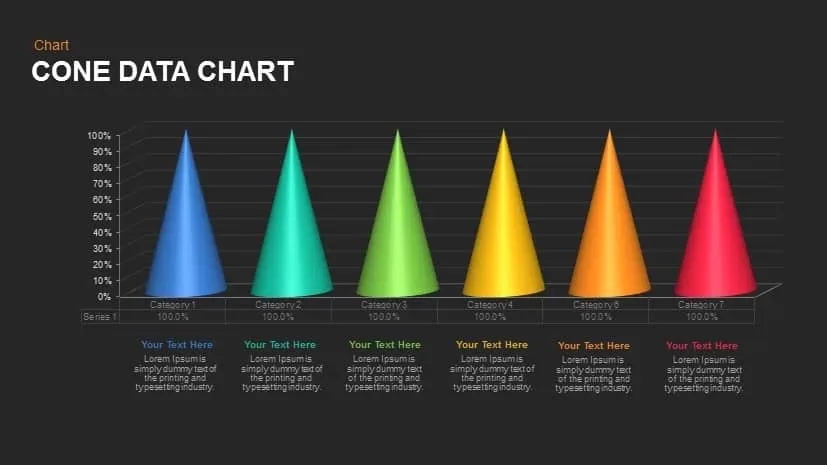
Cone Chart Data PowerPoint Template
Column and Bar chart
Premium
-

Creative Studio PowerPoint Template
PowerPoint Business Templates
Premium
-

Multipurpose Business PowerPoint Template
PowerPoint Business Templates
Premium
-
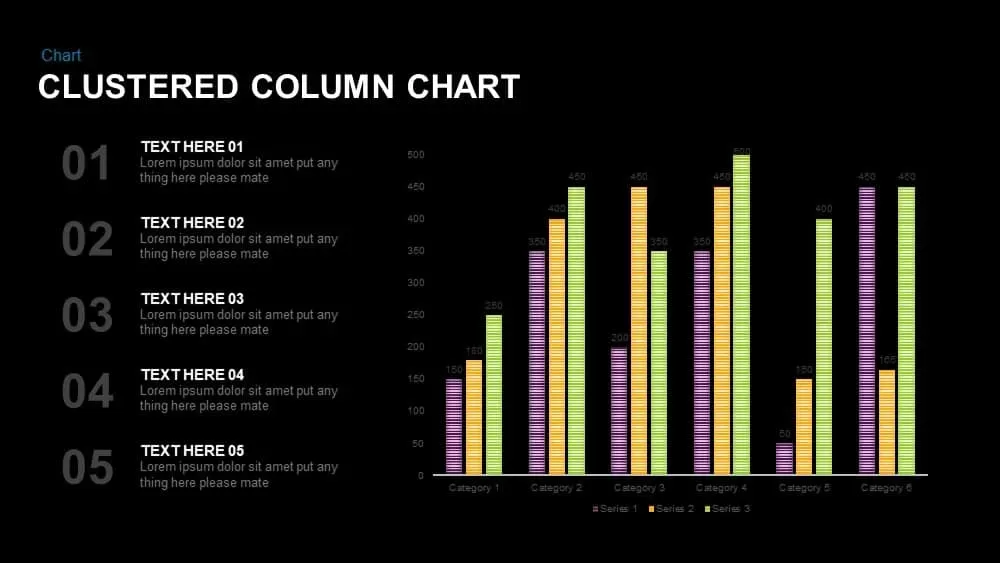
Clustered Column Chart PowerPoint and Keynote Slide
PowerPoint Charts
Premium
-
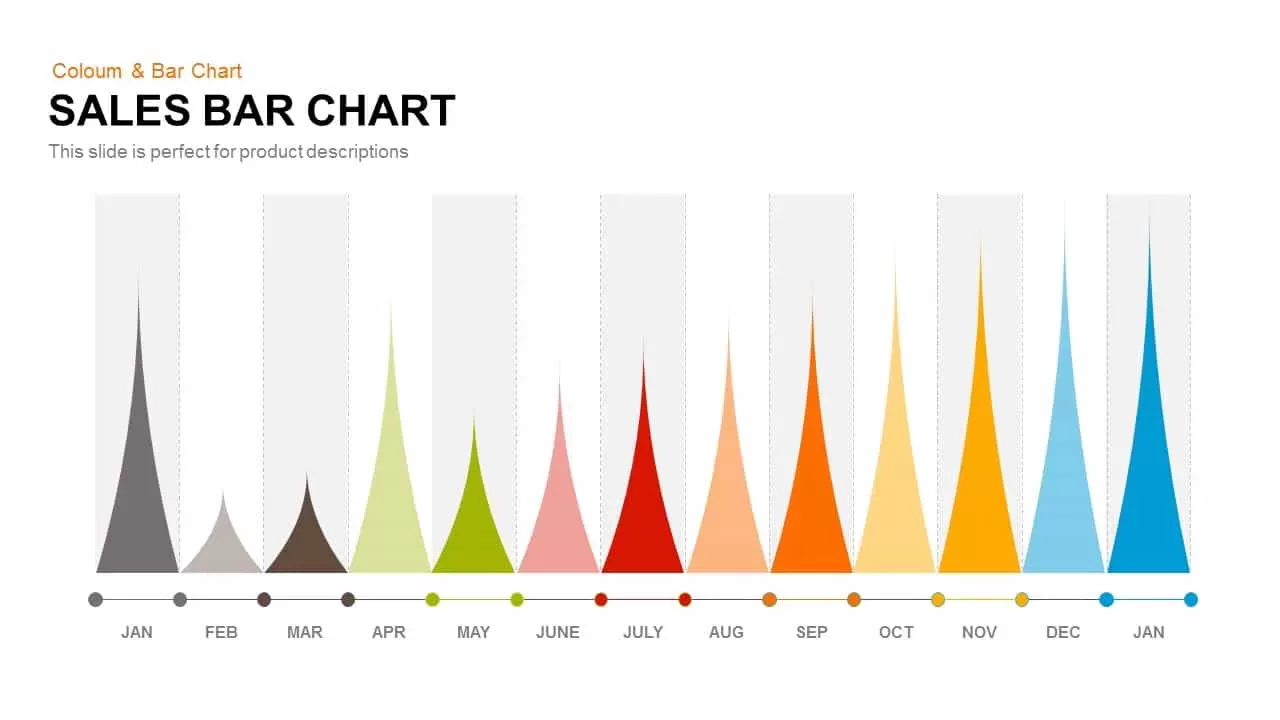
Sales Bar Chart Template for PowerPoint and Keynote
Column and Bar chart
Premium
-
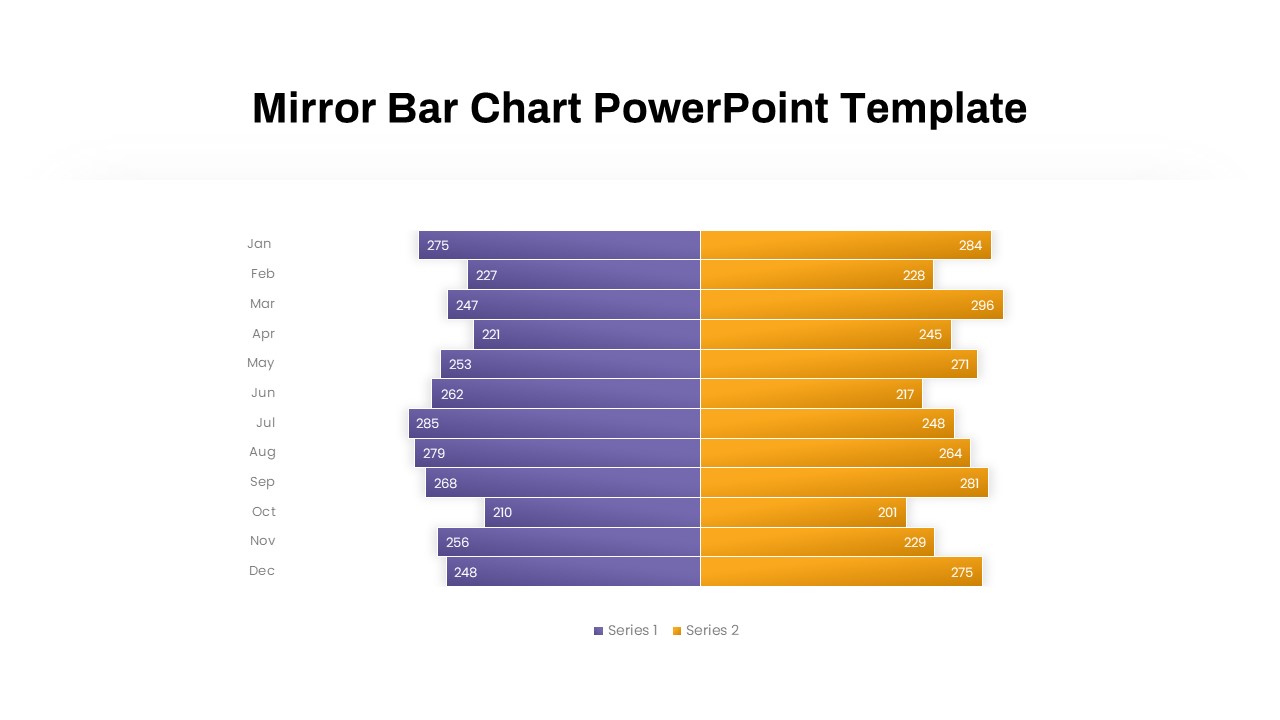
Mirror Bar Chart PowerPoint Template
PowerPoint Templates
Premium
-
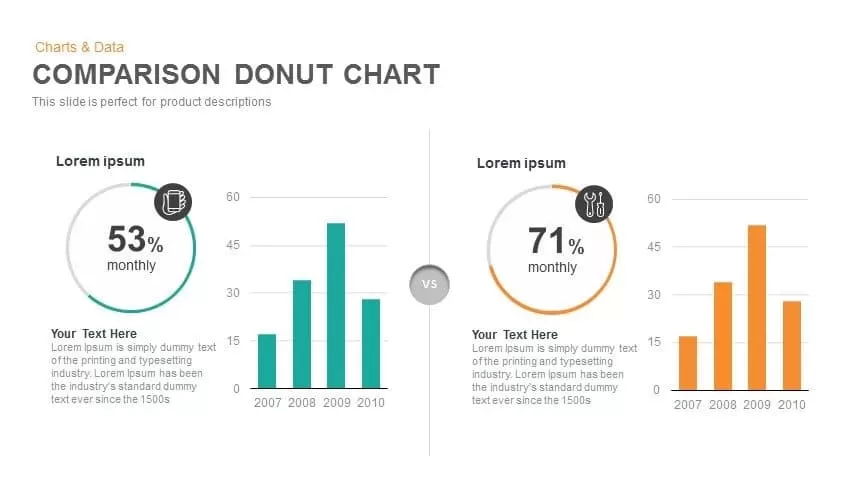
Comparison Donut Chart PowerPoint Template and Keynote
Keynote Templates
Premium
-
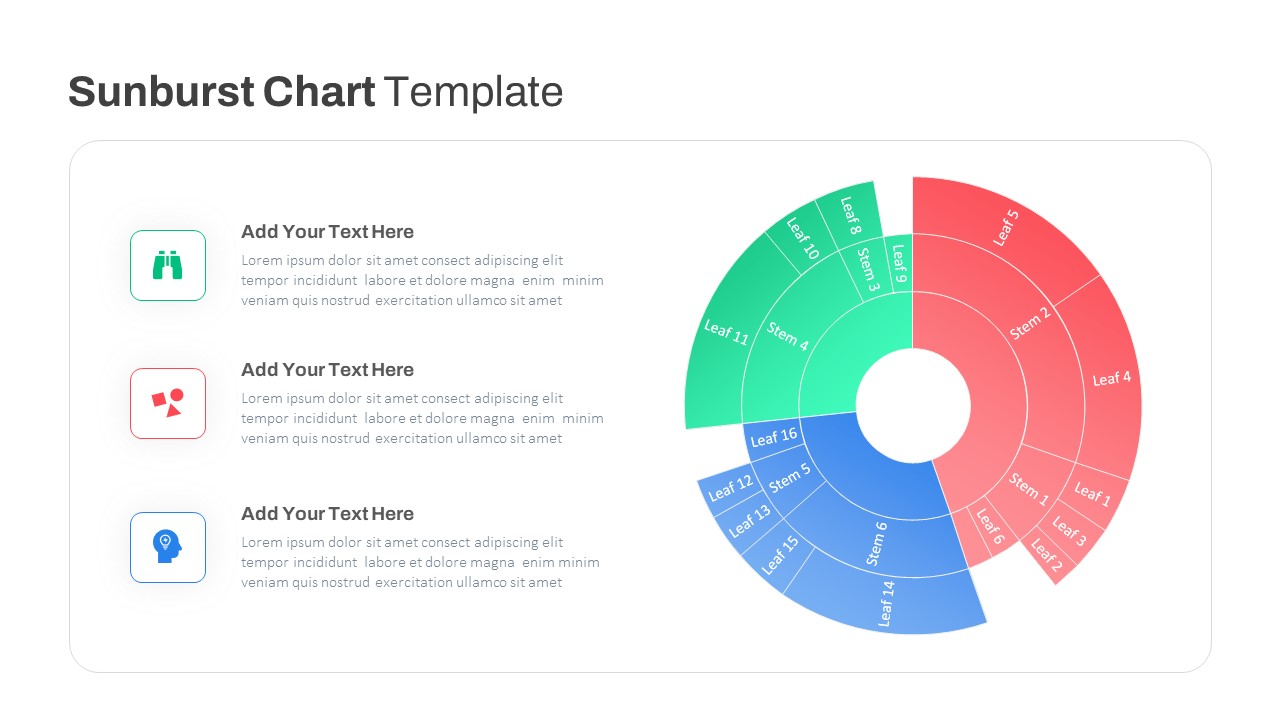
Sun Burst Chart PowerPoint Template
Circular Diagrams
Premium
-

Power Analogy Metaphor PowerPoint Template
Metaphor, Simile & Analogy
Premium
-

Area Chart PowerPoint Template
PowerPoint Charts
Premium
-
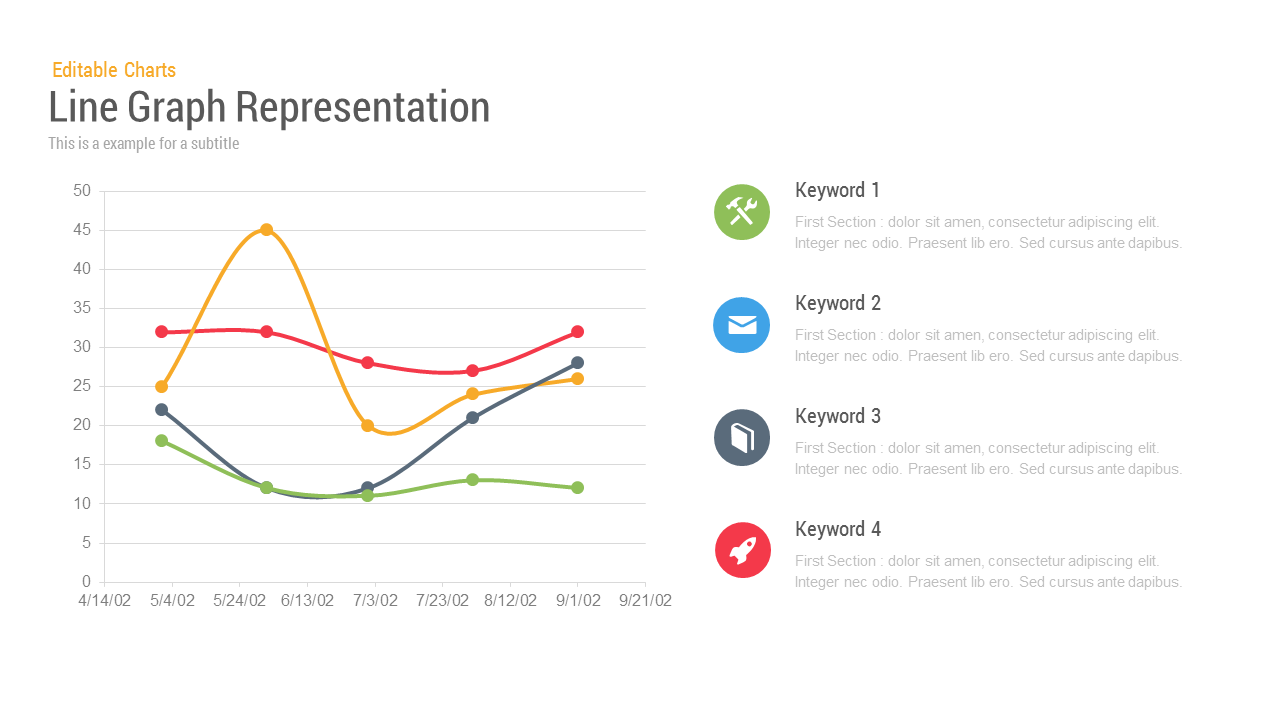
Line Chart Representation PowerPoint Templates and Keynote Slides
PowerPoint Charts
Premium
-
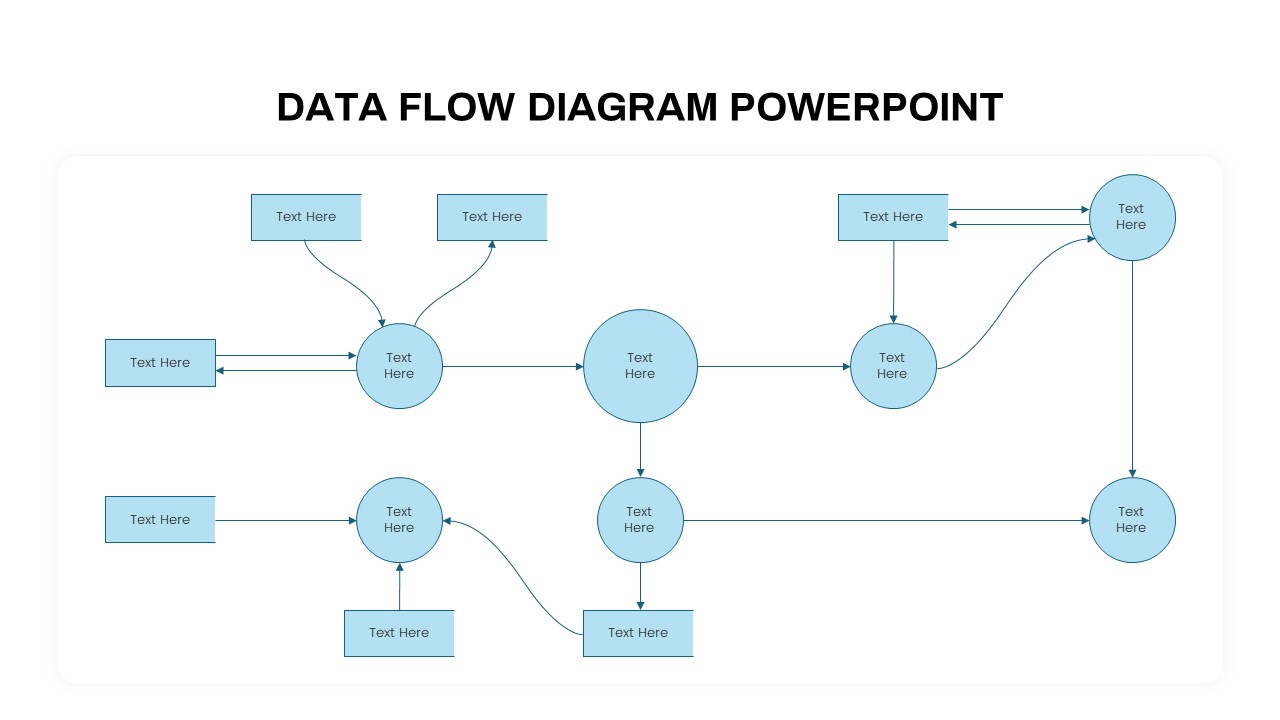
Data Flow PowerPoint Presentation Template
PowerPoint Templates
Premium
-
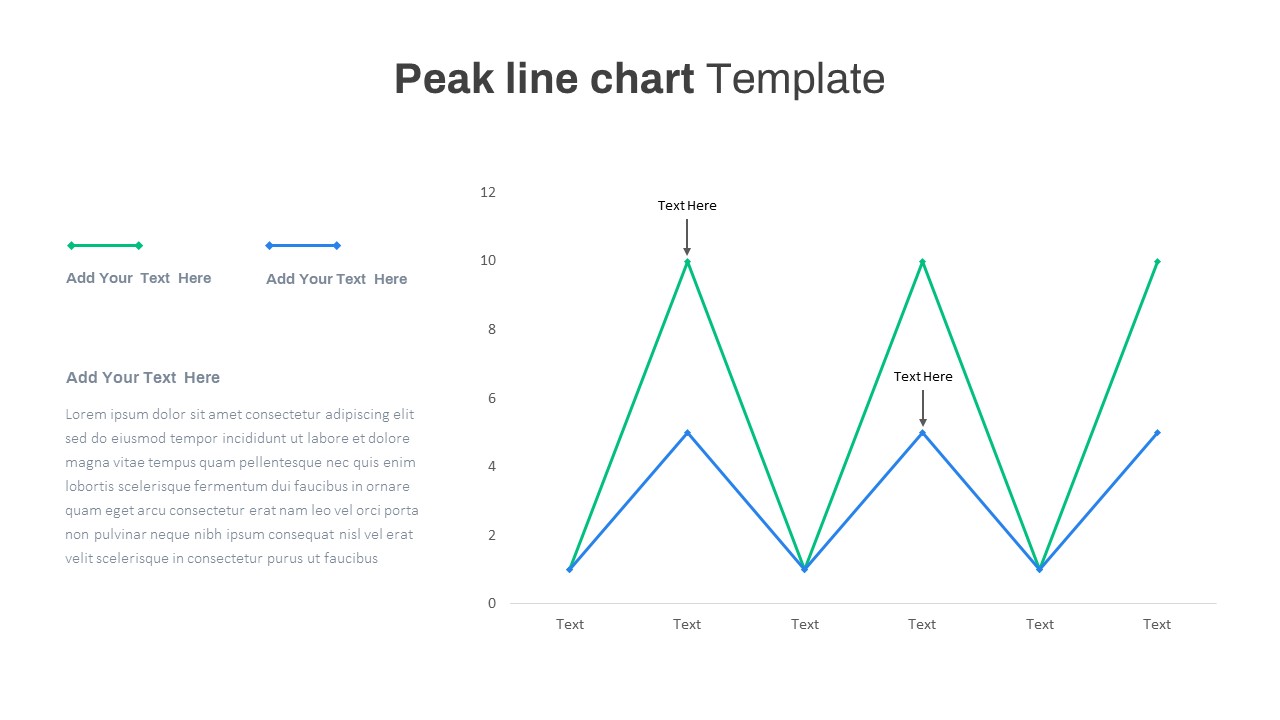
Peak Line Chart PowerPoint Template
PowerPoint Charts
Premium
-
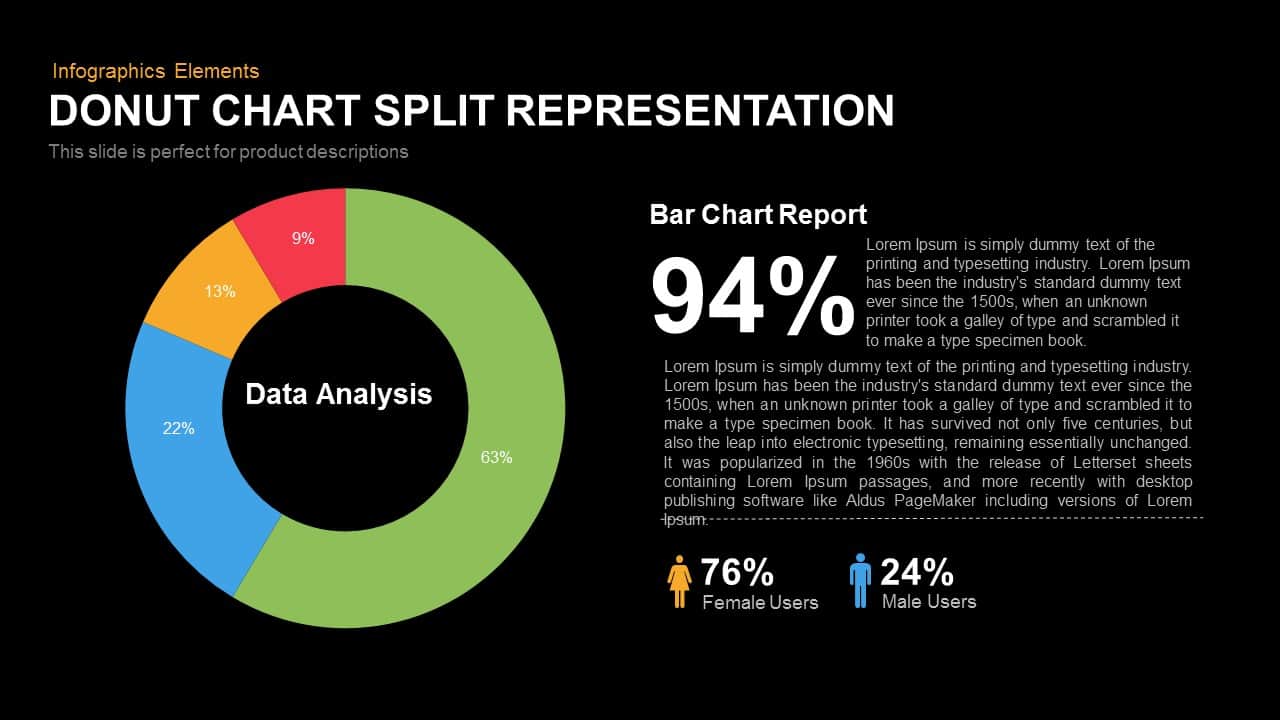
Split Representation Donut Chart Template for PowerPoint and Keynote
Keynote Templates
Premium
-
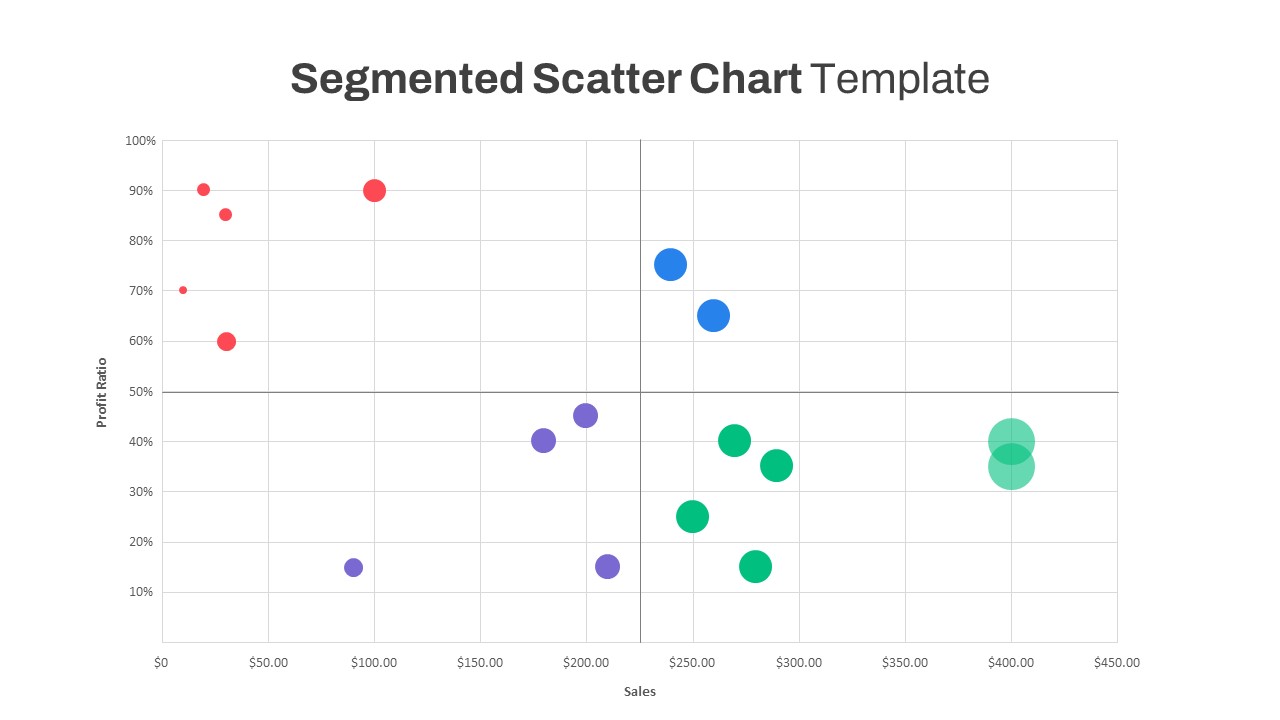
Segmented Scatter Chart PowerPoint Template
PowerPoint Charts
Premium
-
Business Growth Chart Template for PowerPoint and Keynote
Business Models
Premium
-
3D Bar Chart Infographics Template for PowerPoint and Keynote
Diagrams
Premium
-
Multi level Donut Chart Template for PowerPoint and Keynote
PowerPoint Charts
Premium
-
Creative Isometric Organization Chart PowerPoint Template and Keynote template
Keynote Templates
Premium
-
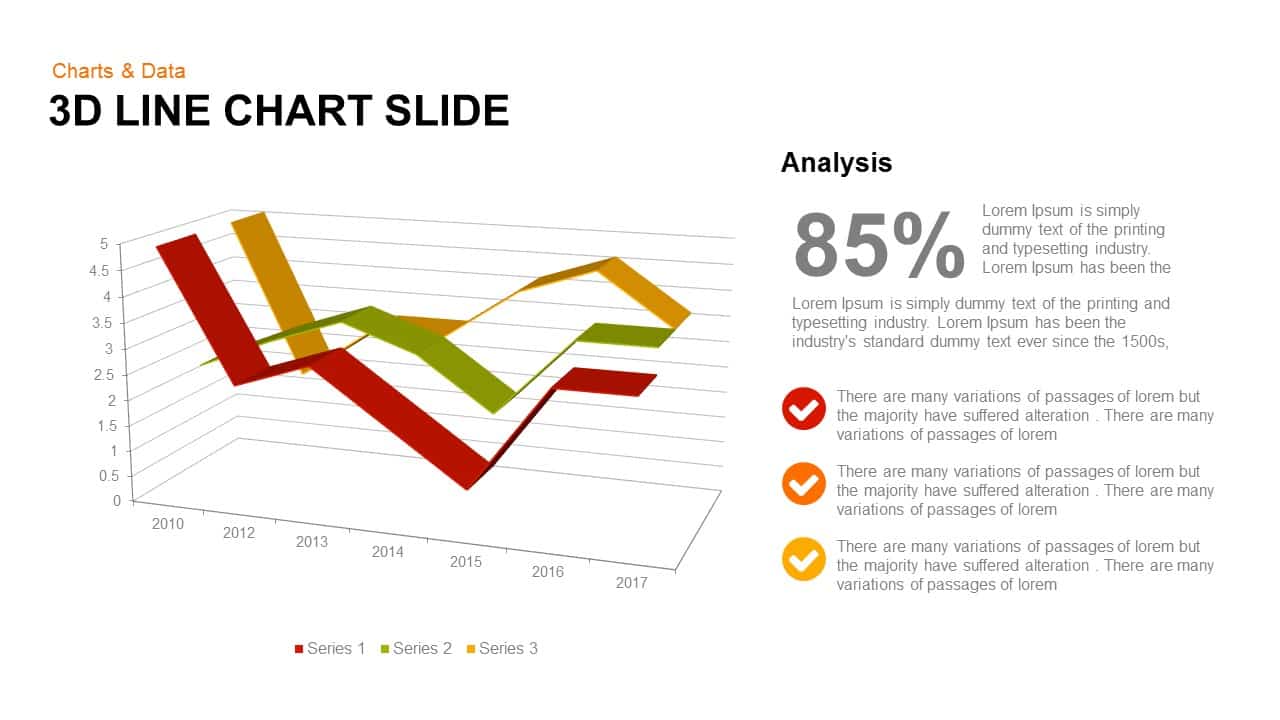
3d Line Chart PowerPoint Template and Keynote Slide
3D Shapes
Premium
-
Curved Line Graph PowerPoint Template and Keynote
Curves and Lines
Premium
-
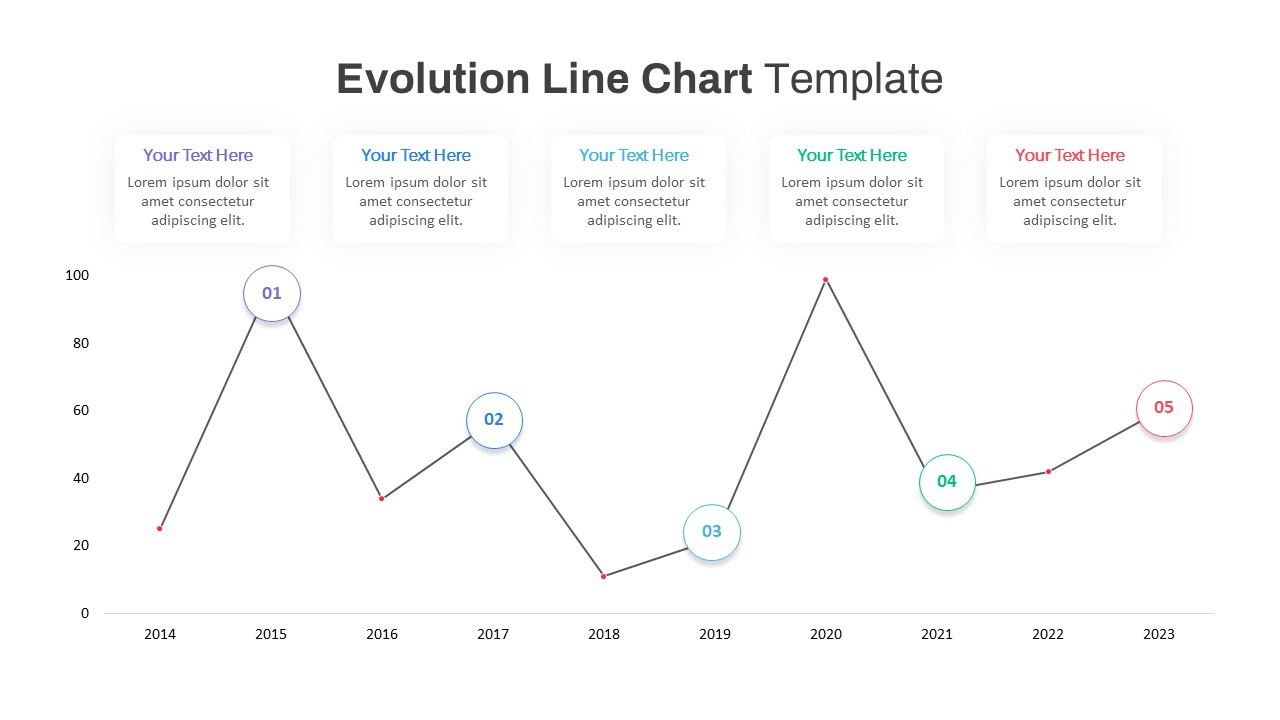
Evolution Line Chart PowerPoint Template
PowerPoint Templates
Premium
-
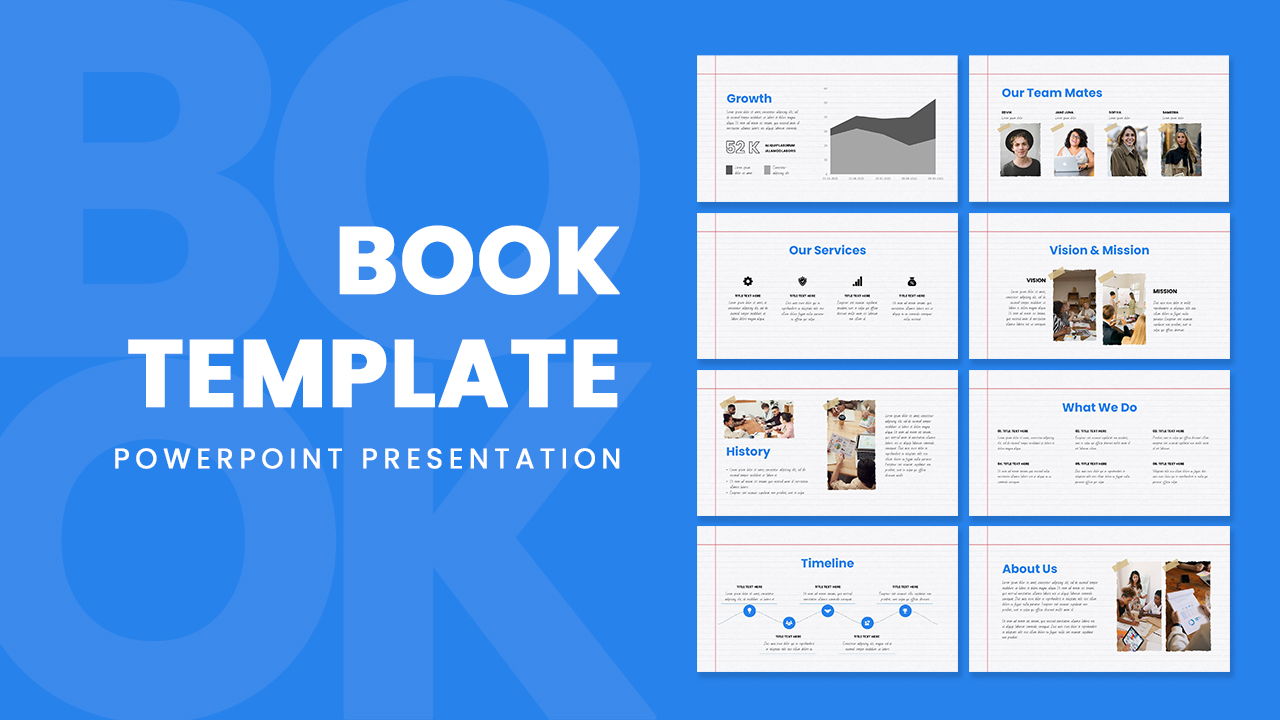
Free PowerPoint Book Template
Free slides
Free
-
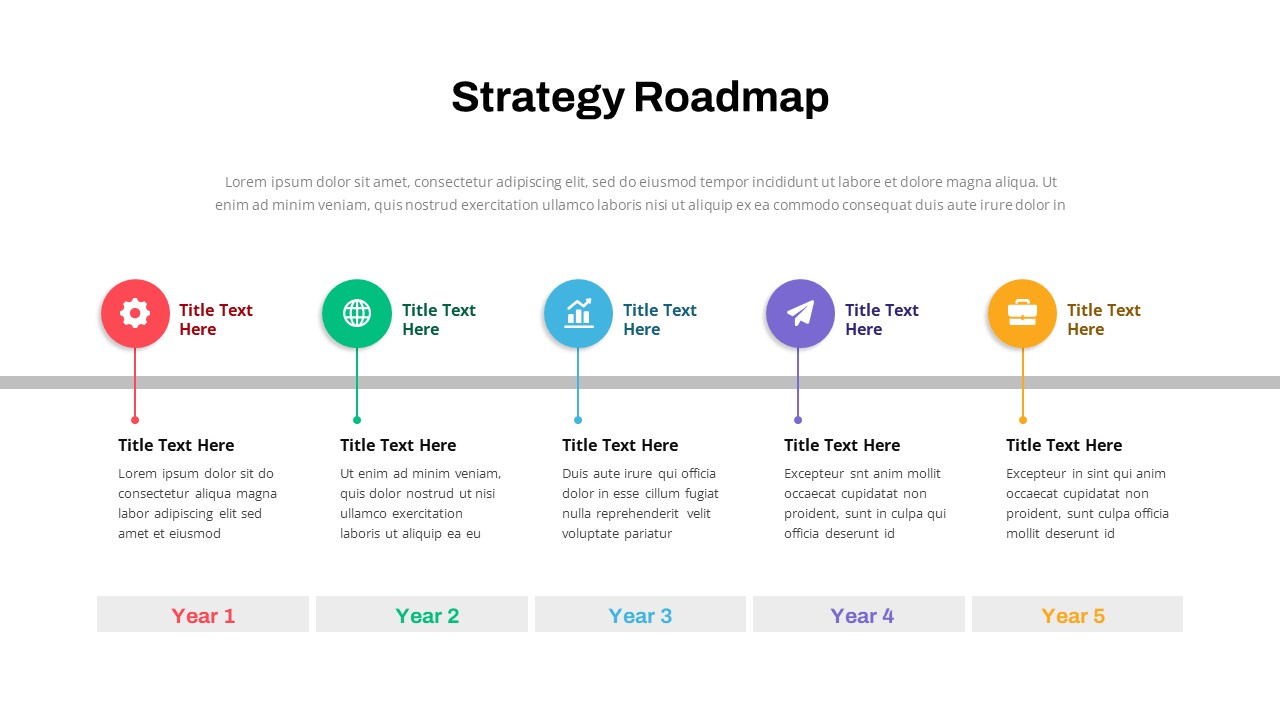
Data Strategy Roadmap PowerPoint Template
PowerPoint Templates
Premium
-
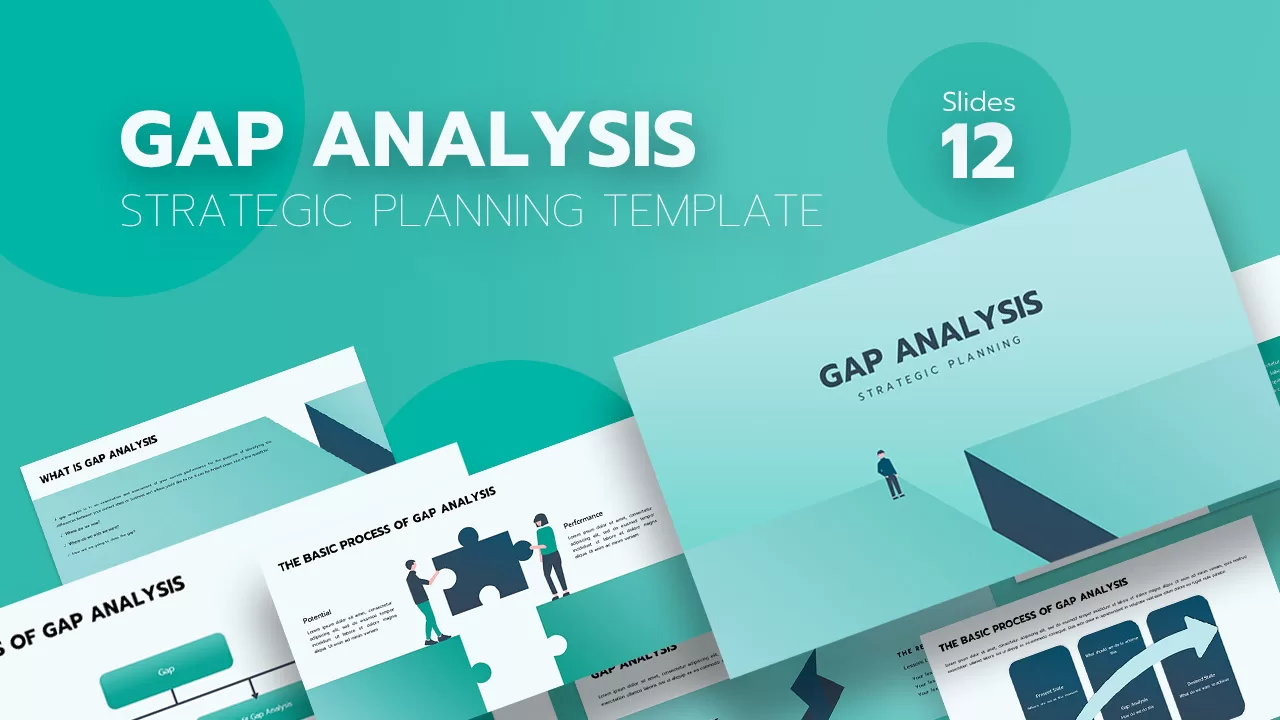
Gap Analysis Strategic Planning Template
PowerPoint Templates
Premium