


Area Chart PowerPoint Template


- Version
- Download 4
- File Size 0.00 KB
- File Count 1
- Create Date June 3, 2024
- Last Updated May 31, 2024
Area Chart PowerPoint Template
Improve data visualization with PowerPoint area chart
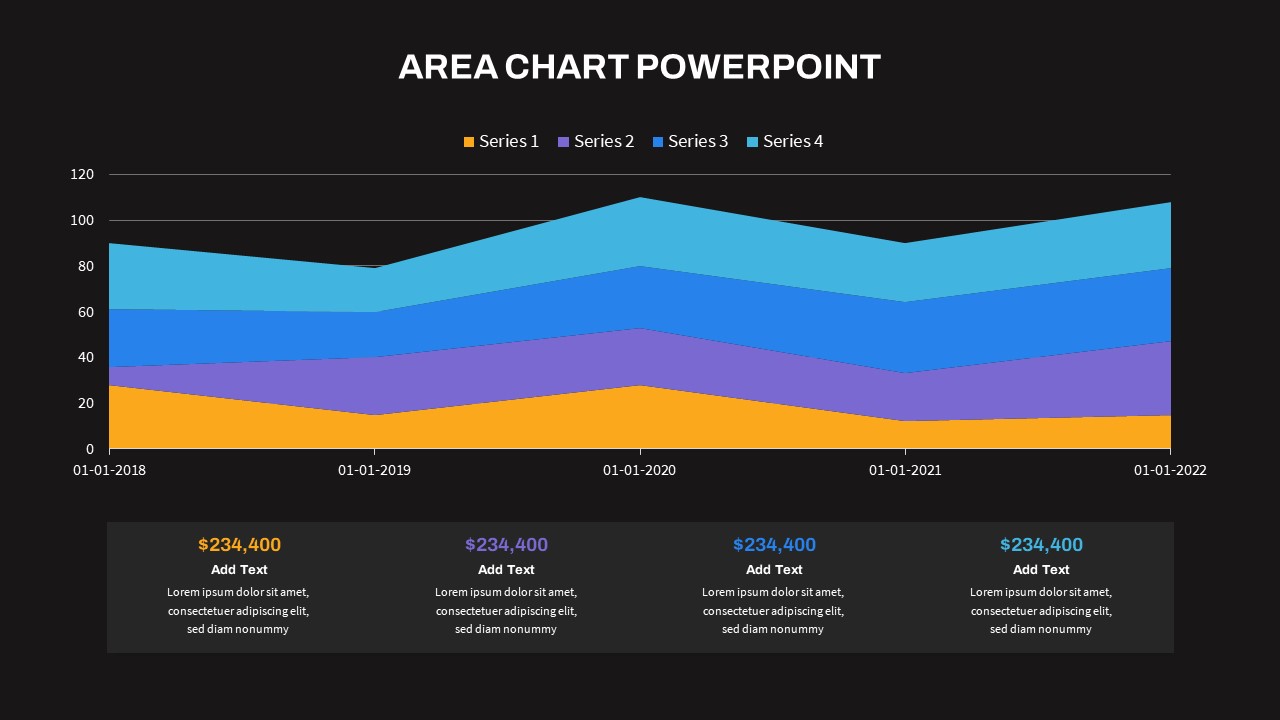
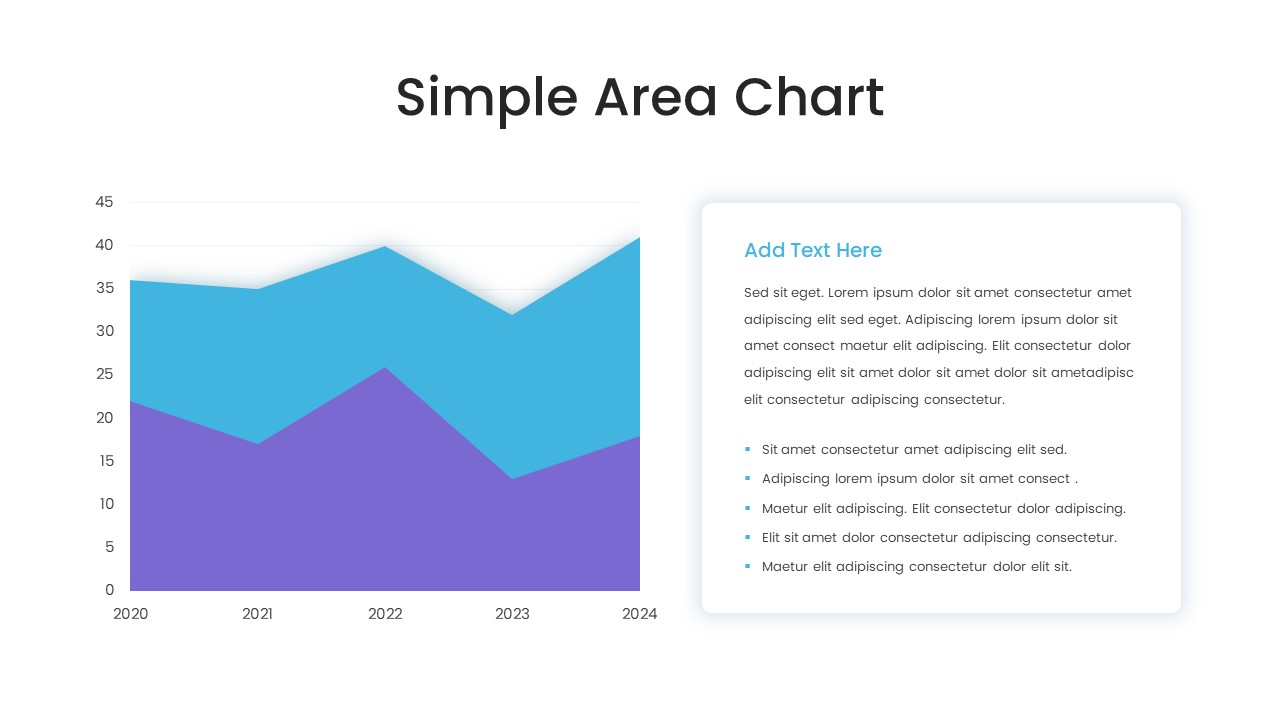
The Area Chart PowerPoint Template offers a visual graphic to present quantitative data, combining appeal with meaningful insights. This chart aids as an effective tool for comparing values across different groups and highlighting overlaps in data. Similar to a line chart, an area chart represents quantitative data over time or categories, distinguishing itself by filling the area beneath the line or curve with color. This feature vividly illustrates cumulative values or proportions within the data. The template features a sleek design with a two-color scheme and clearly labeled X and Y axes, ensuring easy comprehension for viewers.
What is significance of area chart?
Area charts play a significant role in data visualization by providing a visually compelling way to represent quantitative data trends over time or categories. They enable easy comparison of values between different groups and highlight patterns, trends, and fluctuations in the data. By filling the area beneath the line or curve with color, area charts effectively convey cumulative values or proportions, aiding in understanding the overall distribution of data. Area charts are the best when you are presenting data in reports or dashboards.
Area chart template for PowerPoint presentation is a statistical tool ideal for geographical reports. It assembles different areas into one graphic by showing terrain, and other adjacent locations through color differentiation. So, it is easy to read and comprehend. The area chart shows quantitative data and the relationship between two or more items. Our area chart for presentation in PowerPoint is stacked one so it overlaps to show the outcomes in percentages. Hence, it is perfect for creating construction documents, landscaping and architecture. Business reports, sales presentations, academic lectures, and project proposals would be easy when you have a PowerPoint area chart in hand.
The area chart PowerPoint for data visualization has two background variants in dark and light themes. It is a stacked area chart with four lines. Each area has been colored in yellow, violet, blue and light green for easy comprehension of data points. The presenters can show the results in texts at the bottom areas by using PowerPoint edit options. Also, the users can adjust lines, color combinations, and text areas according to their interests. Download the area chart PowerPoint for clarity and precision.
Attached Files
| File |
|---|
| https://premiumdownloads.s3.amazonaws.com/SB04159-Area Chart PowerPoint Template.zip |
Login to download this file
Add to favorites
Add to collection
-

Item ID
SB04159 -

Related Templates
-

Nature PowerPoint Presentation Template
PowerPoint Business Templates
Premium
-

Sales Deck Free PowerPoint Template
PowerPoint Templates
Free
-

Cab Service PowerPoint Template
PowerPoint Templates
Premium
-

Free Vertical PowerPoint Template
PowerPoint Business Templates
Free
-

Research Proposal PowerPoint Template
PowerPoint Templates
Premium
-

Free Nursing Capstone PowerPoint Deck
PowerPoint Templates
Free
-

Free Space Minimal Deck Template
PowerPoint Templates
Free
-

VET Clinic PowerPoint Template
PowerPoint Templates
Premium
-

Gym PowerPoint Template
PowerPoint Templates
Premium
-

Free Physical Education PowerPoint Template Deck
Free PowerPoint Templates
Free
-

Travel Agency PowerPoint Template
PowerPoint Templates
Premium
-

IoT Presentation Template
PowerPoint Templates
Premium
-

Effective Communication PowerPoint Template
PowerPoint Templates
Premium
-

PowerPoint Quiz With Timer
PowerPoint Templates
Premium
-

Free Economics PowerPoint Template
Free PowerPoint Templates
Free
-

Graph Paper PowerPoint Template Deck
PowerPoint Templates
Premium
-

Free Charity PowerPoint Template Deck
PowerPoint Templates
Free
-

Free Cartoon PowerPoint Template
Free PowerPoint Templates
Free
-

Free Army PowerPoint Template
PowerPoint Templates
Free
-

Free Aviation PowerPoint Template
Free PowerPoint Templates
Free
-

Macroeconomics PowerPoint Template
PowerPoint Templates
Premium
-

Free Real Estate Listing PowerPoint Template
Free PowerPoint Templates
Free
-

Customer Experience Loyalty PowerPoint Deck Template
PowerPoint Templates
Premium
-

Animated Agriculture PowerPoint Deck Template
PowerPoint Templates
Premium
-

Free University Presentation PowerPoint Template
PowerPoint Templates
Free
-
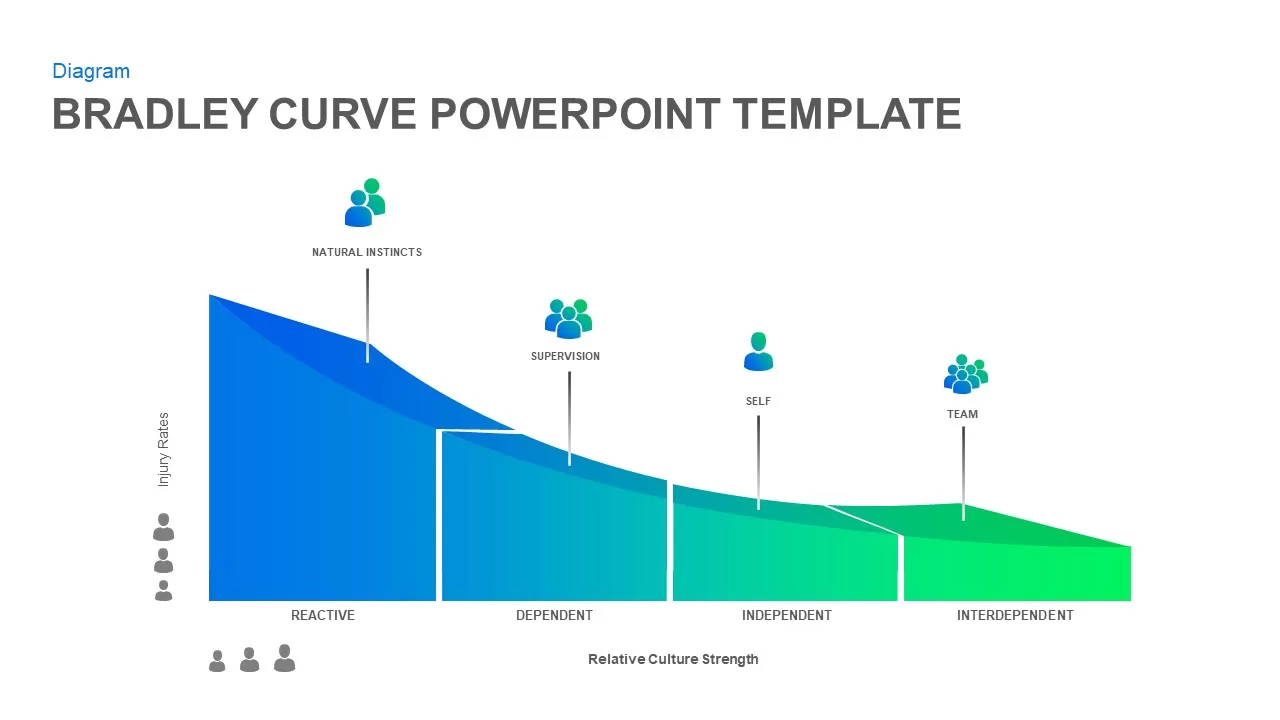
Bradley Curve PowerPoint Template
PowerPoint Charts
Premium
-

Free Event Planning PowerPoint Template
Free PowerPoint Templates
Free
-

Free Book Review PowerPoint Template
Free PowerPoint Templates
Free
-
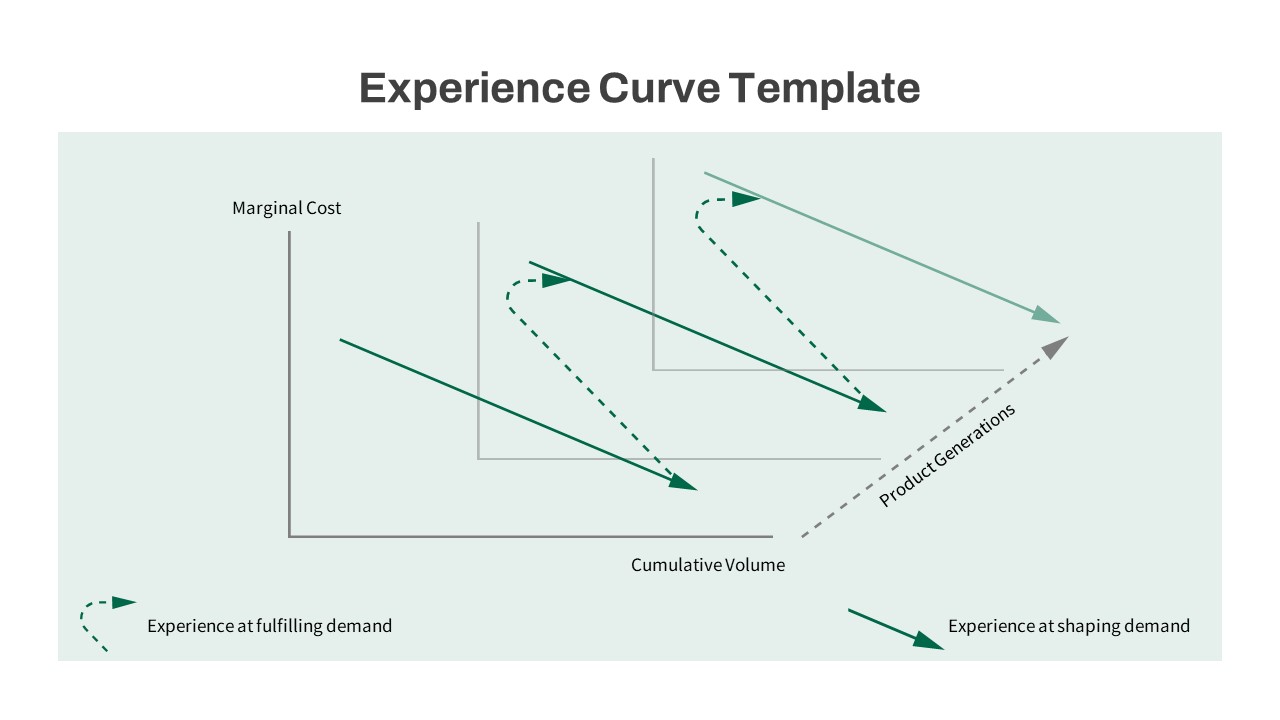
Experience Curve PowerPoint Template
Keynote Templates
Premium
-
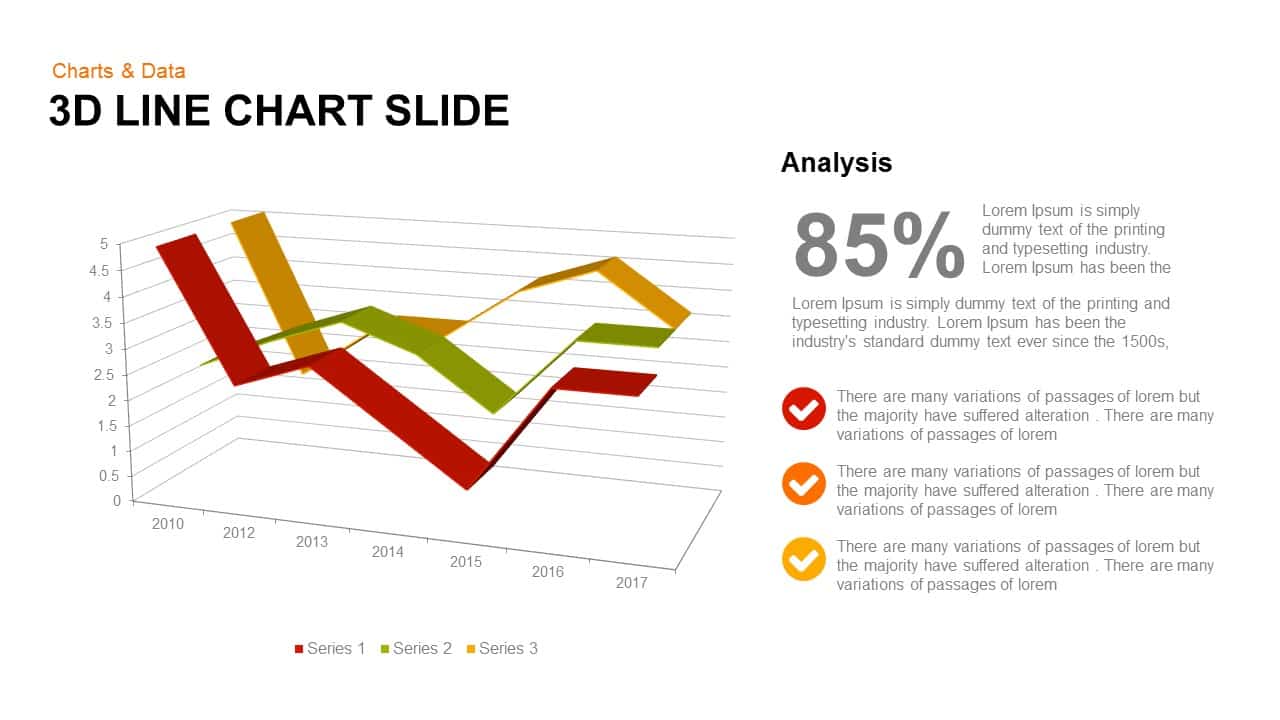
3d Line Chart PowerPoint Template and Keynote Slide
3D Shapes
Premium
-
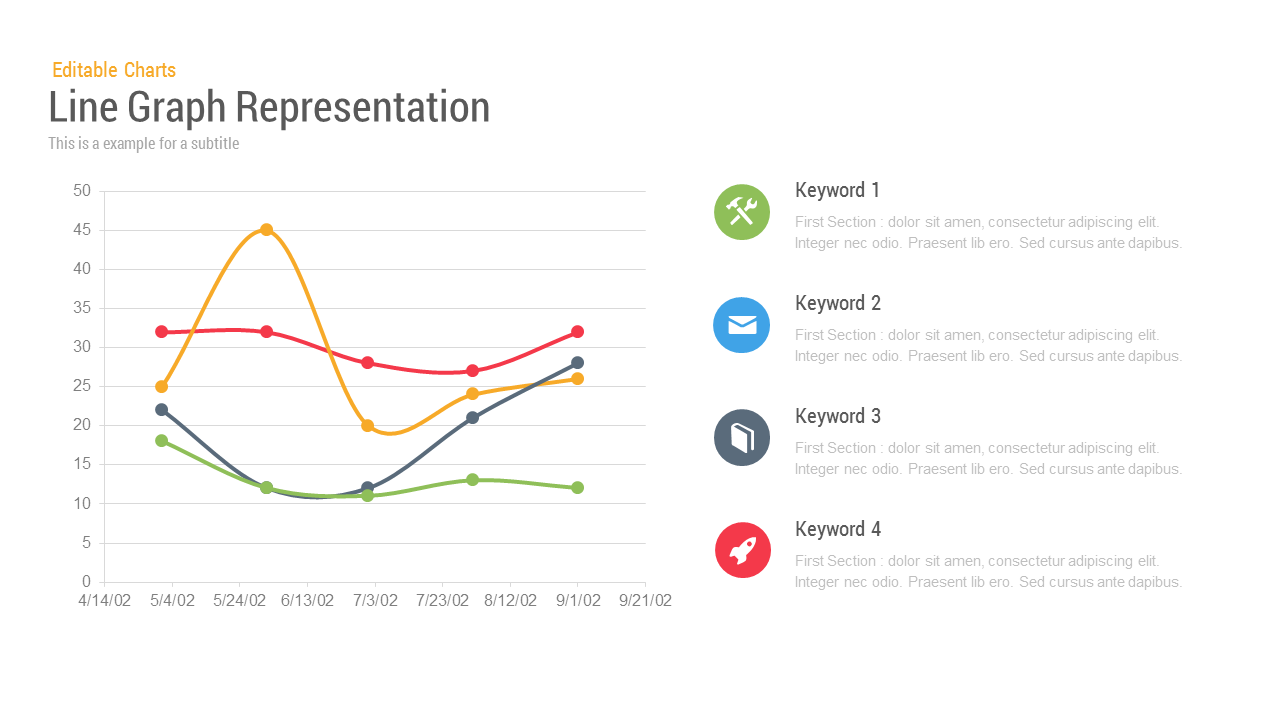
Line Chart Representation PowerPoint Templates and Keynote Slides
PowerPoint Charts
Premium
-

EFQM Model PowerPoint Template
PowerPoint Templates
Premium
-

Data Science PowerPoint Template
PowerPoint Templates
Premium
-
PowerPoint Area Chart Template
PowerPoint Charts
Premium
-

Annual Report PowerPoint Template and Keynote
PowerPoint Templates
Premium
-
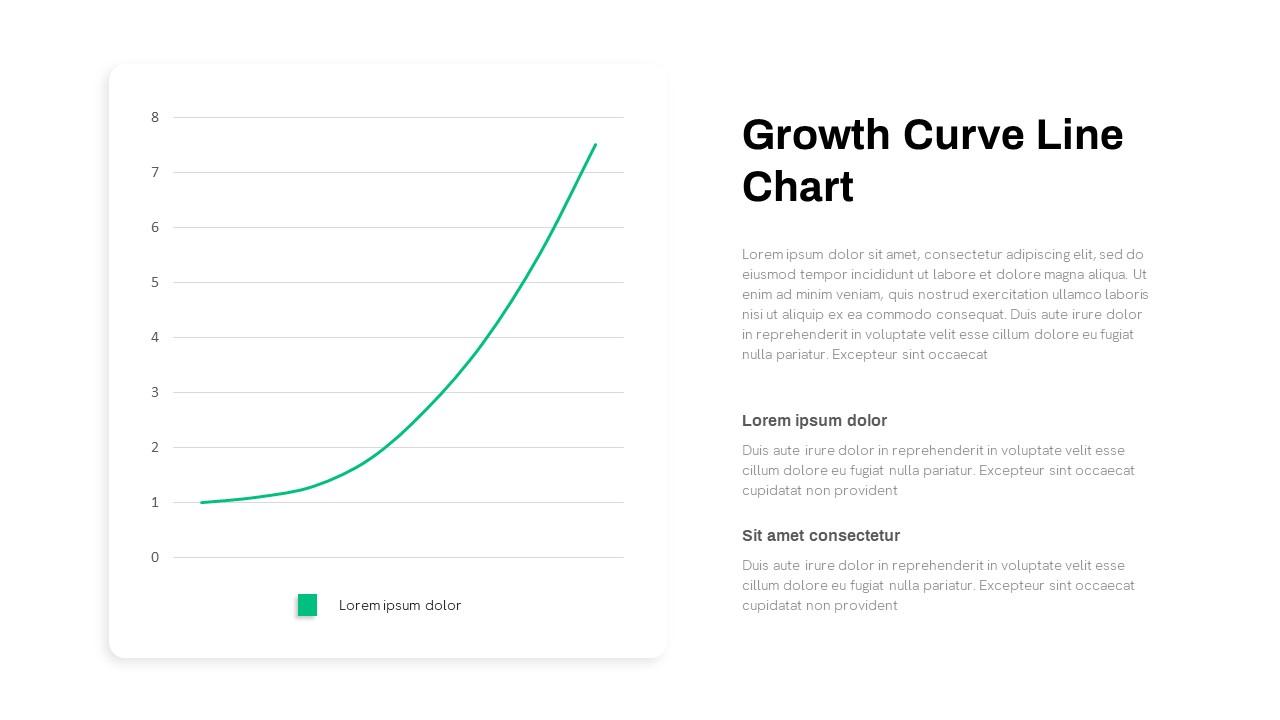
Growth Curve Line Chart PowerPoint Template
Curves and Lines
Premium
-
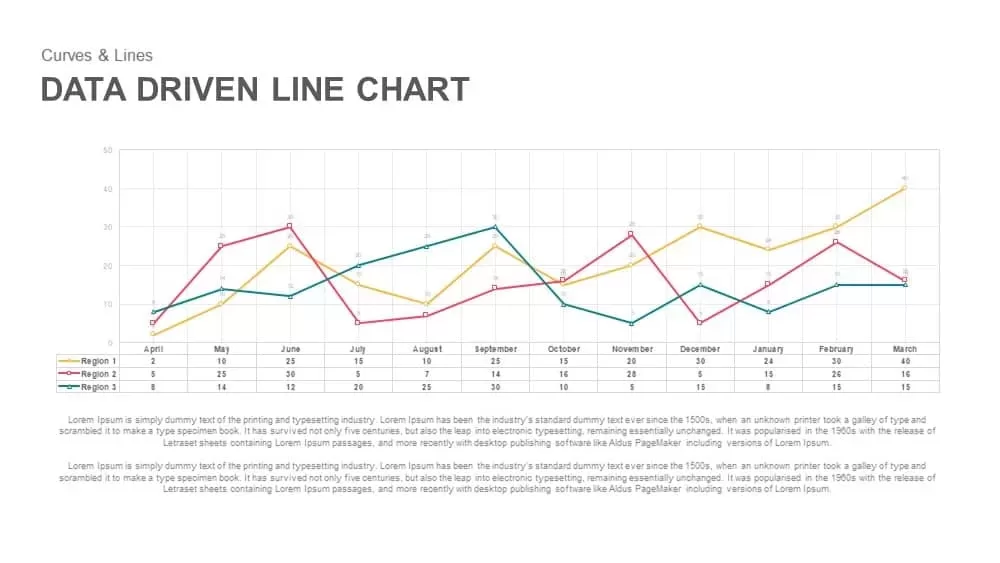
Data Driven Line Chart Template for PowerPoint & Keynote
Curves and Lines
Premium
-
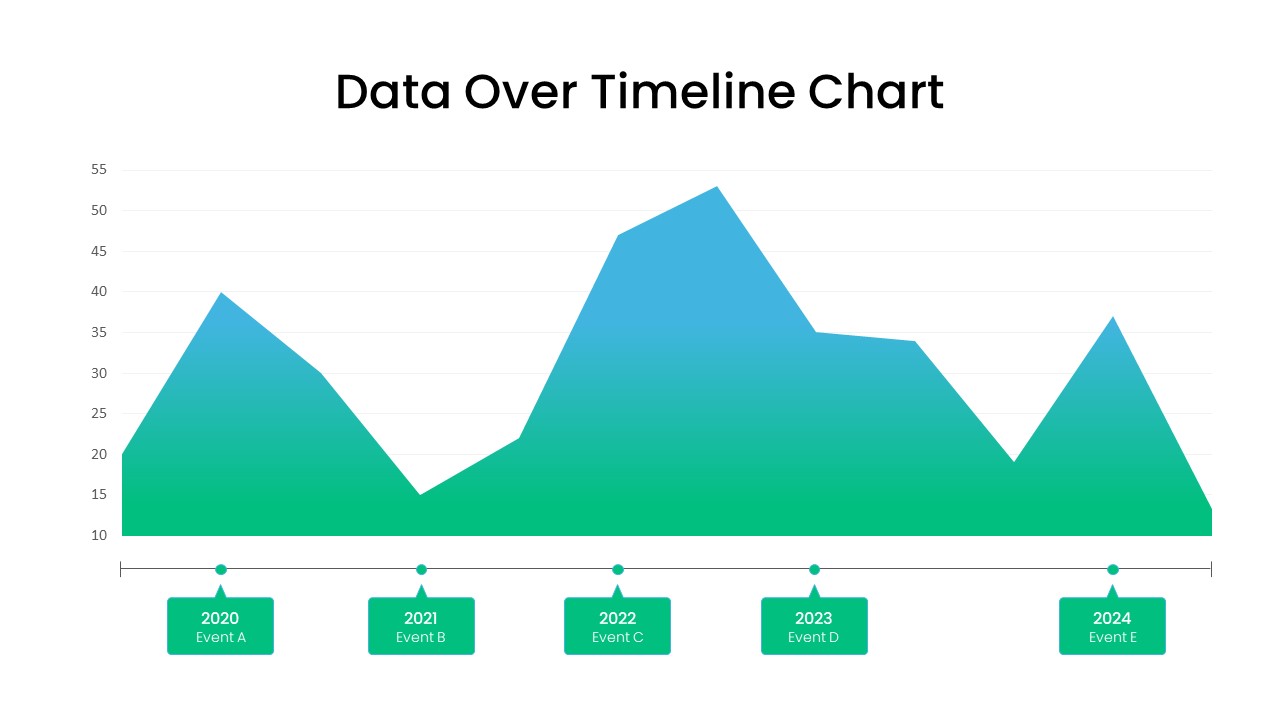
Data Over Time Line Chart PowerPoint Template
PowerPoint Charts
Premium
-

Global Warming Infographic PowerPoint Template Deck
PowerPoint Templates
Premium
-
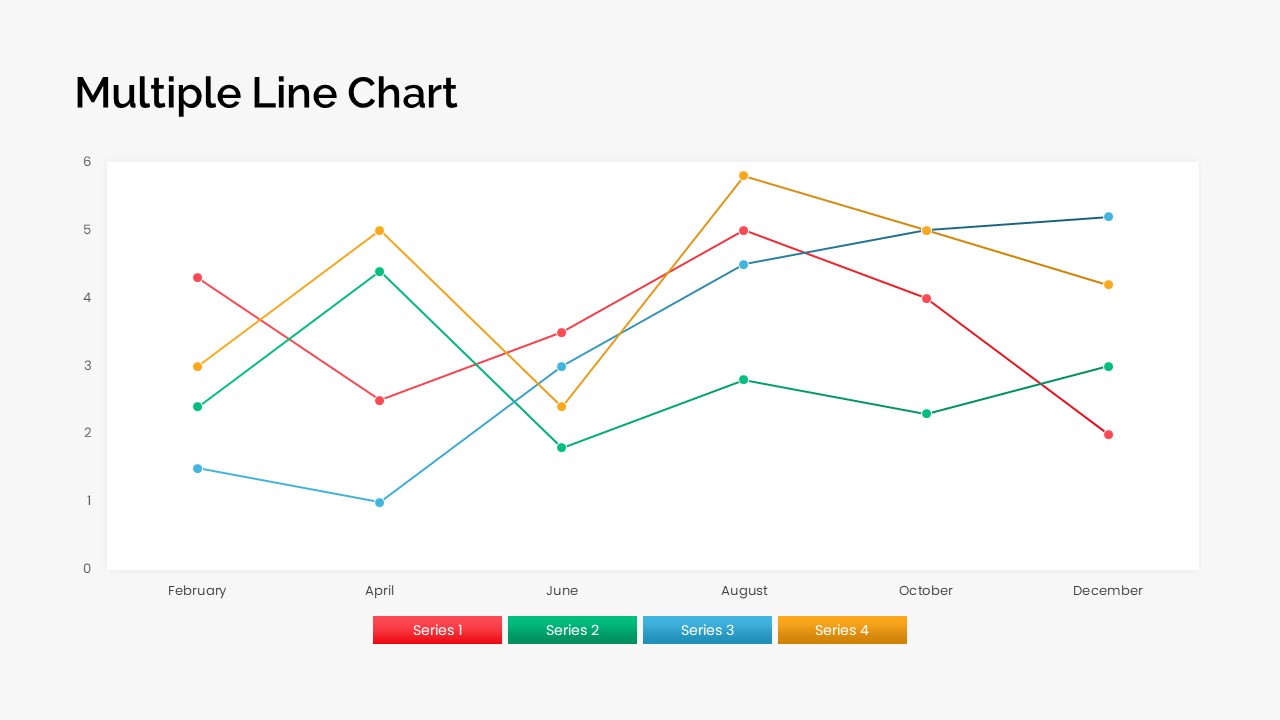
Multiple Line Chart PowerPoint Template
PowerPoint Charts
Premium
-

Free Dunder Mifflin Paper Company Pitch Deck
Free PowerPoint Templates
Free
-

Free Charts and Graphs PowerPoint Template
PowerPoint Templates
Free
-

Real Estate PowerPoint Theme
PowerPoint Themes
Premium
-
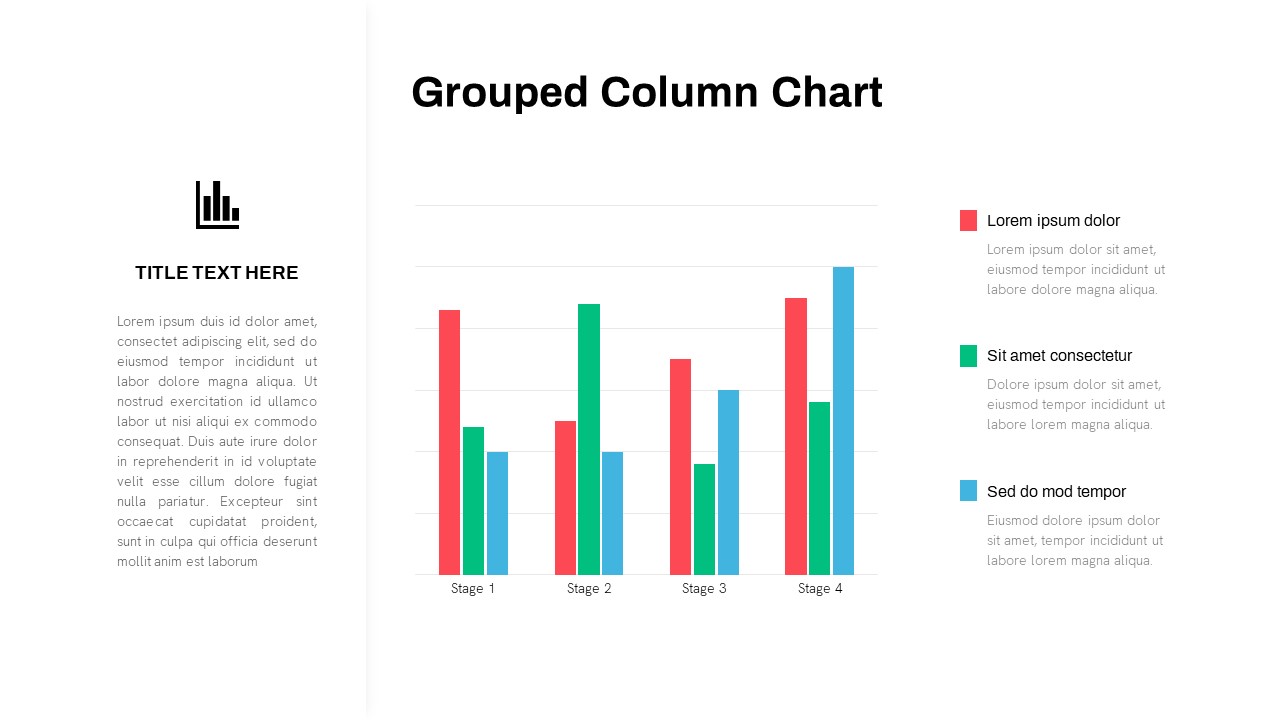
Grouped Column Chart PowerPoint Template
Column and Bar chart
Premium
-
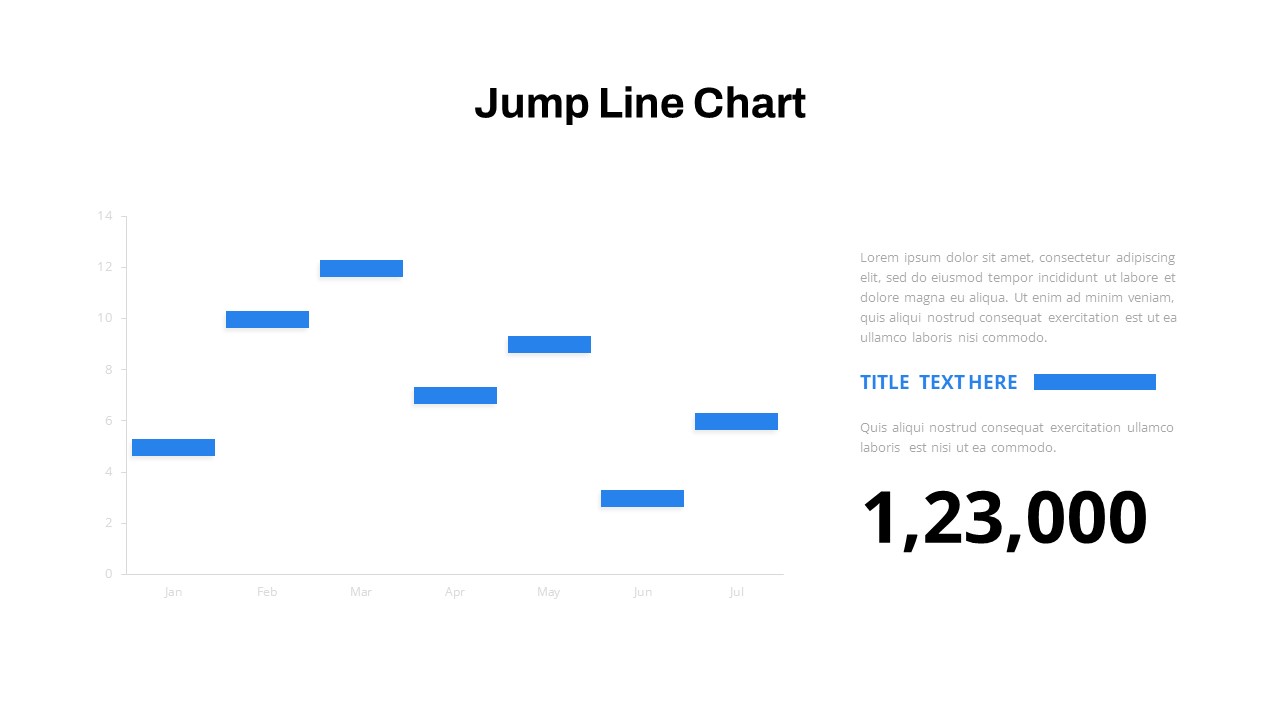
Jump Line Chart PowerPoint Template
Column and Bar chart
Premium
-

Combination Chart PowerPoint Template
PowerPoint Charts
Premium
-
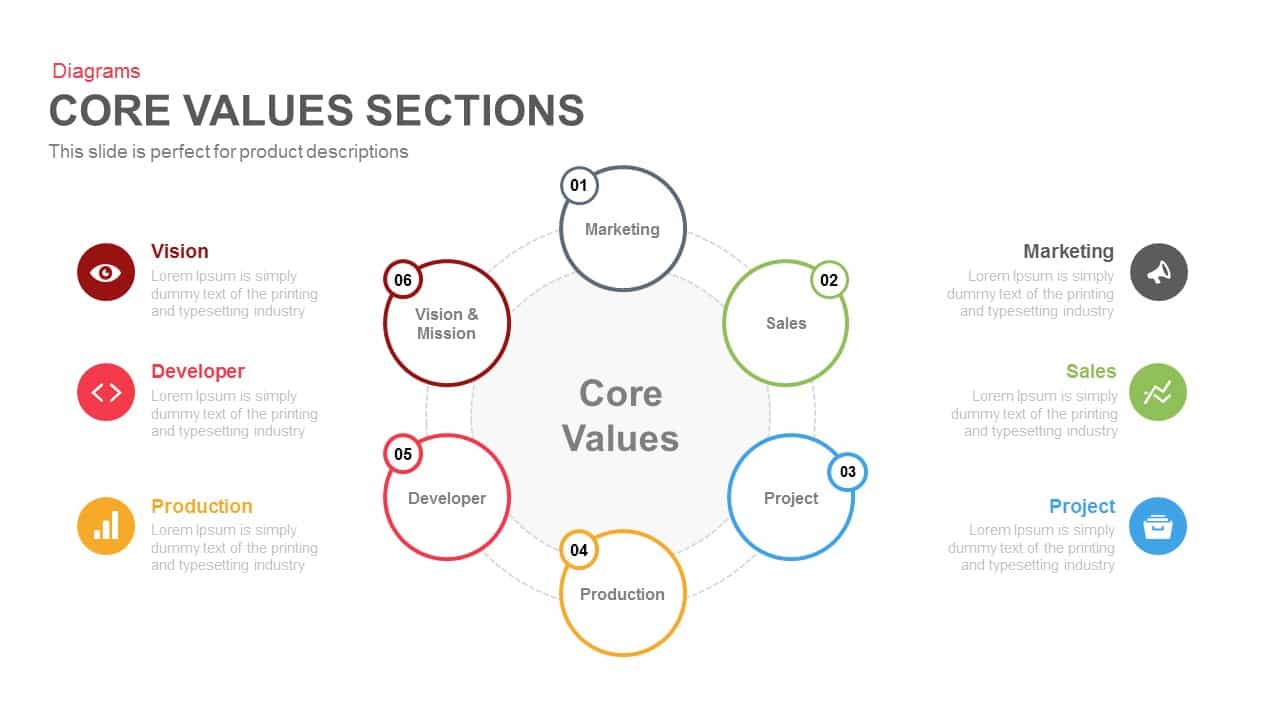
Core Values Sections PowerPoint Template and Keynote
Business Models
Premium
-
Free Charts & Graphs Deck PowerPoint Template
PowerPoint Templates
Free
-
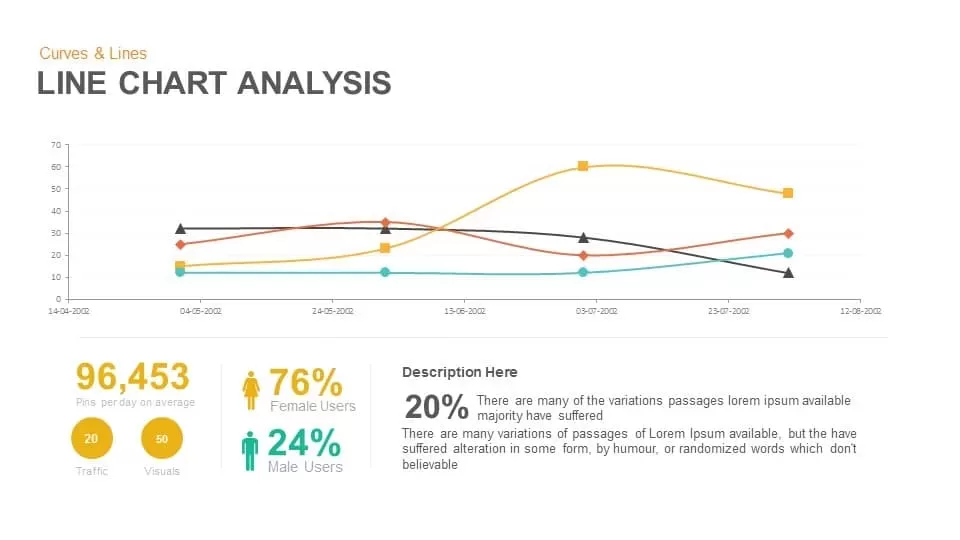
Line Chart Analysis PowerPoint Template and Keynote Slide
Curves and Lines
Premium
-
Bell Curve PowerPoint Template
PowerPoint Templates
Premium
-
Arrow Line Chart PowerPoint Template
Arrow Diagrams
Premium
-
Evolution Line Chart PowerPoint Template
PowerPoint Templates
Premium
-

Stakeholder Register PowerPoint Template
PowerPoint Templates
Premium
-

Free AI Artificial Intelligence PowerPoint Template
PowerPoint Templates
Free
-
Spline Chart PowerPoint Template
PowerPoint Charts
Premium
-
Progress Chart PowerPoint Template
PowerPoint Templates
Premium
-

Clustered Column Chart PowerPoint Template
PowerPoint Charts
Premium
-
Sun Burst Chart PowerPoint Template
Circular Diagrams
Premium
-

Business Process Reengineering Template
PowerPoint Templates
Premium
-
Curved Line Graph PowerPoint Template and Keynote
Curves and Lines
Premium
-
Cylinder Bar Chart PowerPoint Template and Keynote Slide
Column and Bar chart
Premium
-
Clustered Bar Chart PowerPoint Template
Column and Bar chart
Premium
-

Mekko Chart Template
PowerPoint Templates
Premium
-

Animated Upcoming Event Poster PowerPoint Template
PowerPoint Templates
Premium
-

Proportional Area Chart PowerPoint Template
PowerPoint Templates
Premium
-
Curved Line Graph PowerPoint Template and Keynote Slide
Curves and Lines
Premium
-
Peak Line Chart PowerPoint Template
PowerPoint Charts
Premium
-
Pie Chart PowerPoint Template
Infographic
Premium
-

Creative Bar Chart Data Analysis PowerPoint Template and Keynote
Infographic
Premium
-

Open Door Policy PowerPoint Template
PowerPoint Templates
Premium
-
Snake Shaped Curve Diagram
Shapes
Premium
-

Pencil Bar Chart PowerPoint Template and Keynote Slide
Column and Bar chart
Premium
-

Biotechnology PowerPoint Presentation Template
PowerPoint Templates
Premium
-
S Curve PowerPoint Template
Curves and Lines
Premium
-
Waterfall Bar Chart PowerPoint Template
PowerPoint Charts
Premium
-
4 Step Core Values PowerPoint Template
Business Models
Premium
-
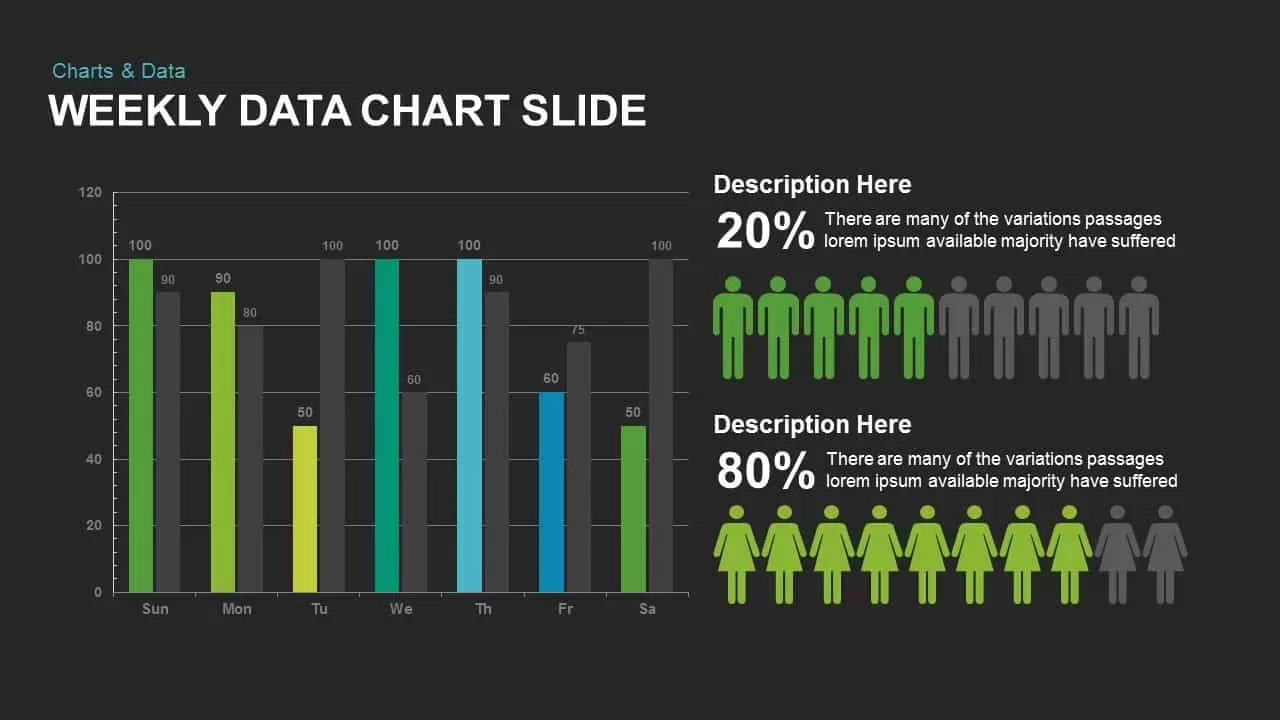
Weekly Data Charts PowerPoint Presentation Template and Keynote Slide
Infographic
Premium
-
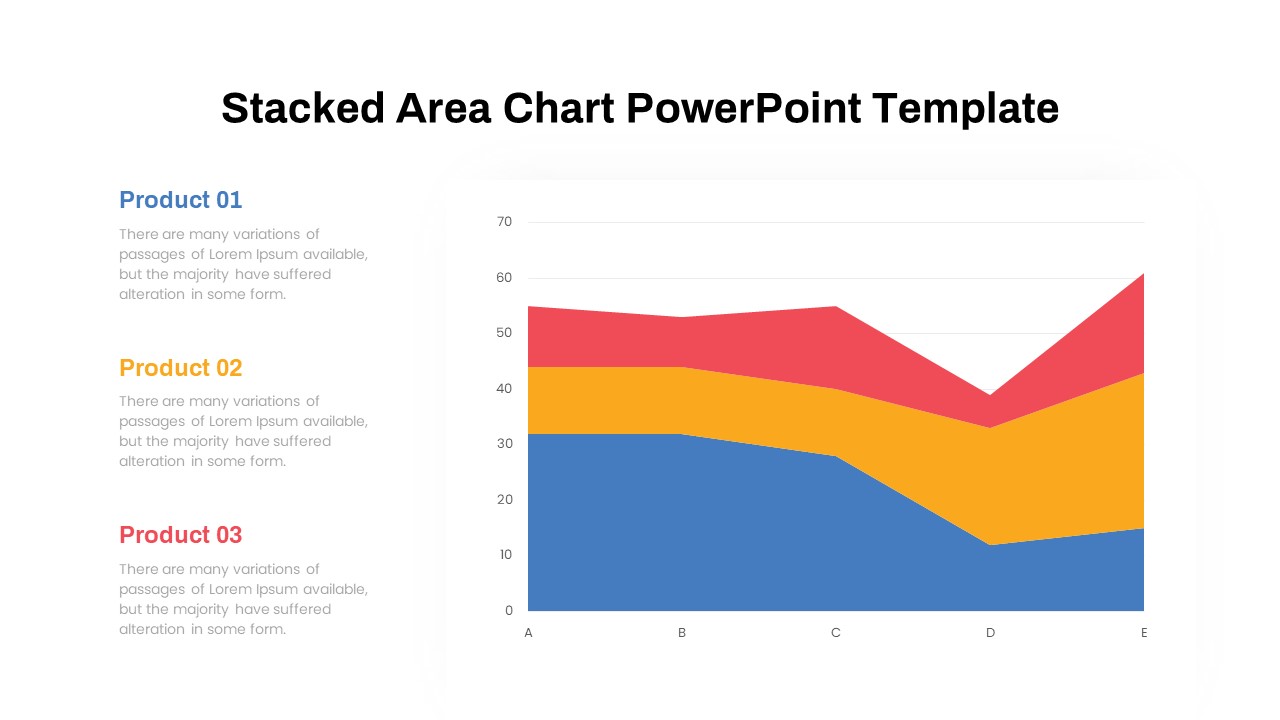
Stacked Area Chart PowerPoint Template
PowerPoint Charts
Premium
-

Radial Bar Chart PowerPoint Templates and Keynote Slides
PowerPoint Charts
Premium
-
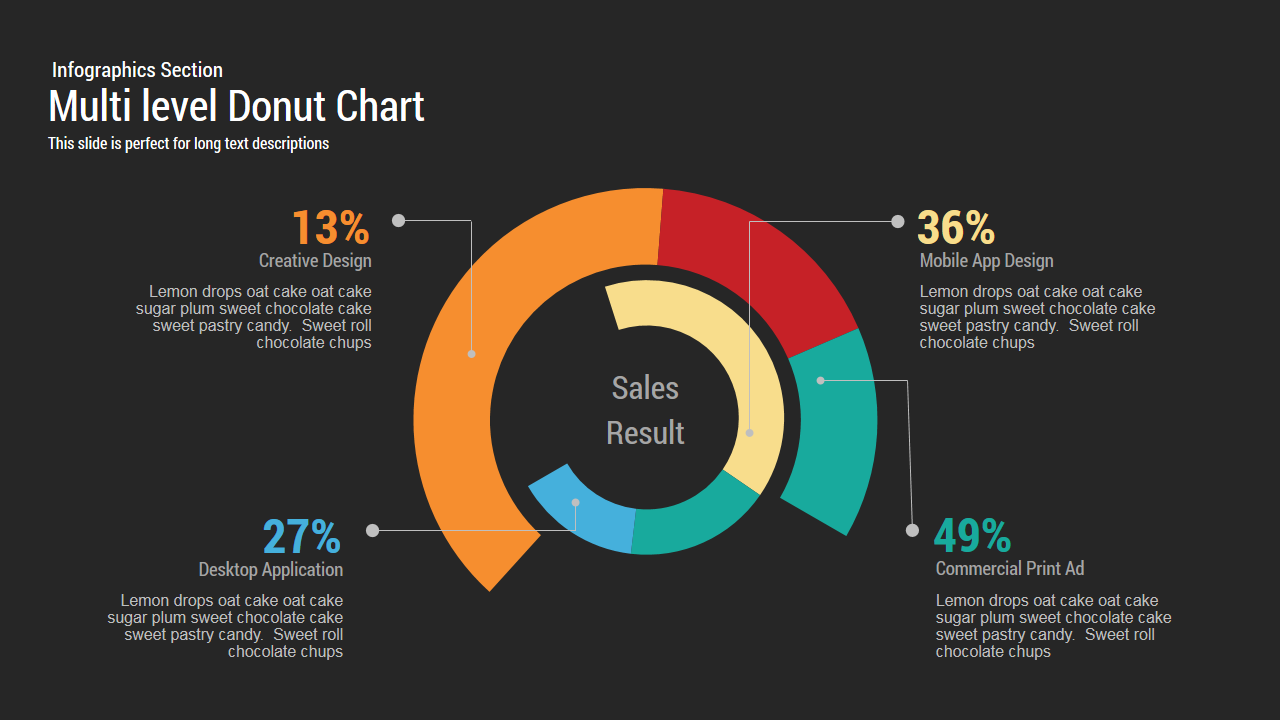
Multi level Donut Chart Template for PowerPoint and Keynote
PowerPoint Charts
Premium
-
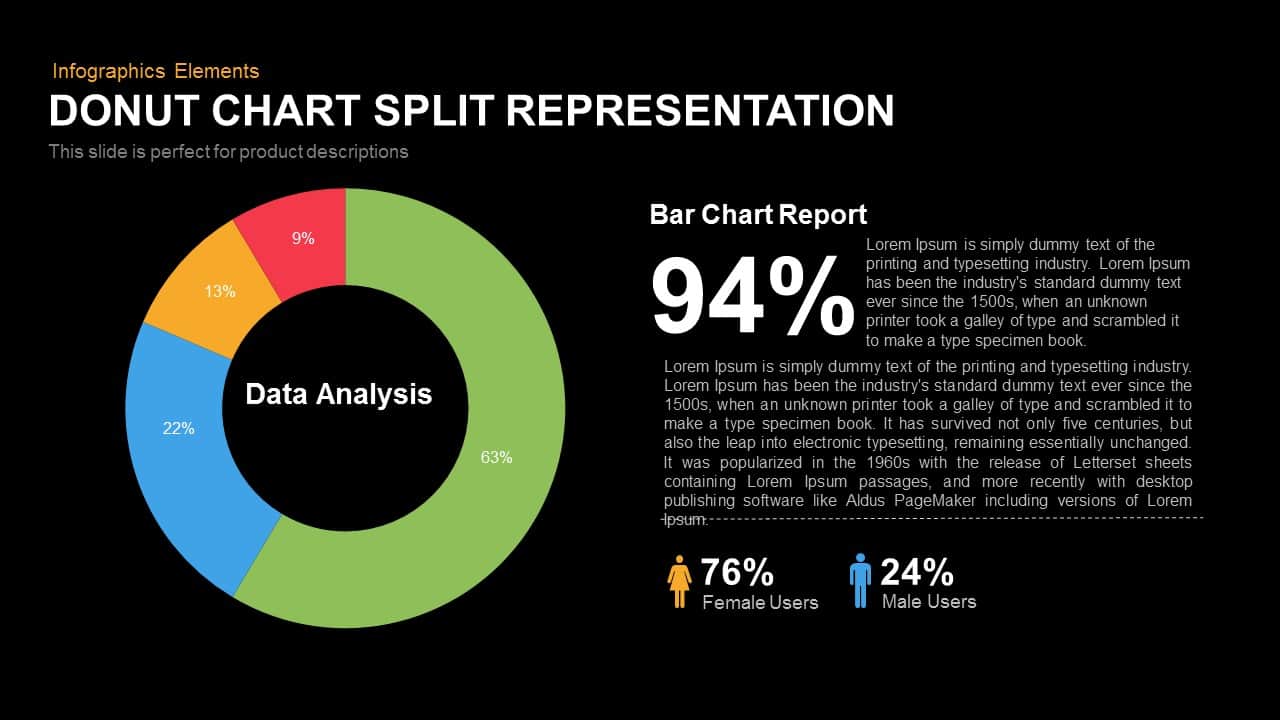
Split Representation Donut Chart Template for PowerPoint and Keynote
Keynote Templates
Premium
-
Free Big Data PowerPoint Template
PowerPoint Templates
Free
-
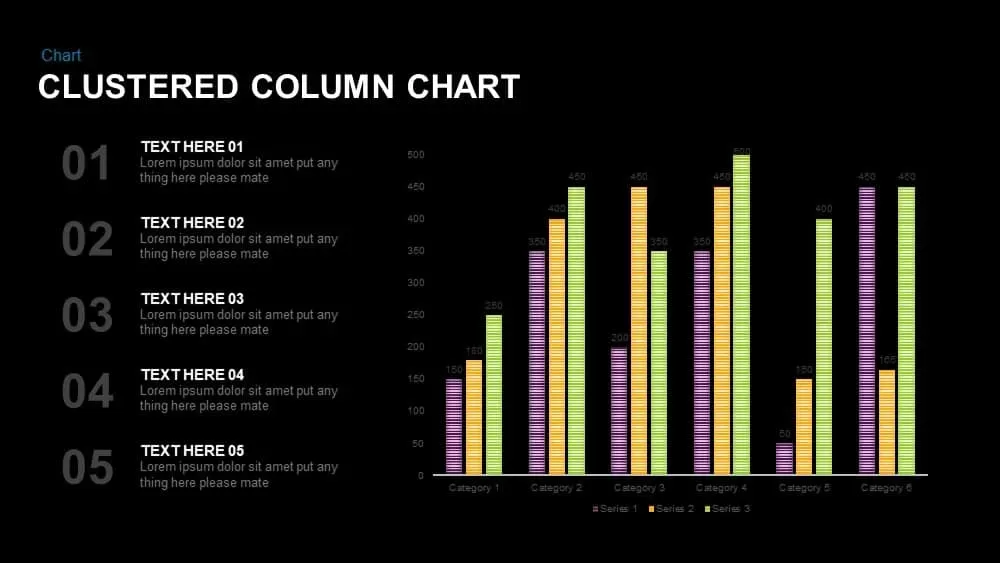
Clustered Column Chart PowerPoint and Keynote Slide
PowerPoint Charts
Premium
-
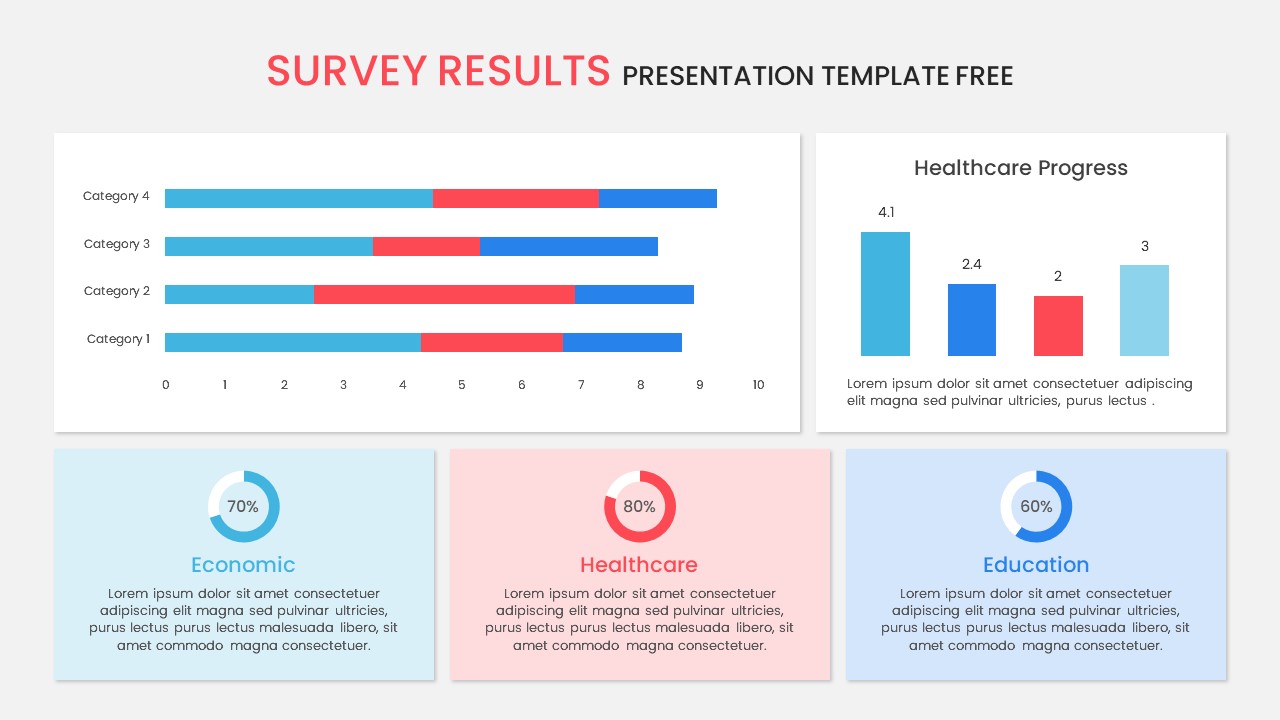
Survey Results PowerPoint Template Free
Free PowerPoint Templates
Free
-
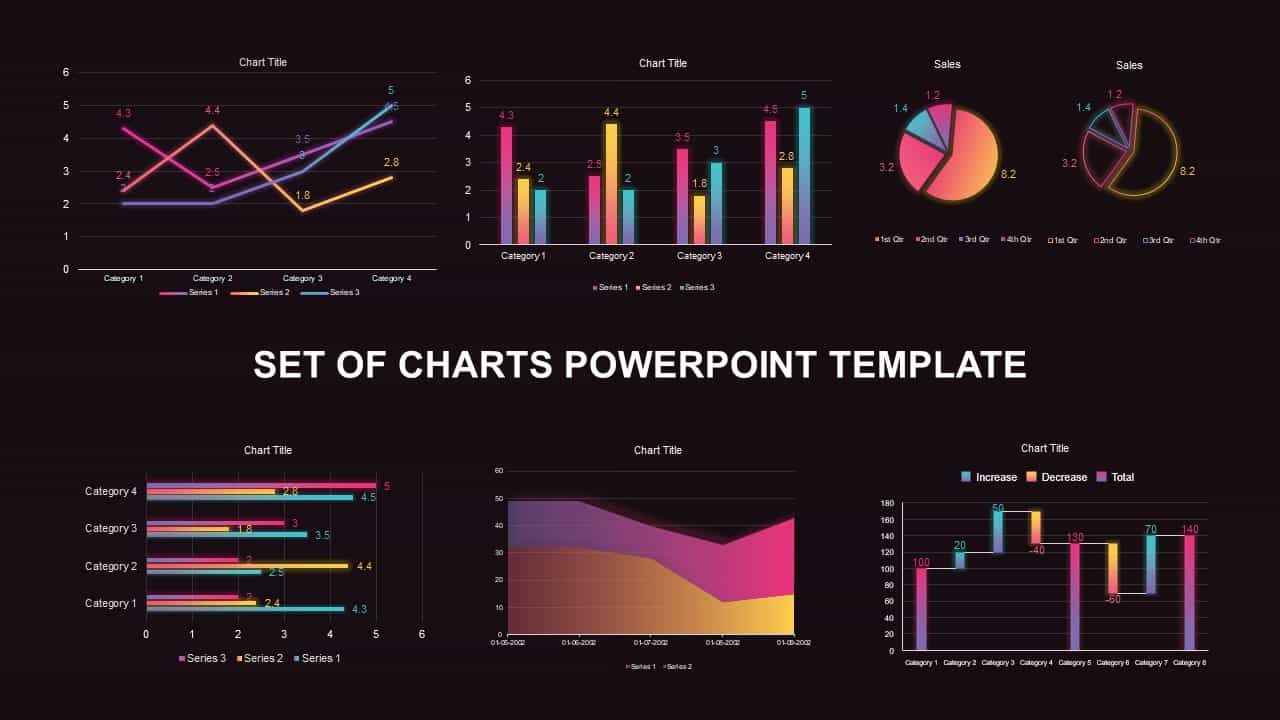
Set of Chart PowerPoint Template and Keynote Diagram
PowerPoint Charts
Premium
-
Waterfall Column Chart PowerPoint Template
Column and Bar chart
Premium
-
Four Quadrant Scatter Chart PowerPoint Template
PowerPoint Charts
Premium
-
Free 3d Pie Chart PowerPoint Template & Keynote slide
Pie & Donut
Free
-
Line Chart PowerPoint Template
PowerPoint Charts
Premium
-
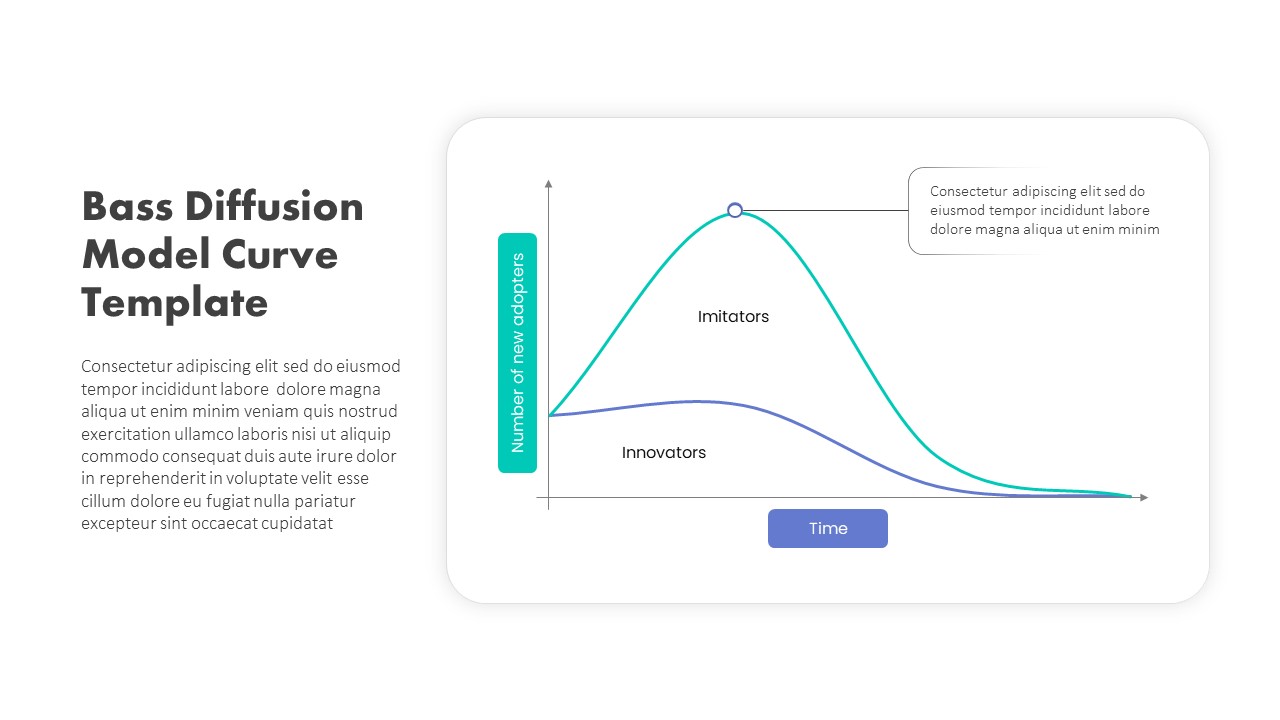
Bass Diffusion Model Chart PowerPoint Slide Template
PowerPoint Templates
Premium
-

Power Analogy Metaphor PowerPoint Template
Metaphor, Simile & Analogy
Premium
-
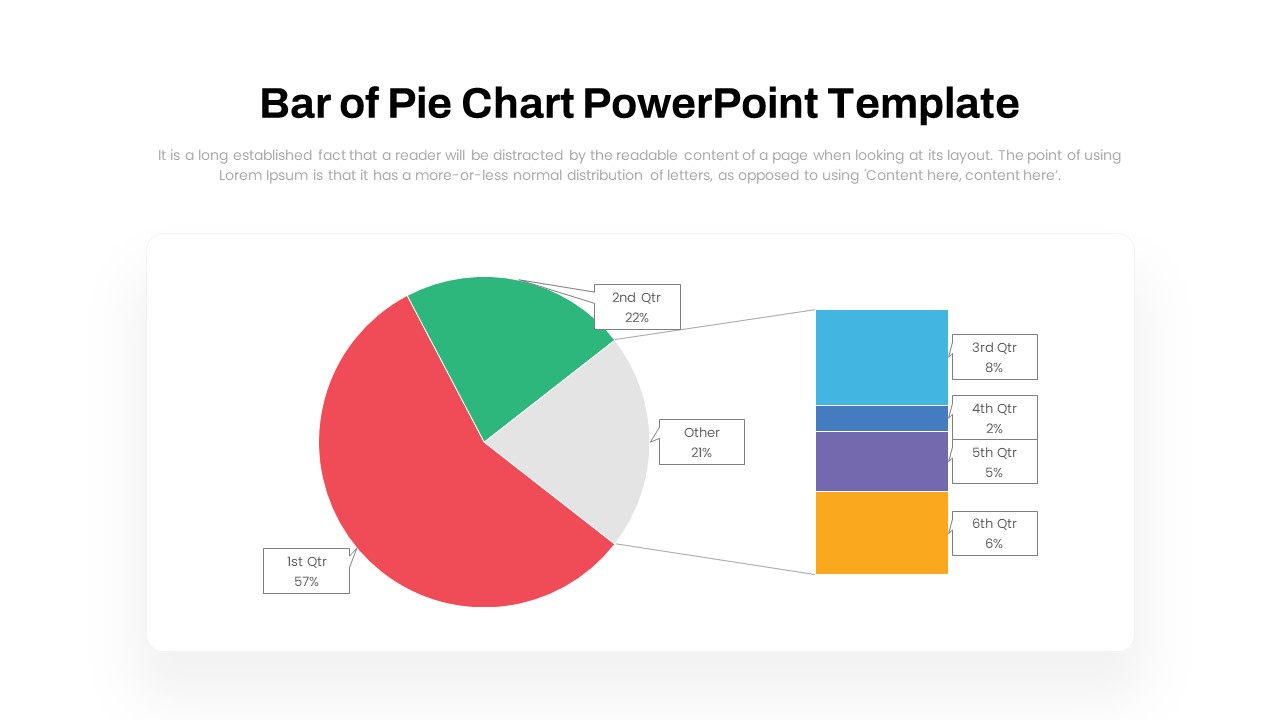
Bar of Pie Chart PowerPoint Template
PowerPoint Templates
Premium
-
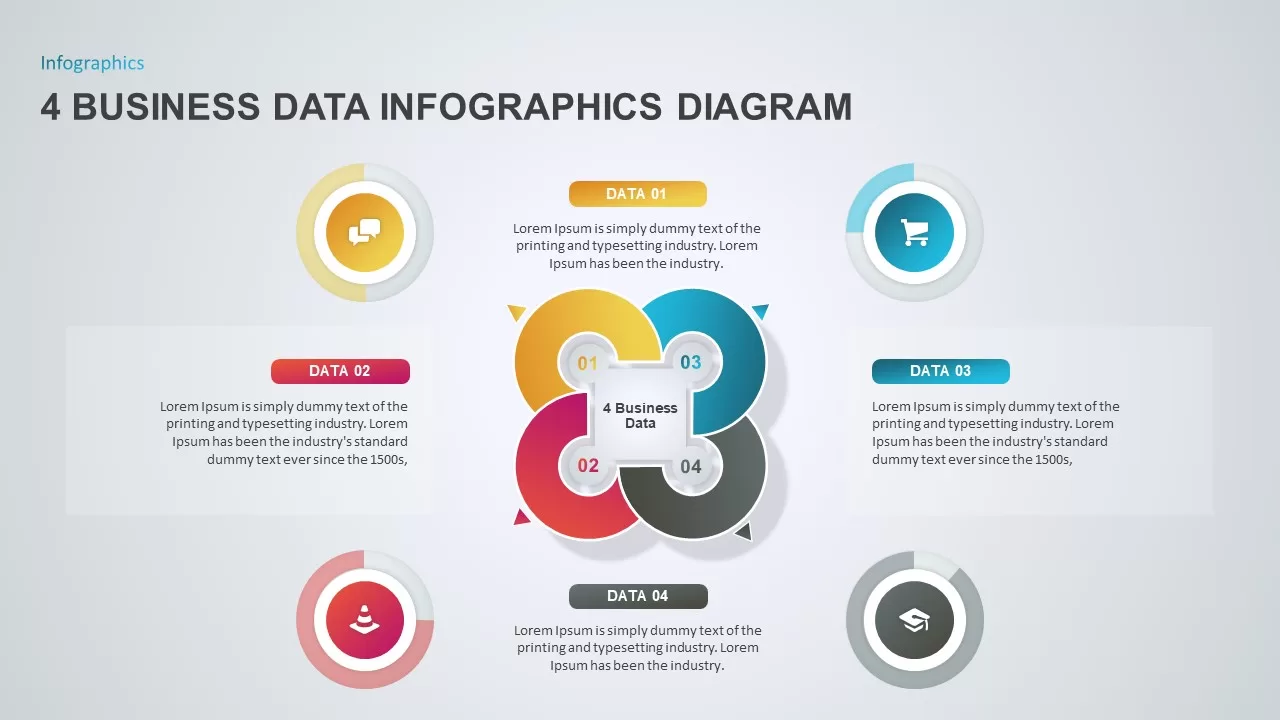
4 Section PowerPoint for Business Data Presentation
Infographic
Premium
-

Animated Clustered Bar Chart PowerPoint Template
PowerPoint Charts
Premium
-
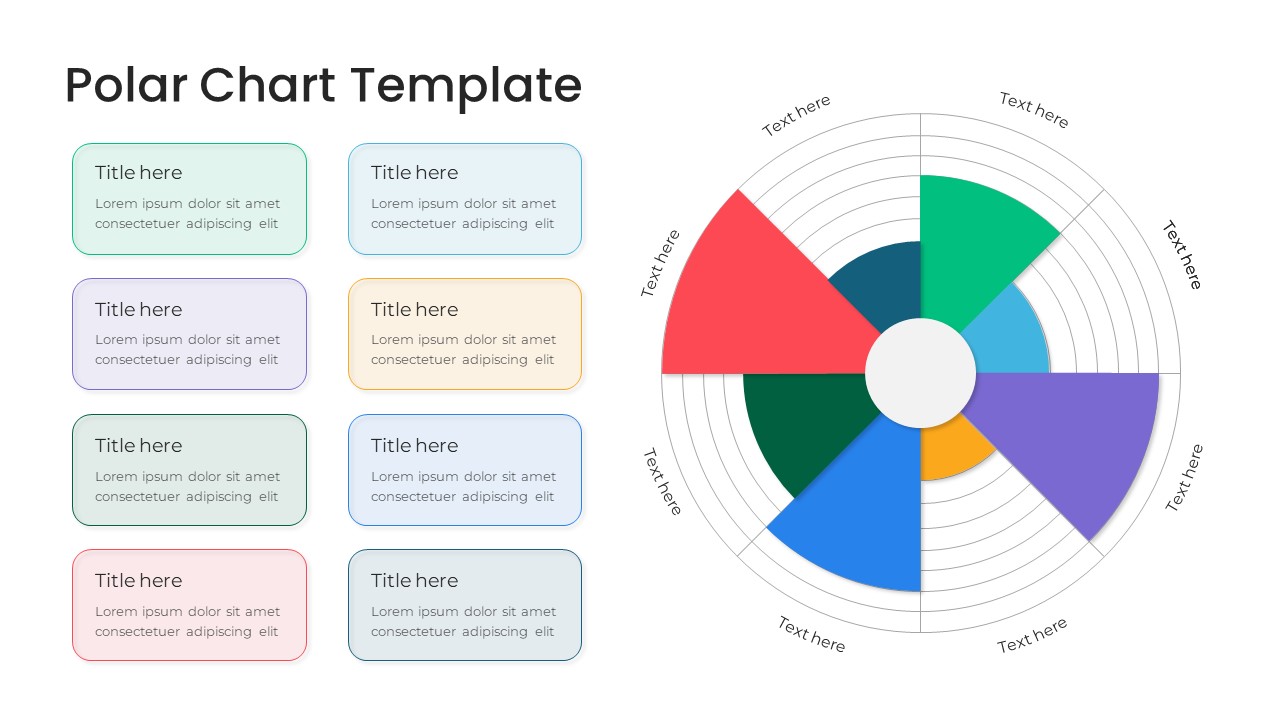
Polar Chart PowerPoint Template
PowerPoint Templates
Premium
-
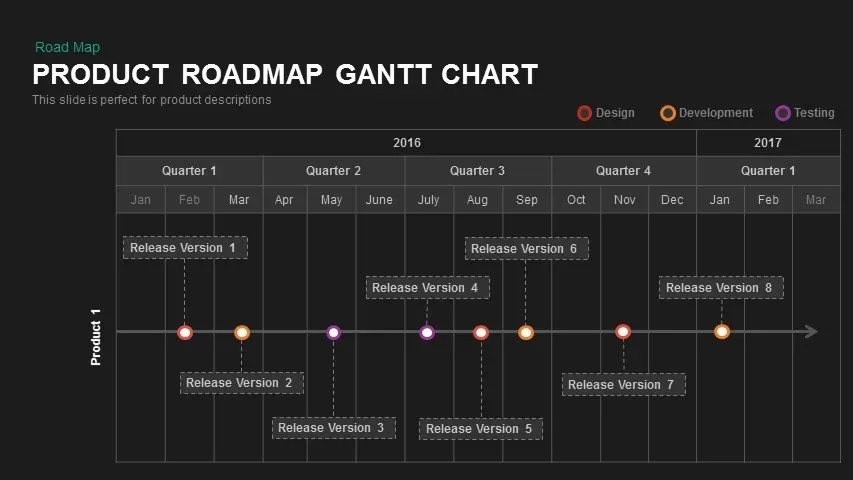
Product Roadmap Gantt Chart PowerPoint Template and Keynote
Business Models
Premium
-
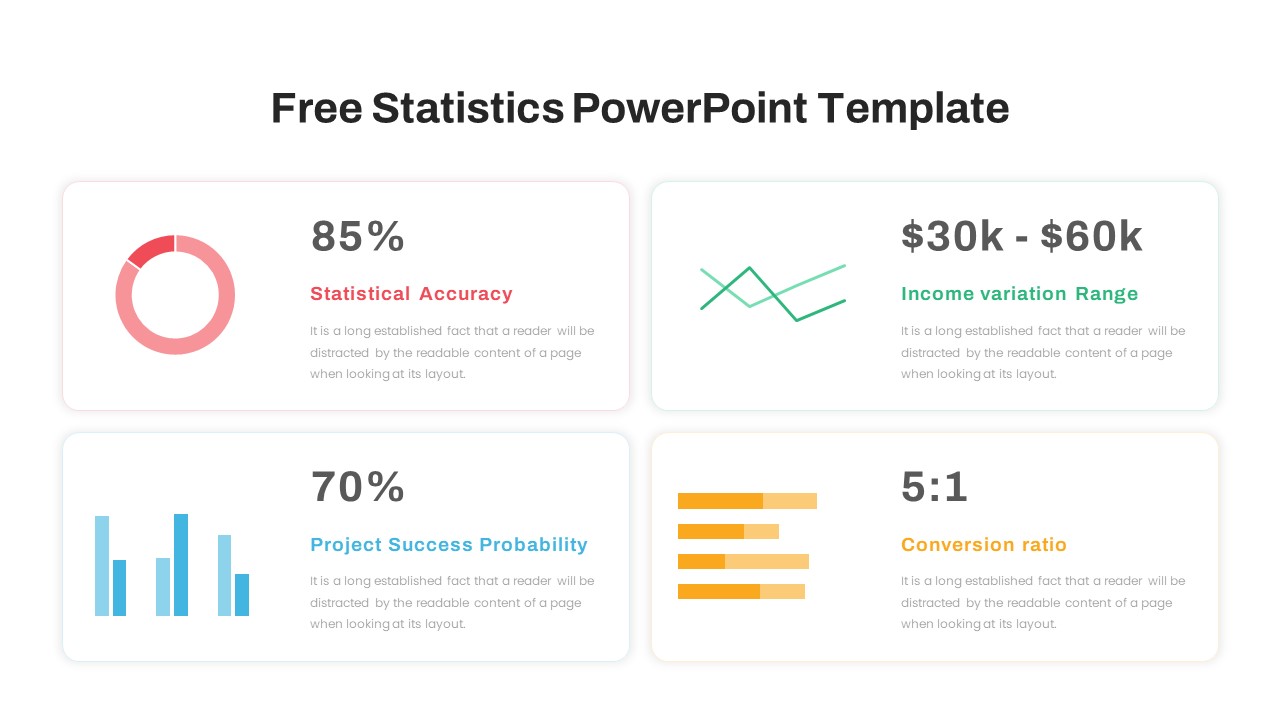
Free Statistics PowerPoint Template
Free PowerPoint Templates
Free
-
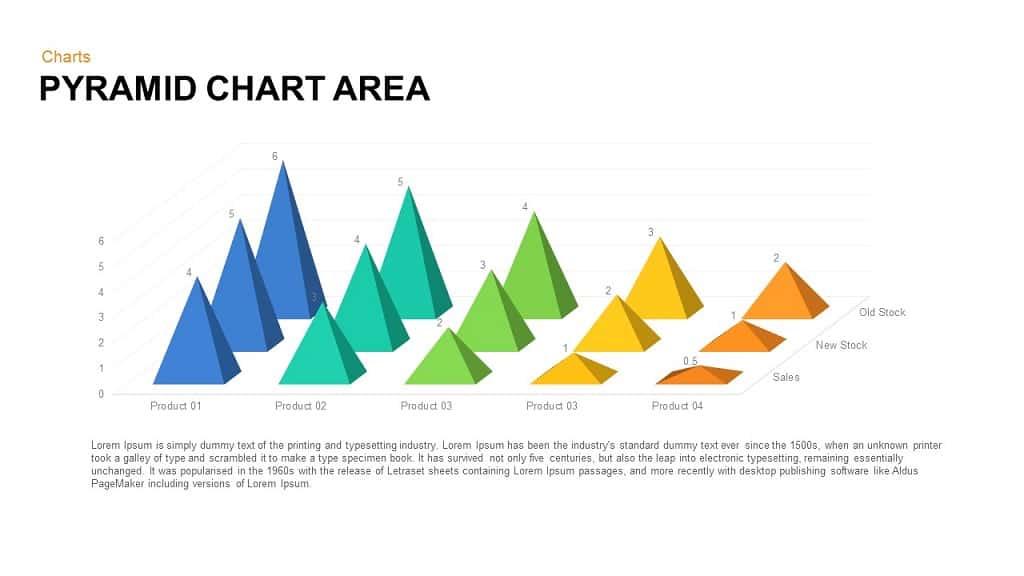
Pyramid Area Chart Template for PowerPoint and Keynote
Column and Bar chart
Premium
-
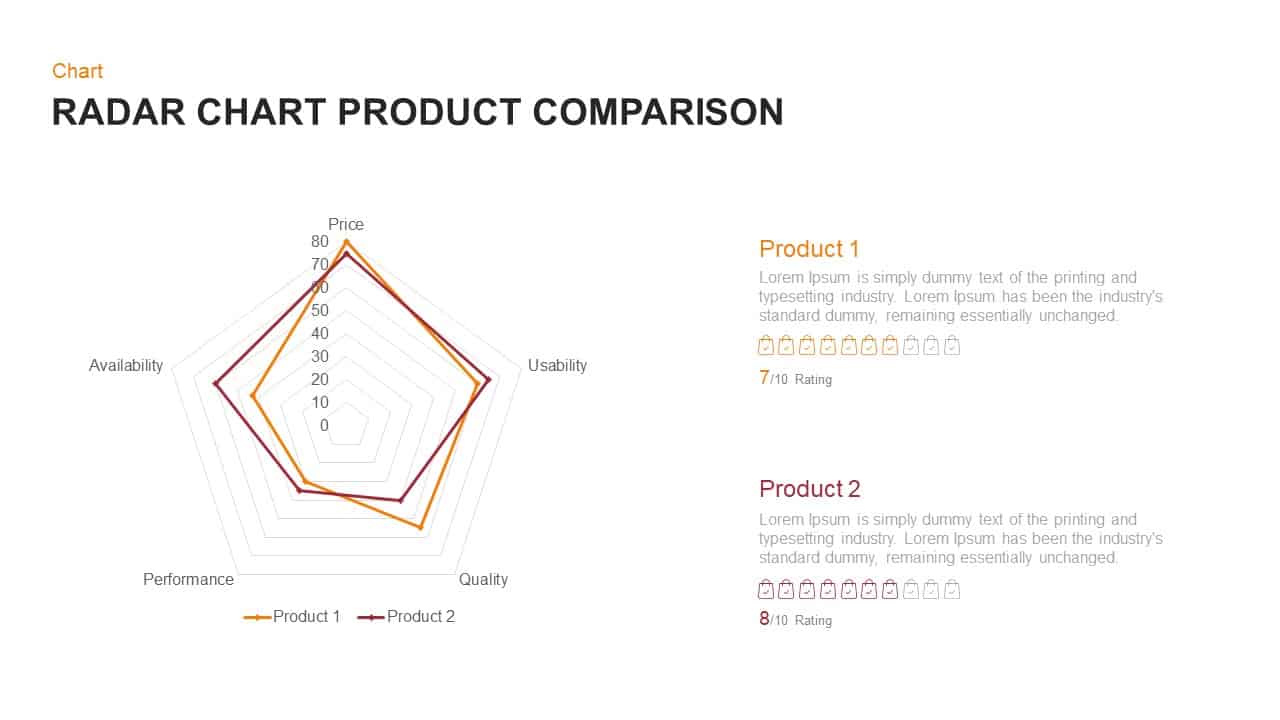
Radar Chart Product Comparison PowerPoint Template
Business Models
Premium
-
Free Simple Column Chart PowerPoint Template
Column and Bar chart
Free