


Animated Stacked Bar Chart Slide Template
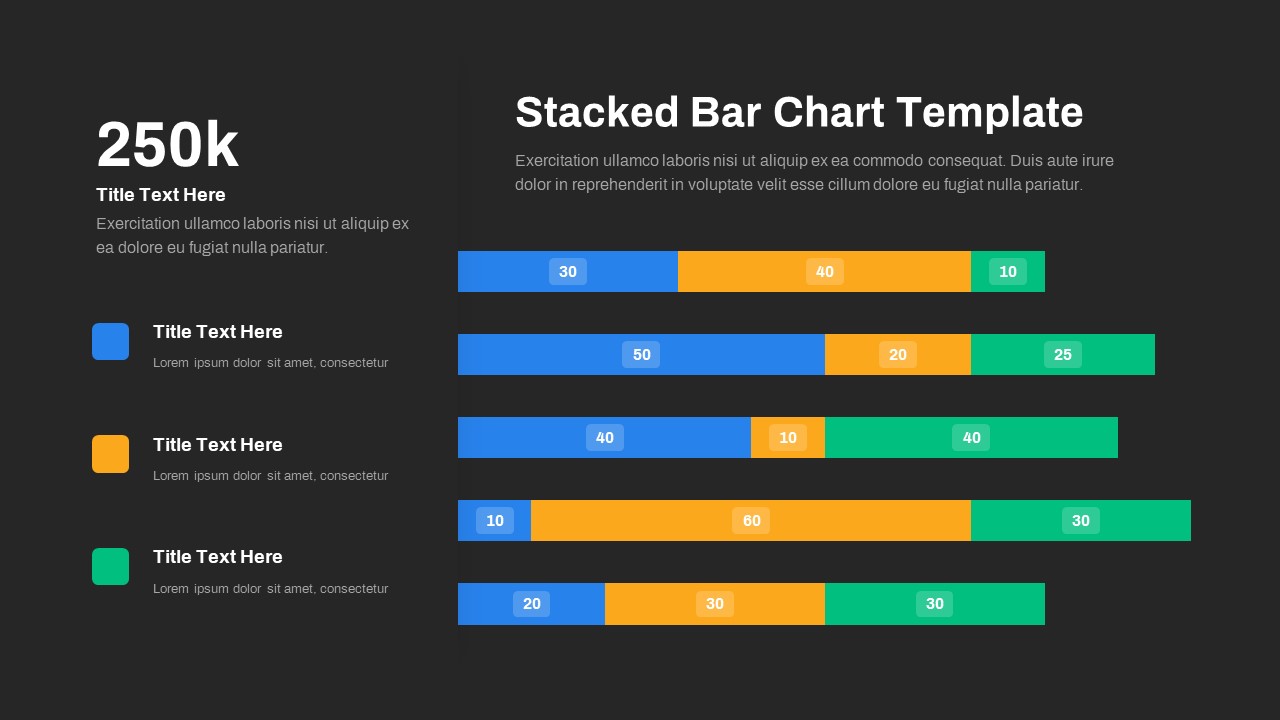
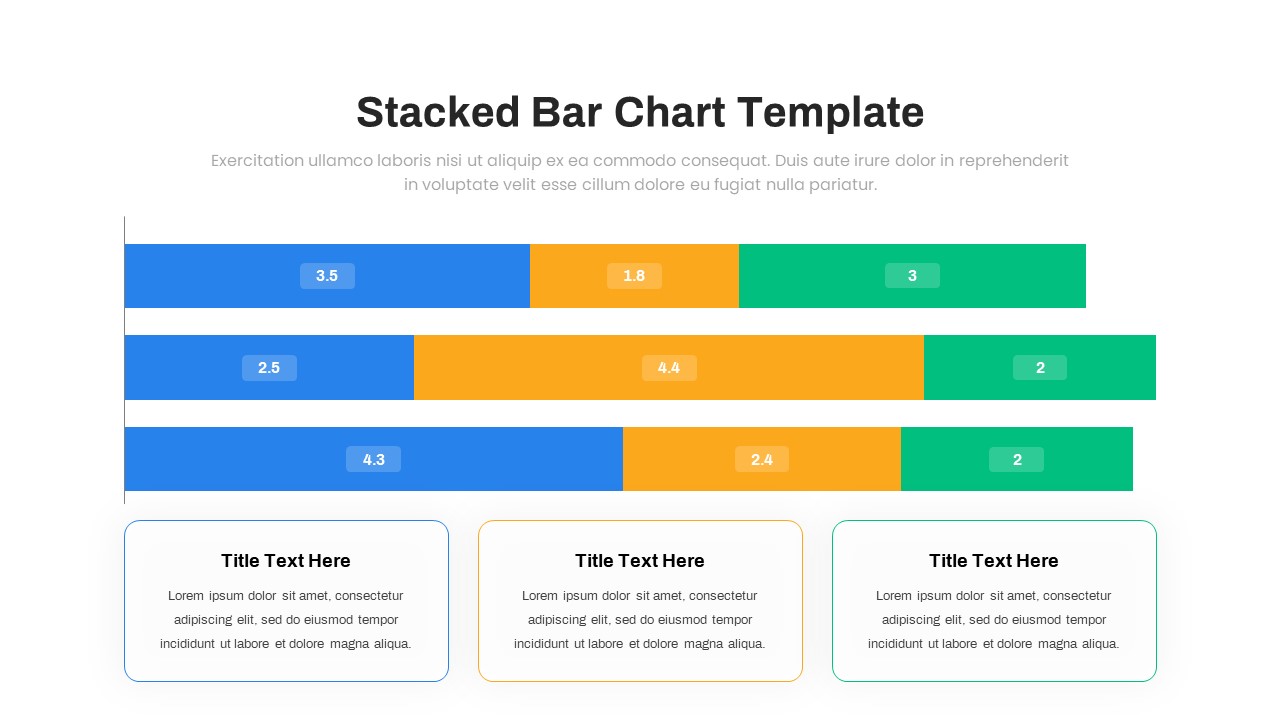
The Animated Stacked Bar Chart PowerPoint Template presents a horizontal bar chart in four slides with two variants. These parallel bars are divided into three segments, so it enables the user to show three variables in a single-column graph. In this PowerPoint chart, the bars are positioned horizontally along the x-axis, and their lengths represent the quantitative values being compared. This bar diagram for PowerPoint presentations is particularly useful when you want to show the composition or distribution of multiple categories within a single data series. Each bar is divided into segments, with each part representing a category or a subcategory. The parts are stacked on the middle and top of each other to visualize the cumulative total of each class. The stacked bar chart animated PowerPoint template will help show numerical data of both quantitative and qualitative research. It is commonly used in business, marketing, finance, and other fields to visually represent data such as market share, budget allocations, demographic distributions, and project timelines. Besides, the horizontal orientation of the ppt chart makes it easy to compare the relative sizes of the segments across categories. Additionally, the horizontal layout is especially useful when the category labels are long or when you have many categories, as it allows for better readability. The animated stacked bar chart PowerPoint template has two variant designs for slides. One of the charts has three categories to showcase, and the other has five types of bars to display your data points. The design is also different; the former has its text placeholders on the bottom, and the latter has text placeholders on the left side. The bars are coloured blue, yellow and green. Each variant design comes in black and white background presentation designs. The presenters can customize the template according to their data. With these visually appealing options, presenters can effectively present their information in a clear and engaging manner.