


8 Section Donut Chart PowerPoint Template and Keynote Slide

- Version
- Download 250
- File Size 0.00 KB
- File Count 1
- Create Date August 18, 2016
- Last Updated January 12, 2024
8 Section Donut Chart PowerPoint Template and Keynote Slide
Donut Chart PowerPoint Template
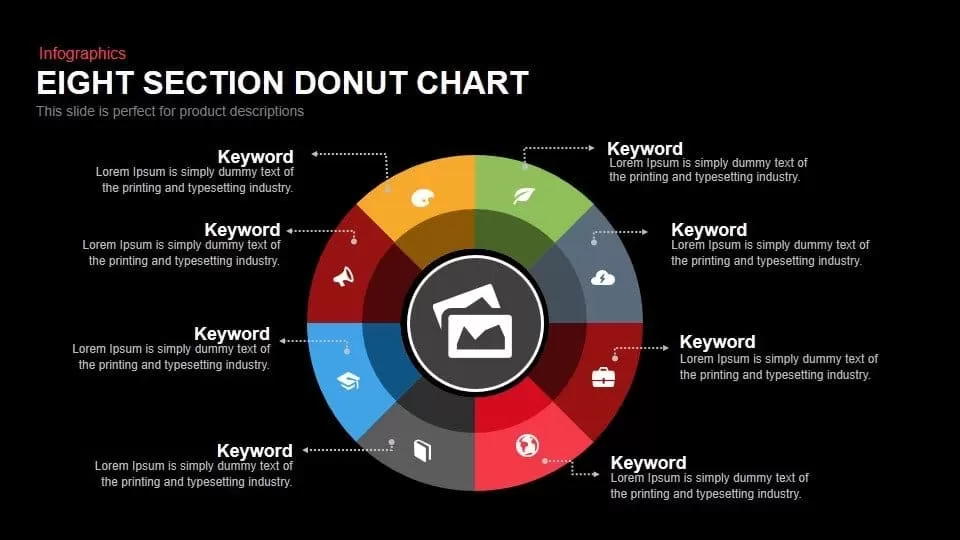
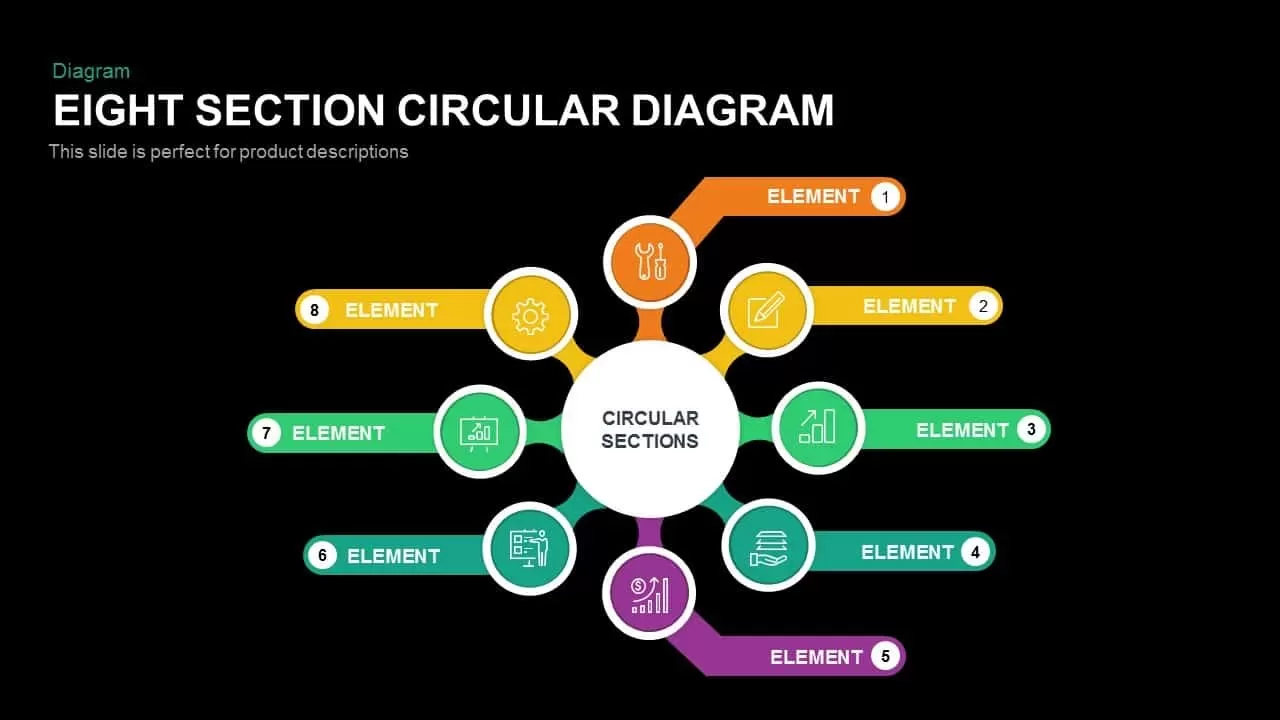
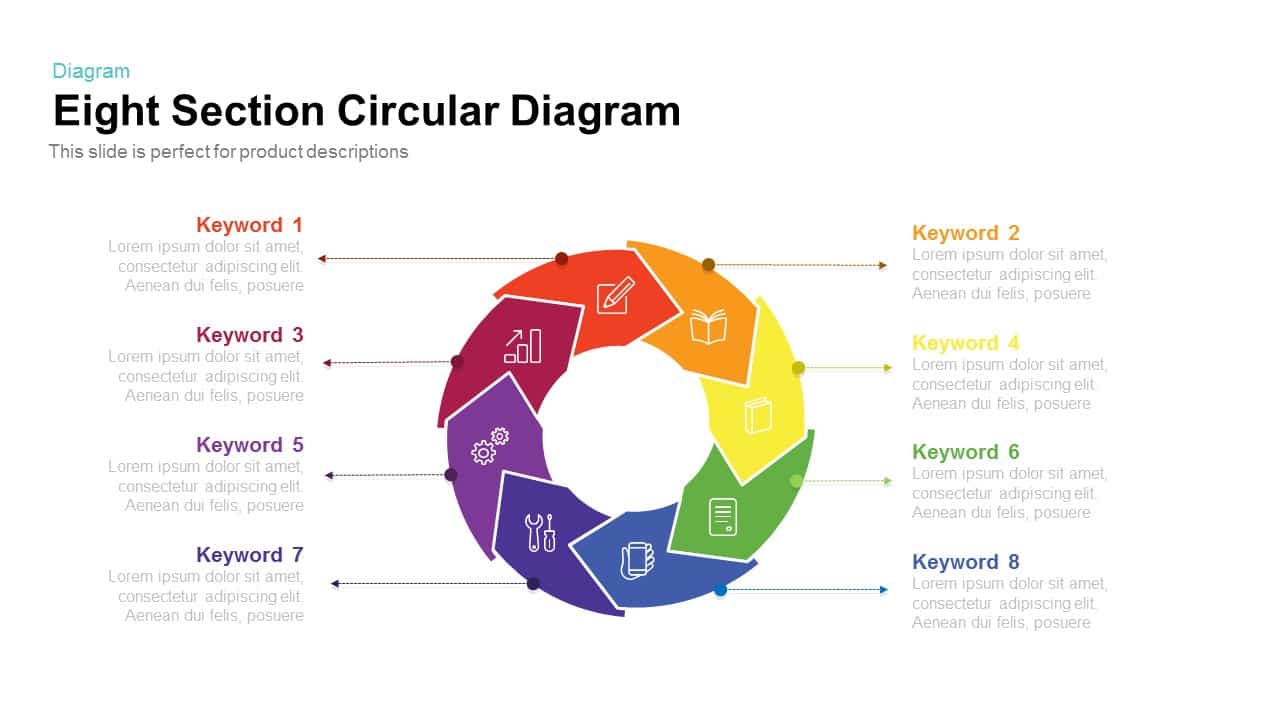
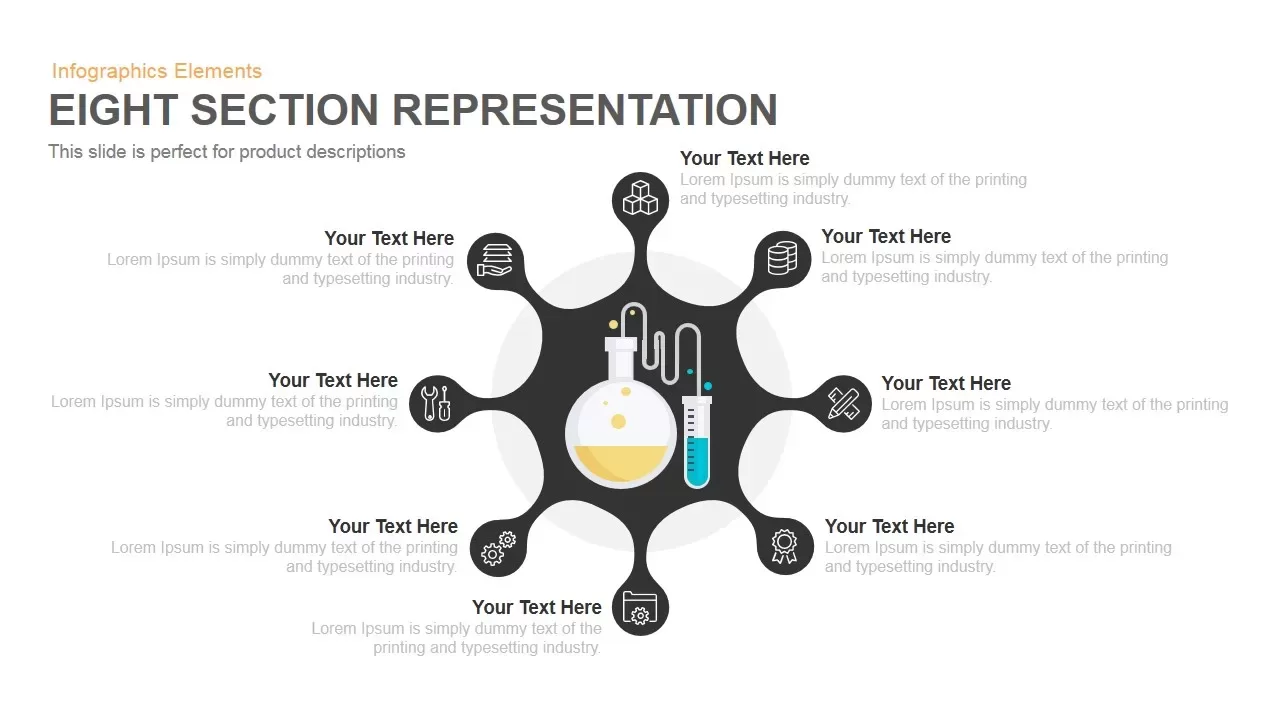
8 section donut chart PowerPoint template keynote slide has equally measured sections that may use to show the eight elements of a single issue. Each section is ornamented with infographic icons and separately colored. Users can present the data distribution by each section. It’s like a donut chart but the distribution of data having equal value. The users can change the length of each section and shows the value differences, otherwise they can show the normal concepts by using eight section donut chart PowerPoint template.
Improve the presentation of statistical data using eight section donut chart PowerPoint template and keynote slide. This slide is presentation theme contains creative donut chart PowerPoint template diagrams that can be easily edited and customized for all presentation needs. This PowerPoint uses simple infographic icons that the audience can easily amalgamate to the presentation subject. This flat design clipart include; chat, leaf, cloud, briefcase, globe, book, tag and a speaker. The common interactive symbols have apparent definitions when they are used. For example, Chat refers communication and the globe refers globalization and global business reach. These notions can be translated to the donut chart as parts of a whole.
8 section donut chart PowerPoint template and keynote can illustrate the percentage distribution of the volume of resources given to particular components of the business, relative to the other components. It is most commonly used charts for data visualization, predominantly because they are as easy to create as they are to understand. Technically, a donut chart is a statistical graph for plotting mathematical proportions. This diagram is ideal for presenting market comparisons, product wise sales figures, product average sale, product distribution in different areas and sections etc. this eight section PowerPoint is perfect for business plans and deliberations where the comparison allocation are being discussed. It is 100 percent editable diagram, user can change the color and PowerPoint icons, but no layout customization is needed to change the values. The user can combine this donut chart with additional graphics from our Data & Chart gallery and created professional monitoring that impresses the global audience.
Attached Files
| File |
|---|
| ##filetitle## |
Login to download this file
Add to favorites
Add to collection
-

Category
-

Item ID
SB00464 -

Related Templates
-

Sales Deck Free PowerPoint Template
PowerPoint Templates
Free
-

Nature PowerPoint Presentation Template
PowerPoint Business Templates
Premium
-

Research Proposal PowerPoint Template
PowerPoint Templates
Premium
-

Cab Service PowerPoint Template
PowerPoint Templates
Premium
-

Free Vertical PowerPoint Template
PowerPoint Business Templates
Free
-

Free Nursing Capstone PowerPoint Deck
PowerPoint Templates
Free
-

Free Space Minimal Deck Template
PowerPoint Templates
Free
-

Gym PowerPoint Template
PowerPoint Templates
Premium
-

VET Clinic PowerPoint Template
PowerPoint Templates
Premium
-

IoT Presentation Template
PowerPoint Templates
Premium
-

Free Physical Education PowerPoint Template Deck
Free PowerPoint Templates
Free
-

Travel Agency PowerPoint Template
PowerPoint Templates
Premium
-

Effective Communication PowerPoint Template
PowerPoint Templates
Premium
-
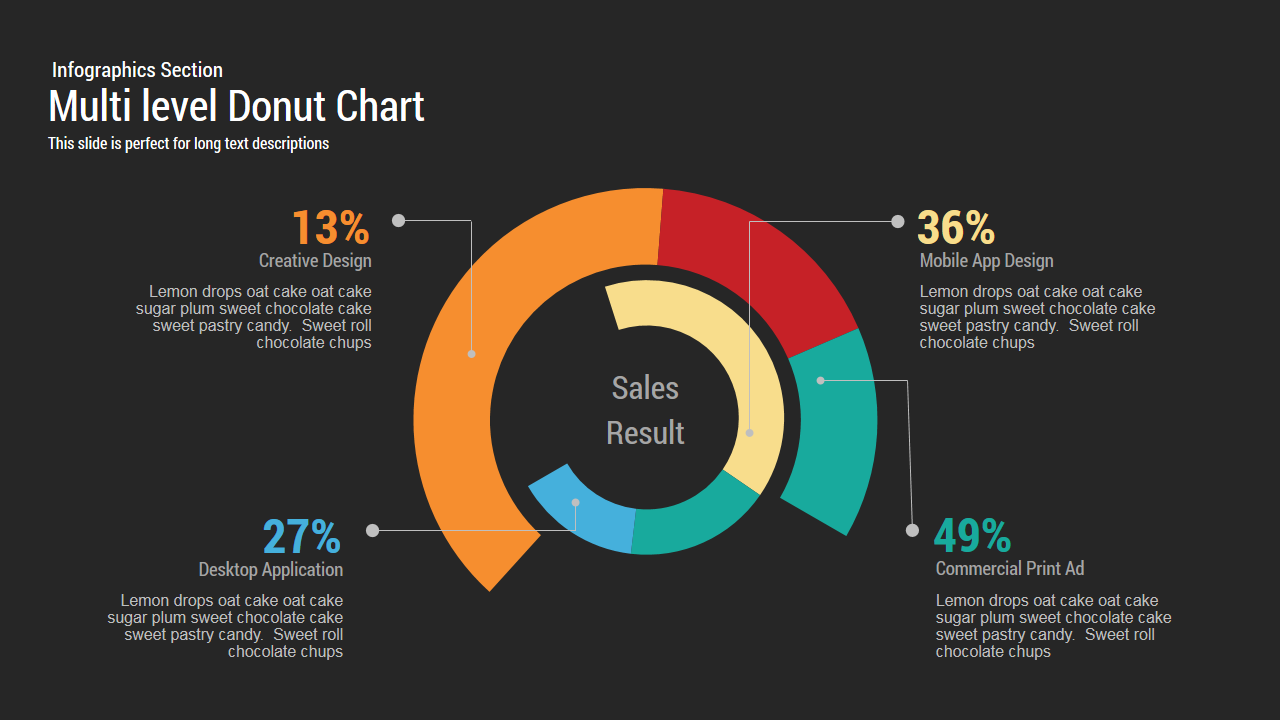
Multi level Donut Chart Template for PowerPoint and Keynote
PowerPoint Charts
Premium
-
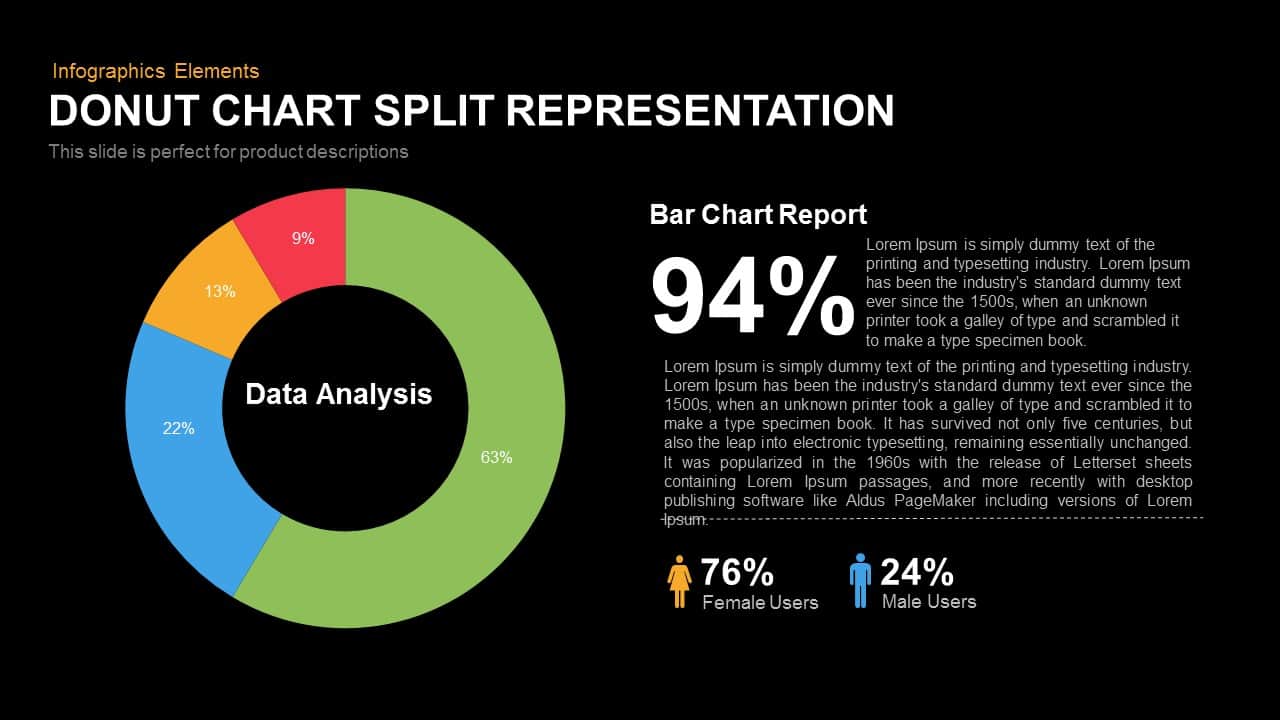
Split Representation Donut Chart Template for PowerPoint and Keynote
Keynote Templates
Premium
-
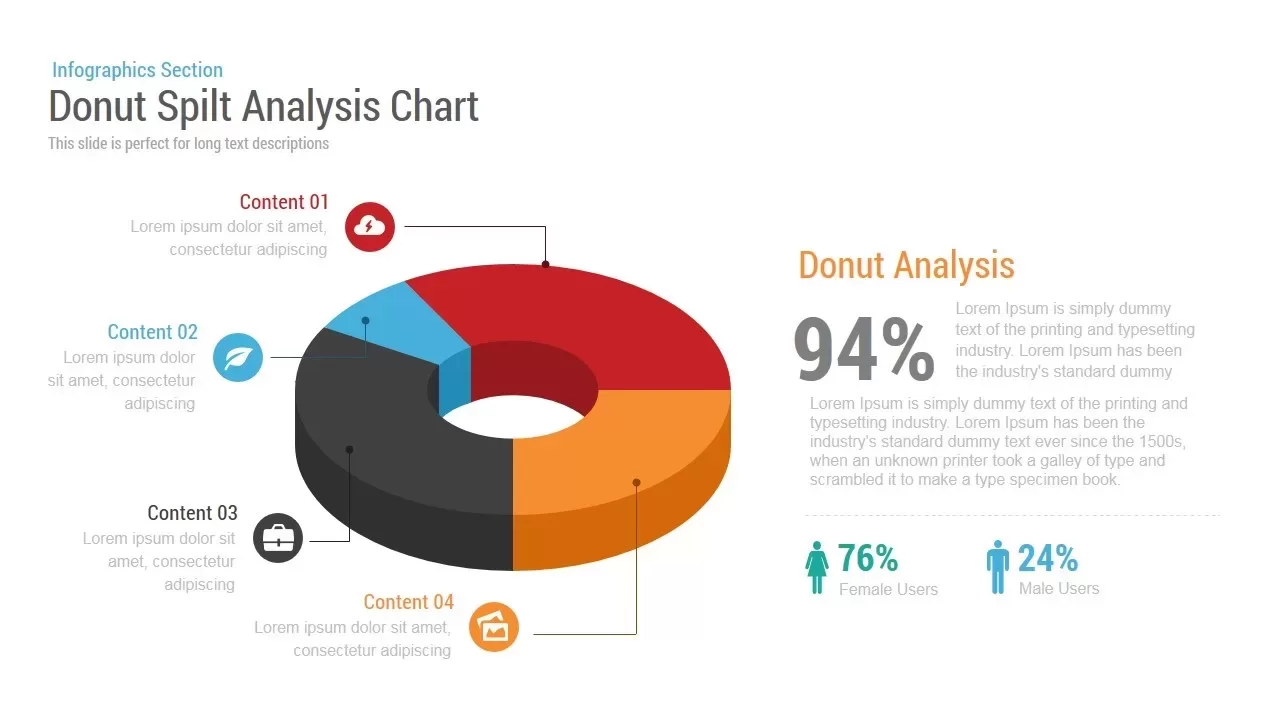
Donut Split Analysis Chart PowerPoint Template and Keynote Slide
Infographic
Premium
-

PowerPoint Quiz With Timer
PowerPoint Templates
Premium
-
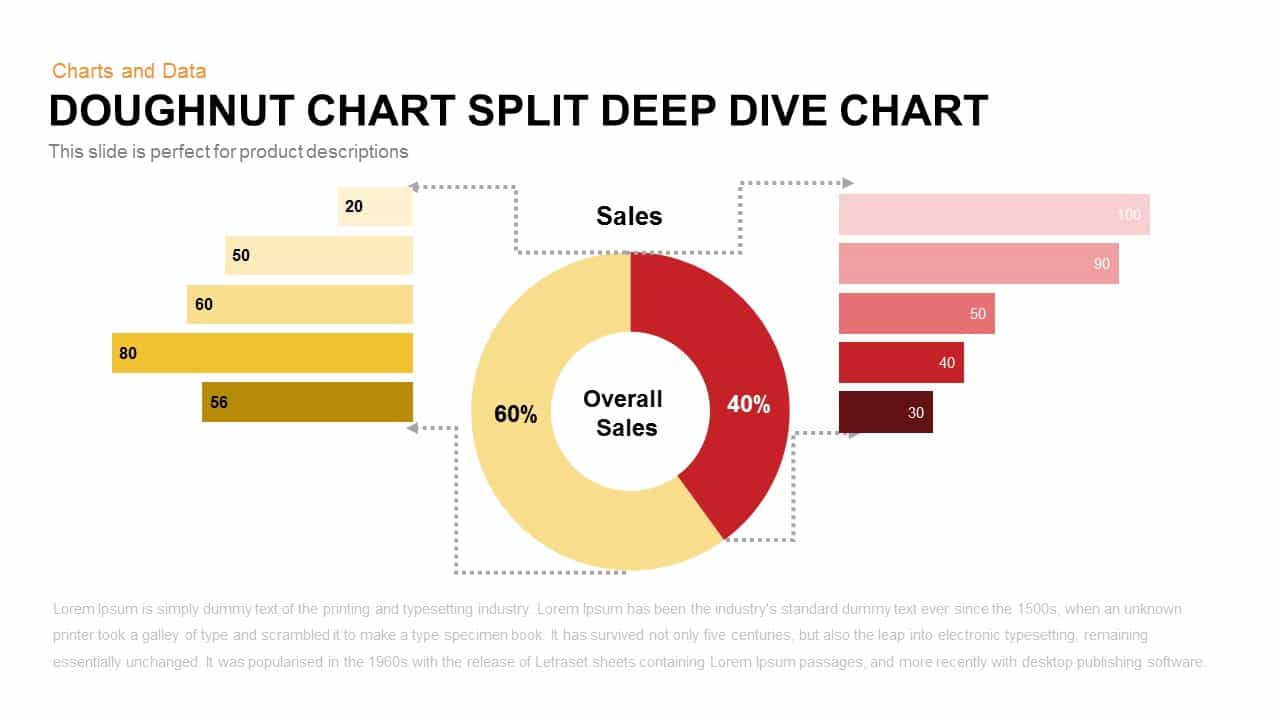
Donut Chart Split Deep Dive Chart Template For PowerPoint and Keynote
Keynote Templates
Premium
-
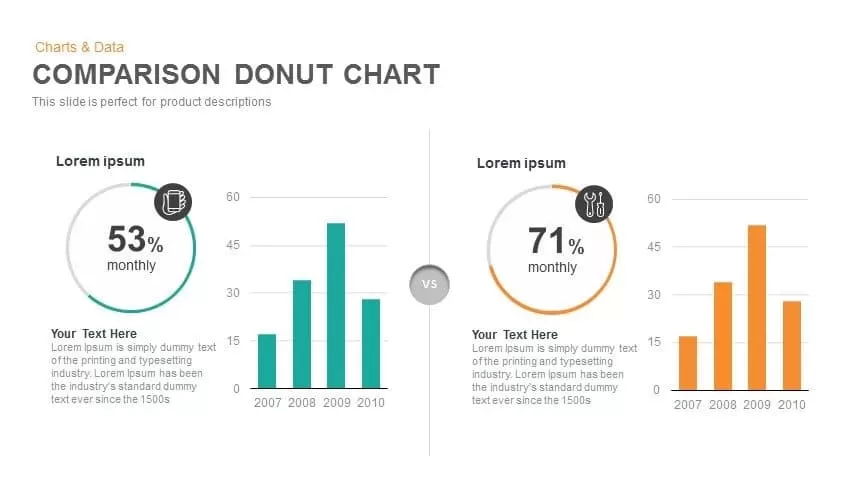
Comparison Donut Chart PowerPoint Template and Keynote
Keynote Templates
Premium
-
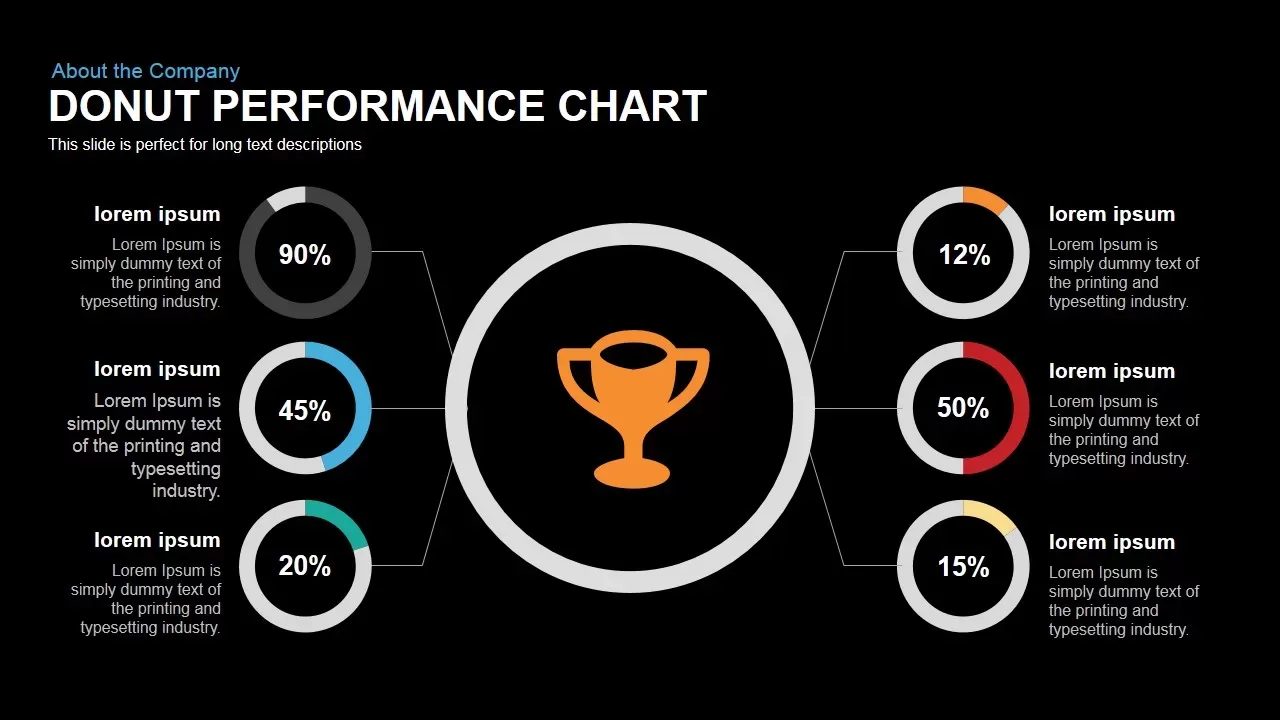
Donut Chart Performance PowerPoint Template and Keynote Slide
Pie & Donut
Premium
-

Free Economics PowerPoint Template
Free PowerPoint Templates
Free
-

Graph Paper PowerPoint Template Deck
PowerPoint Templates
Premium
-

Customer Experience Loyalty PowerPoint Deck Template
PowerPoint Templates
Premium
-

Free Aviation PowerPoint Template
Free PowerPoint Templates
Free
-

Macroeconomics PowerPoint Template
PowerPoint Templates
Premium
-

Free Army PowerPoint Template
PowerPoint Templates
Free
-

Free Charity PowerPoint Template Deck
PowerPoint Templates
Free
-

Animated Agriculture PowerPoint Deck Template
PowerPoint Templates
Premium
-

Free Cartoon PowerPoint Template
Free PowerPoint Templates
Free
-

Annual Report PowerPoint Template and Keynote
PowerPoint Templates
Premium
-

Free Real Estate Listing PowerPoint Template
Free PowerPoint Templates
Free
-

Free Event Planning PowerPoint Template
Free PowerPoint Templates
Free
-

Free Book Review PowerPoint Template
Free PowerPoint Templates
Free
-

Free University Presentation PowerPoint Template
PowerPoint Templates
Free
-

Global Warming Infographic PowerPoint Template Deck
PowerPoint Templates
Premium
-

Data Science PowerPoint Template
PowerPoint Templates
Premium
-

EFQM Model PowerPoint Template
PowerPoint Templates
Premium
-

Real Estate PowerPoint Theme
PowerPoint Themes
Premium
-

Free Dunder Mifflin Paper Company Pitch Deck
Free PowerPoint Templates
Free
-
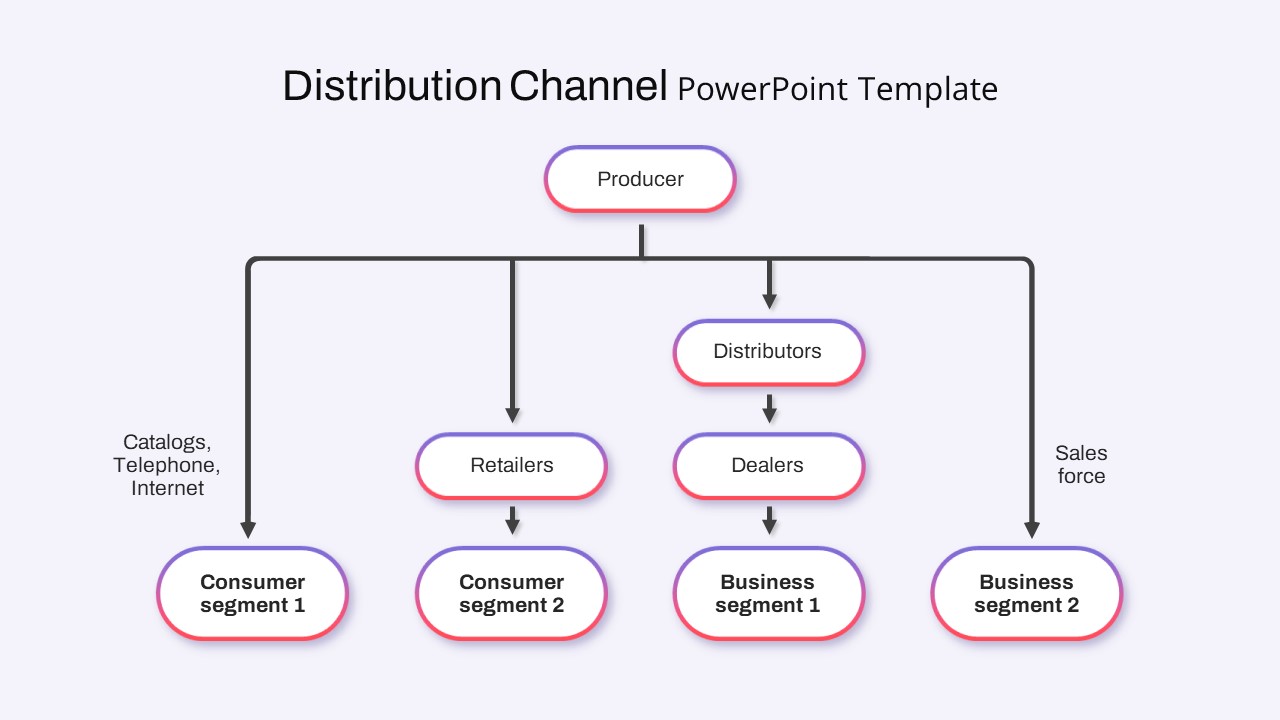
Distribution Channel PowerPoint Template
Flow Charts
Premium
-

Free AI Artificial Intelligence PowerPoint Template
PowerPoint Templates
Free
-

Business Process Reengineering Template
PowerPoint Templates
Premium
-

Stakeholder Register PowerPoint Template
PowerPoint Templates
Premium
-
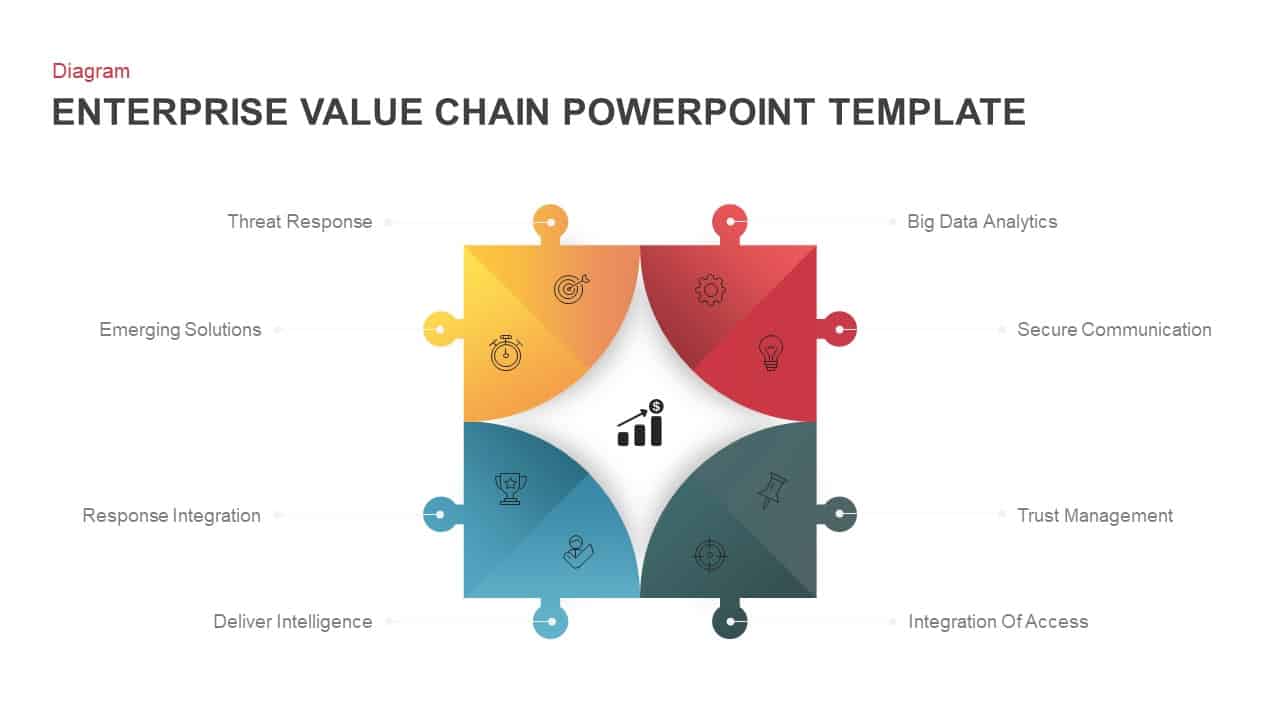
Enterprise Value Chain PowerPoint Template & Keynote
Business Models
Premium
-
Eight Section Circular Diagram PowerPoint Template and Keynote Slide
Circular Diagrams
Premium
-
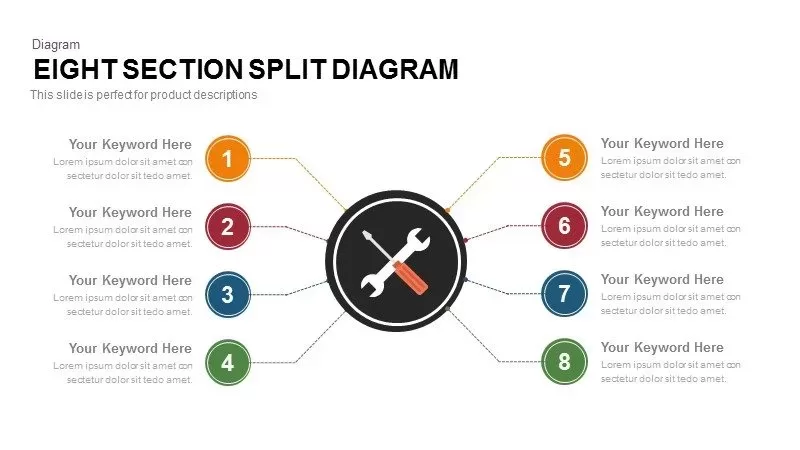
8 Section Split Diagram for PowerPoint Presentation
Business Models
Premium
-

Animated Upcoming Event Poster PowerPoint Template
PowerPoint Templates
Premium
-
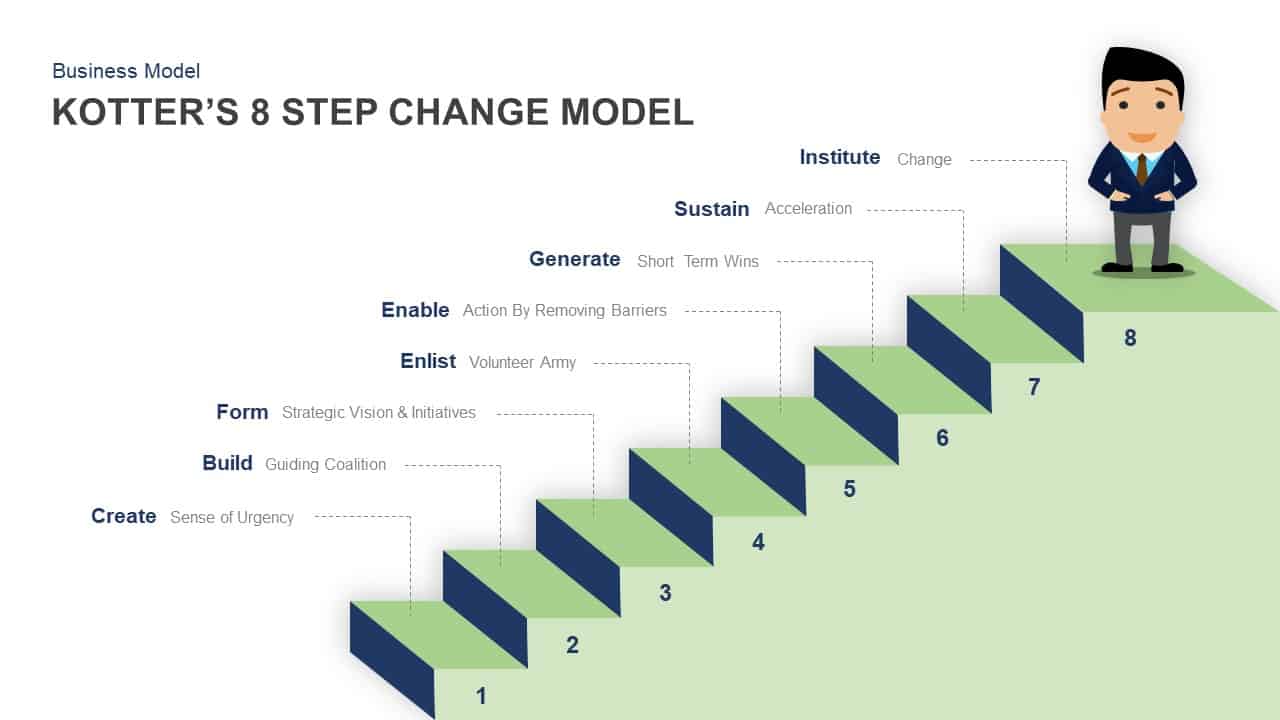
Kotter’s 8 Step Change Model Template for PowerPoint & Keynote
Business Models
Premium
-

Biotechnology PowerPoint Presentation Template
PowerPoint Templates
Premium
-
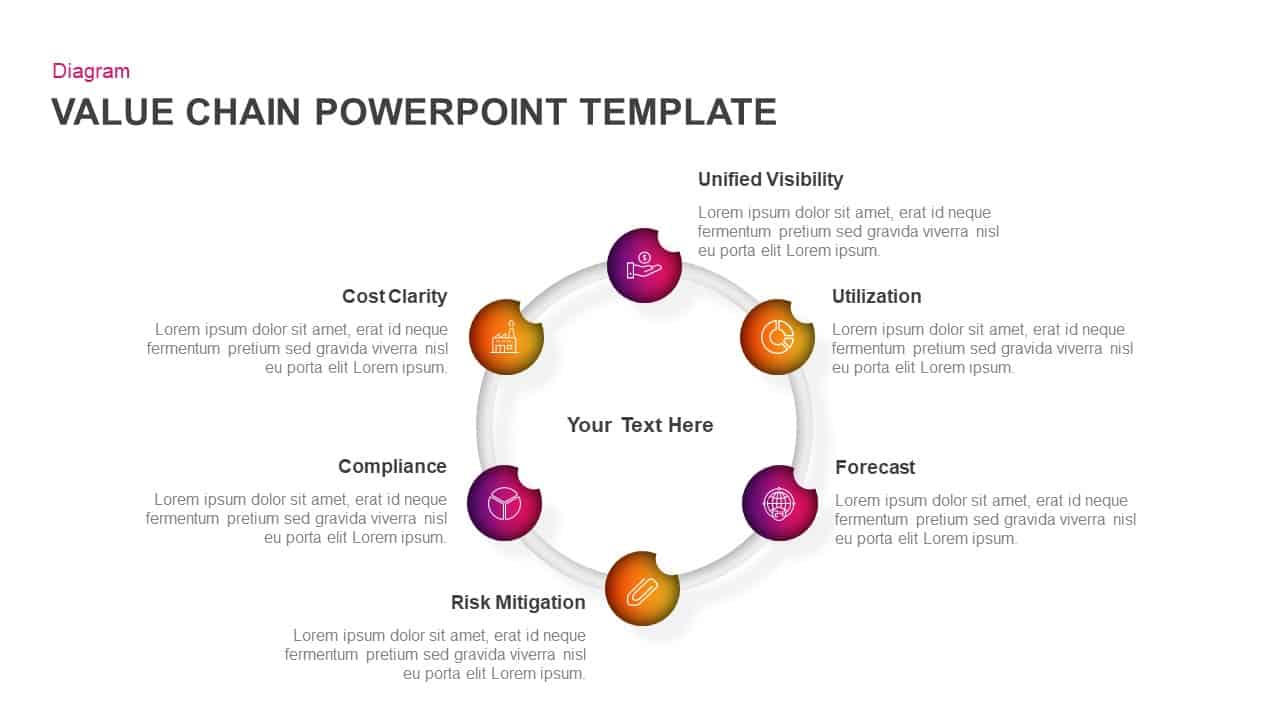
Value Chain Ppt Template for PowerPoint & Keynote
Circular Diagrams
Premium
-
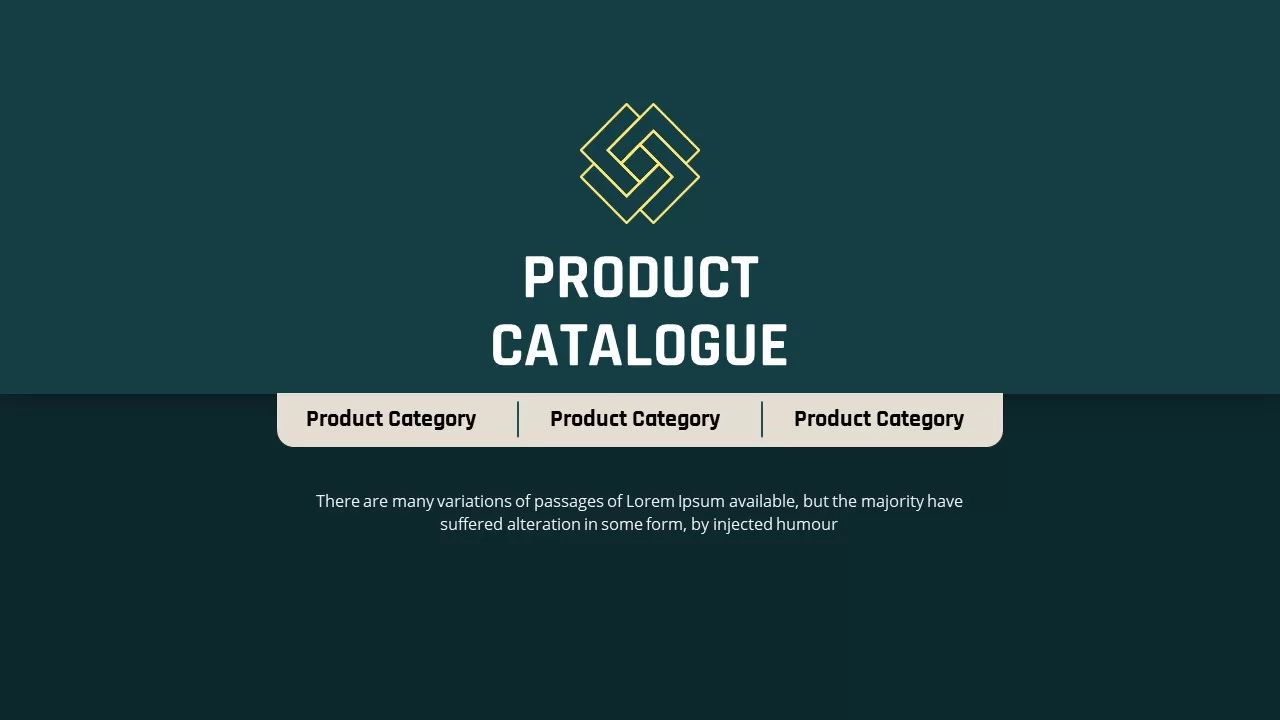
Product Catalog Slide Presentation PowerPoint Template
PowerPoint Templates
Premium
-
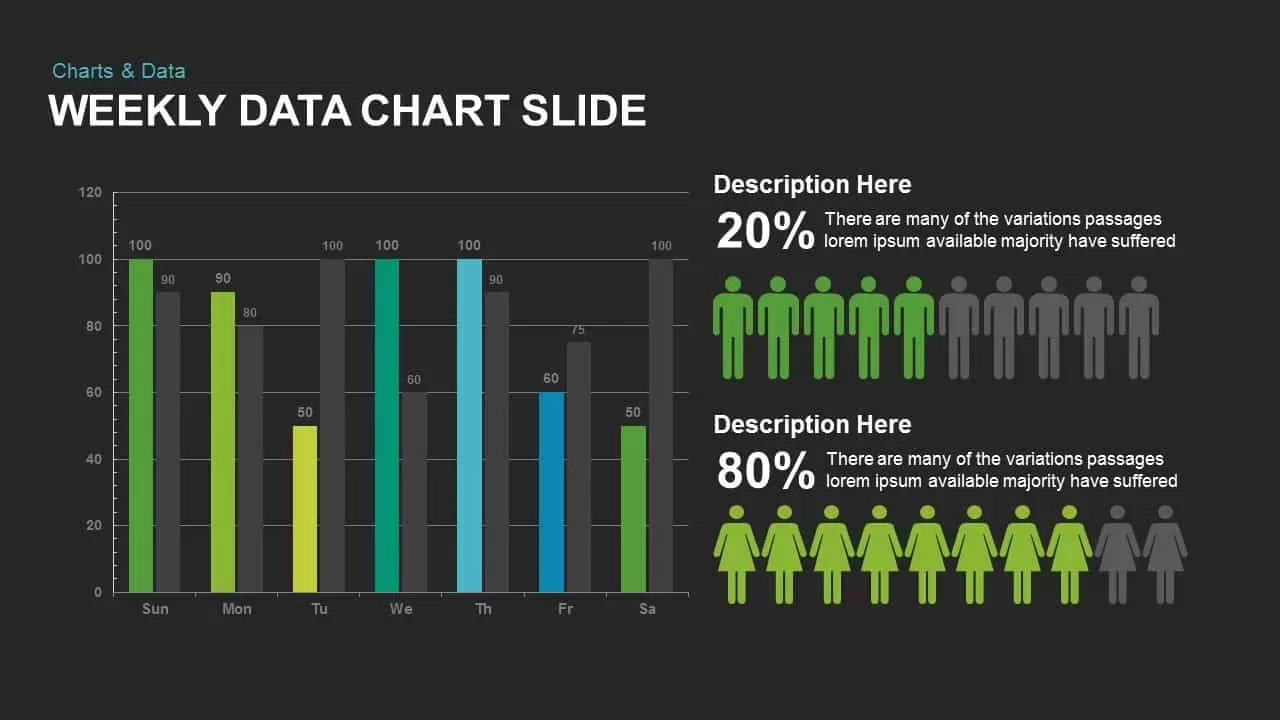
Weekly Data Charts PowerPoint Presentation Template and Keynote Slide
Infographic
Premium
-
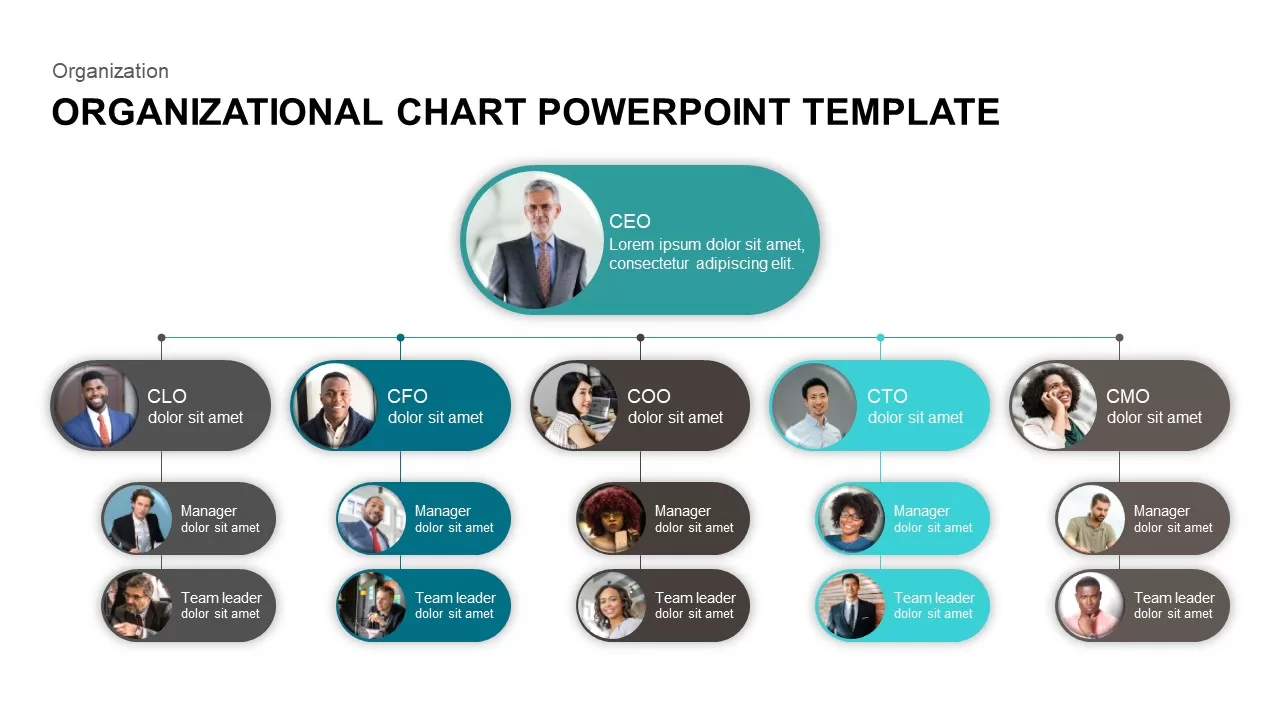
Org Chart PowerPoint Presentation Template
PowerPoint Charts
Premium
-

Open Door Policy PowerPoint Template
PowerPoint Templates
Premium
-

Multipurpose Business PowerPoint Template
PowerPoint Business Templates
Premium
-

Proportional Area Chart PowerPoint Template
PowerPoint Templates
Premium
-
Section Circular Diagram PowerPoint Template and Keynote
Arrow Diagrams
Premium
-

Go To Market PowerPoint Template
PowerPoint Templates
Premium
-
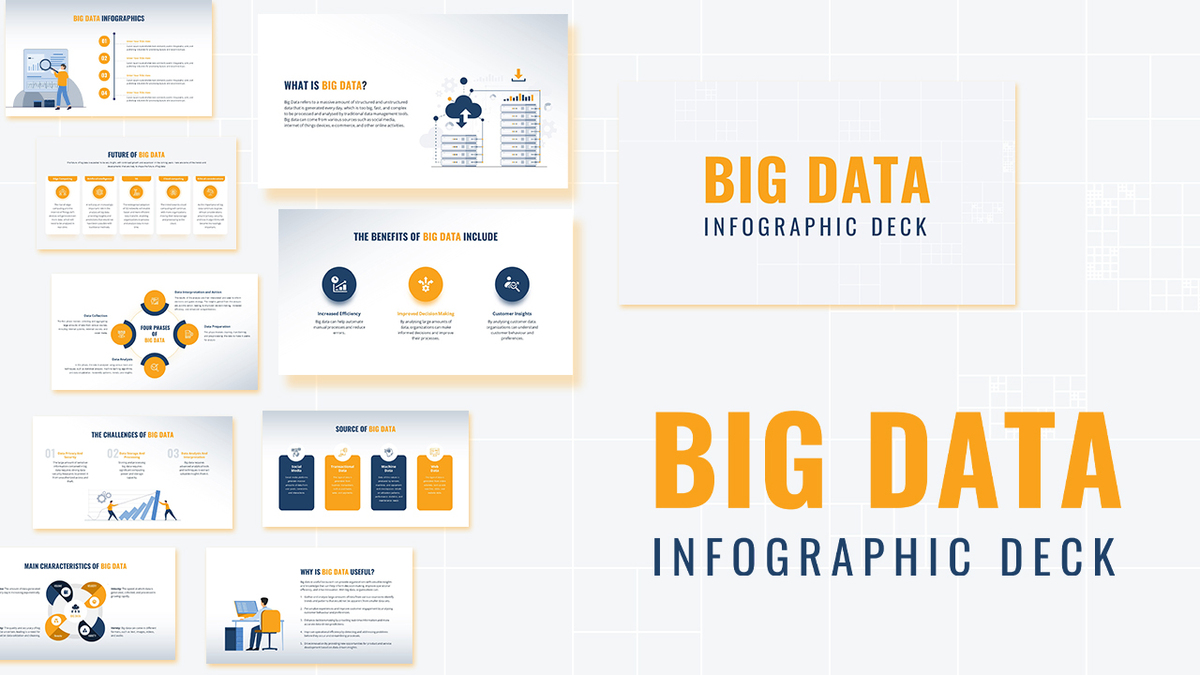
Big Data Infographic Deck For PowerPoint
PowerPoint Business Templates
Premium
-
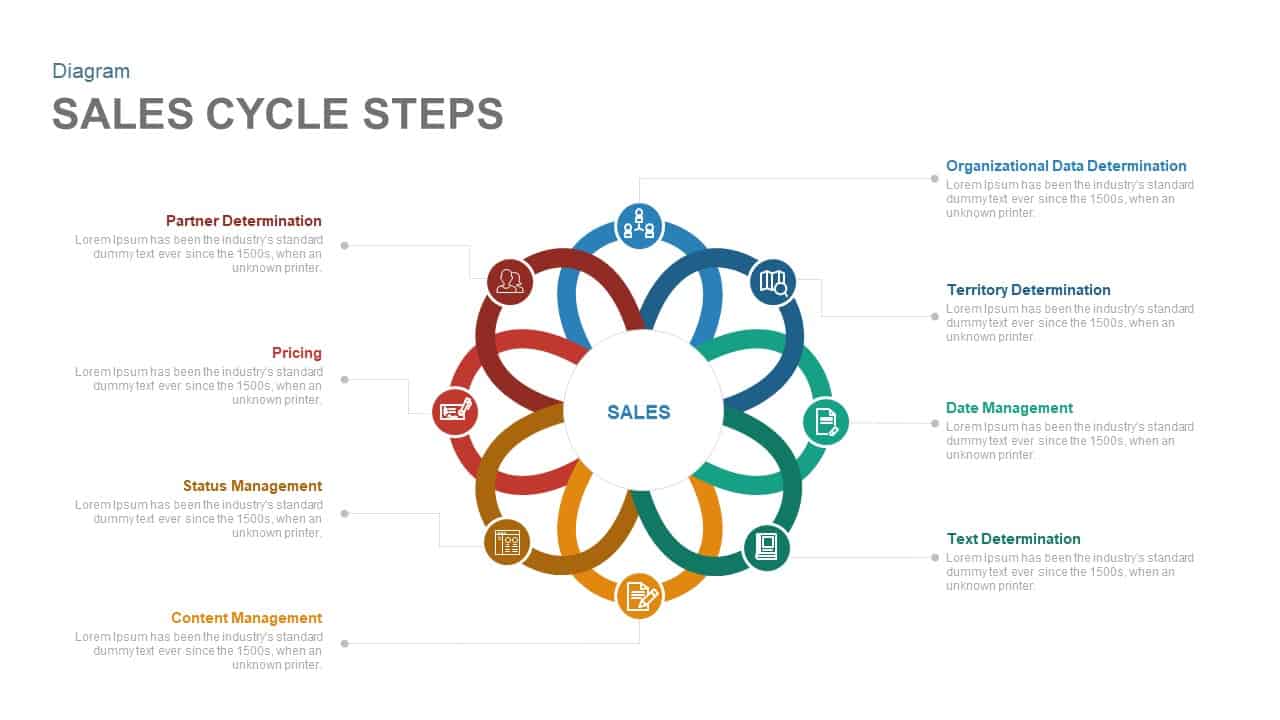
Sales Cycle Steps PowerPoint Template and Keynote Template
Circular Diagrams
Premium
-
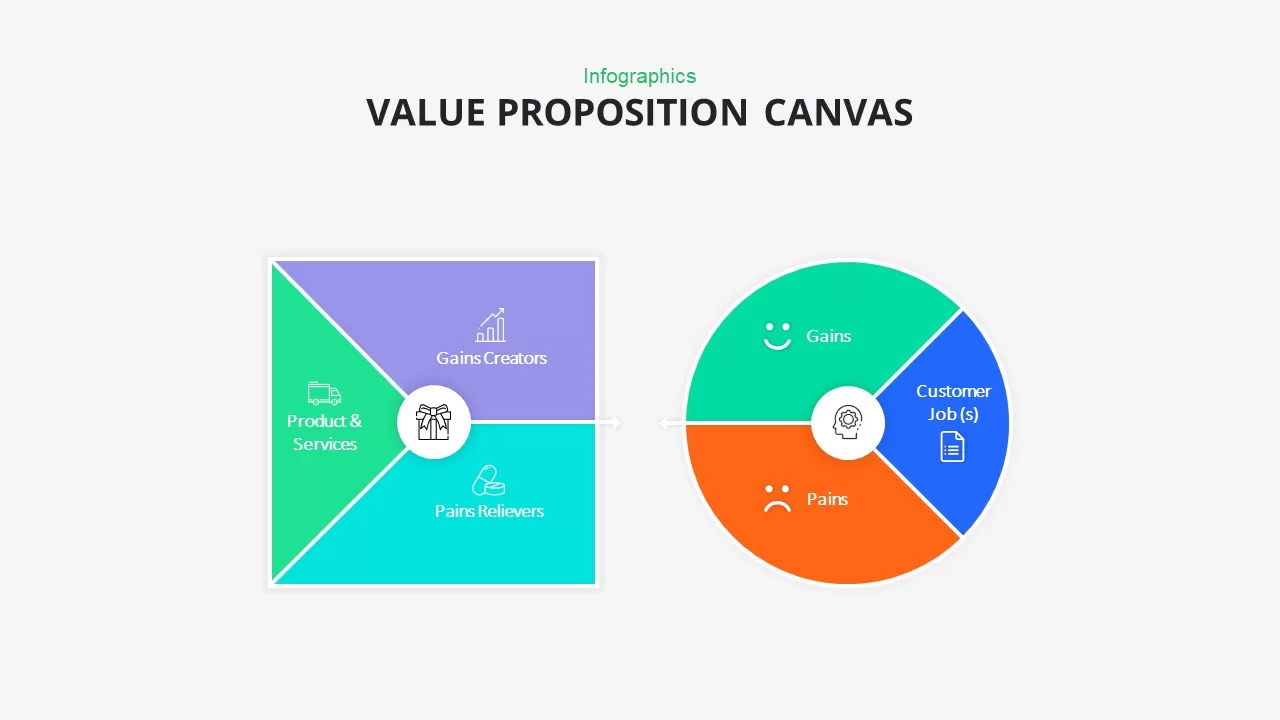
Value Proposition Canvas PowerPoint Template
Diagrams
Premium
-
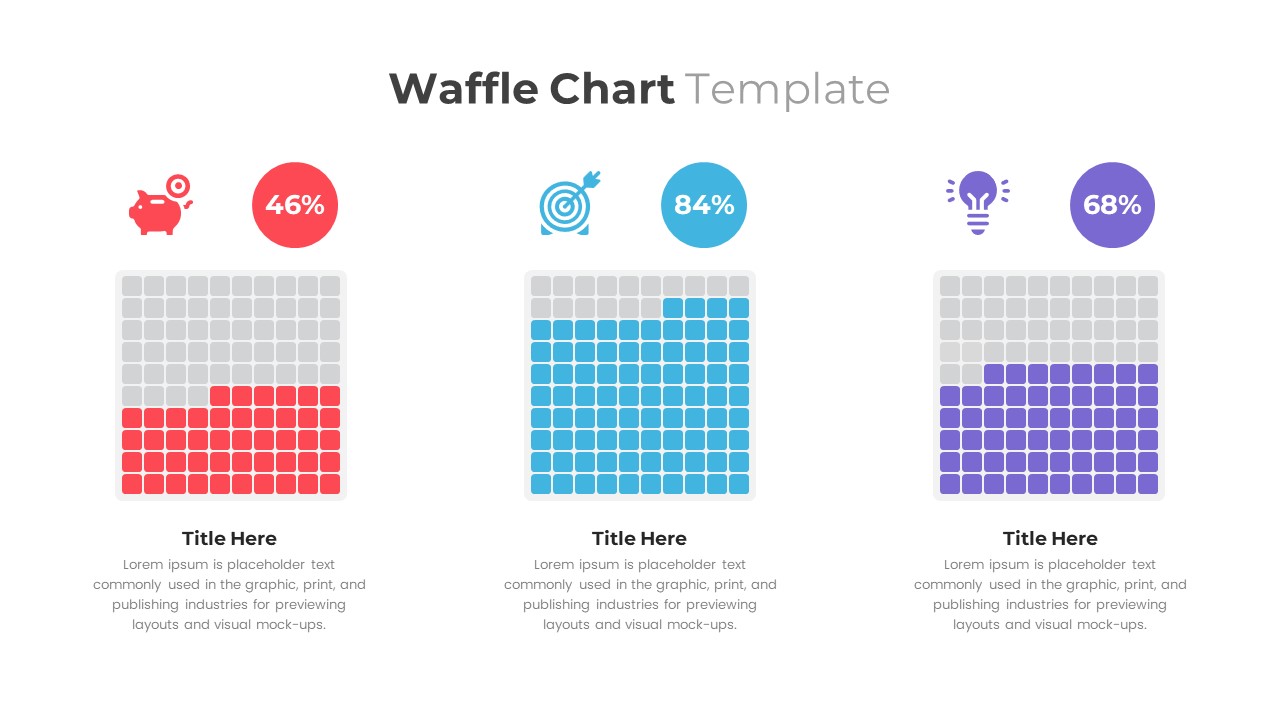
Waffle Chart PowerPoint Template
PowerPoint Templates
Premium
-
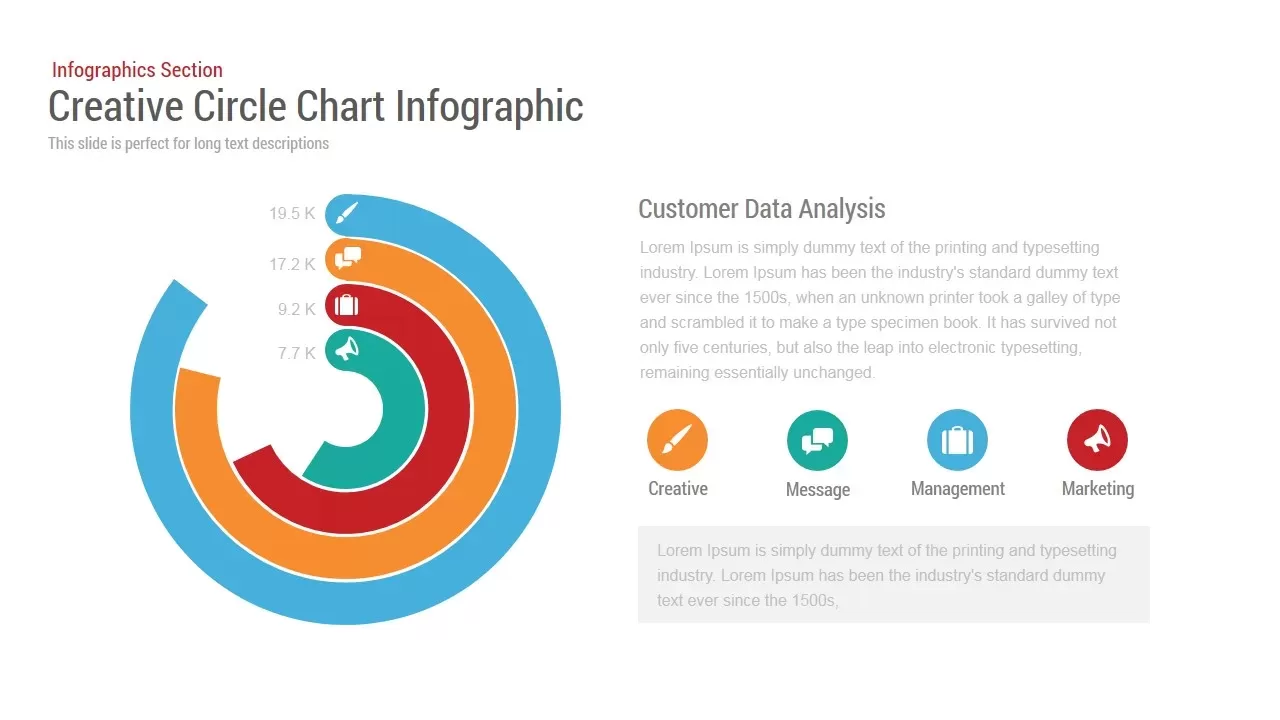
Circle Chart Infographic PowerPoint Template and Keynote
Infographic
Premium
-

Area Chart PowerPoint Template
PowerPoint Charts
Premium
-
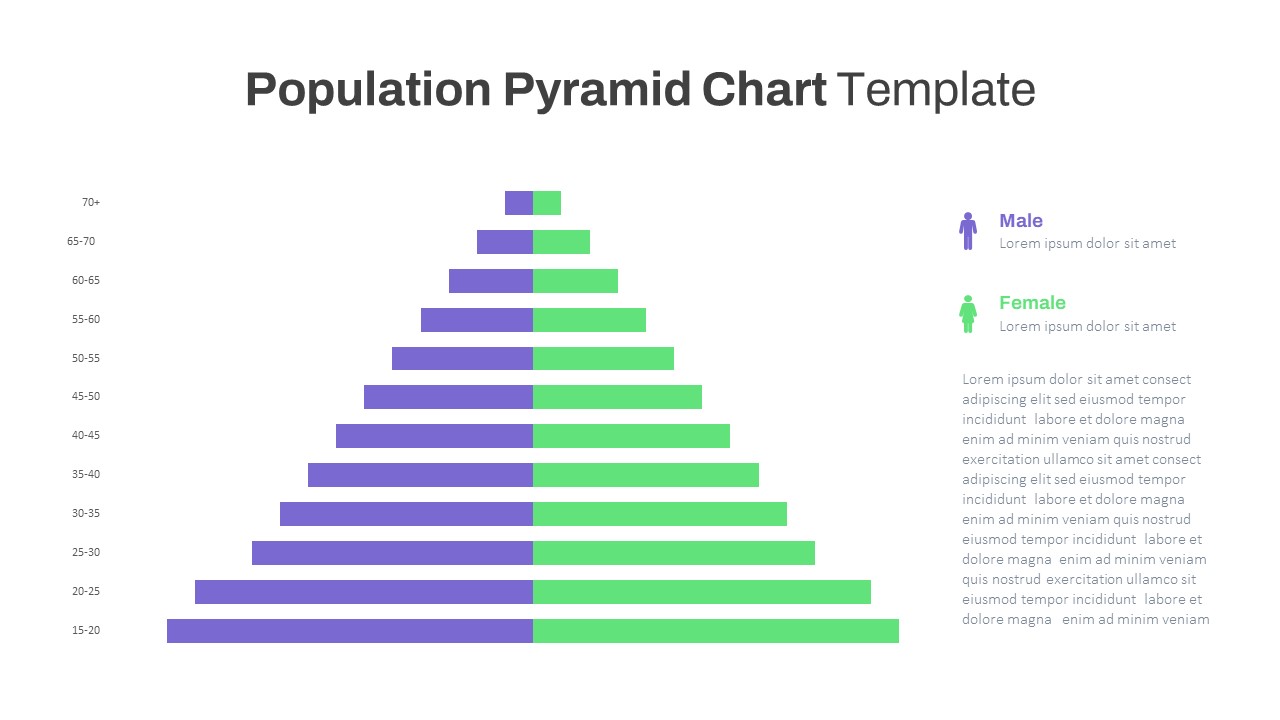
Population Pyramid Chart PowerPoint Template
PowerPoint Templates
Premium
-

Power Analogy Metaphor PowerPoint Template
Metaphor, Simile & Analogy
Premium
-
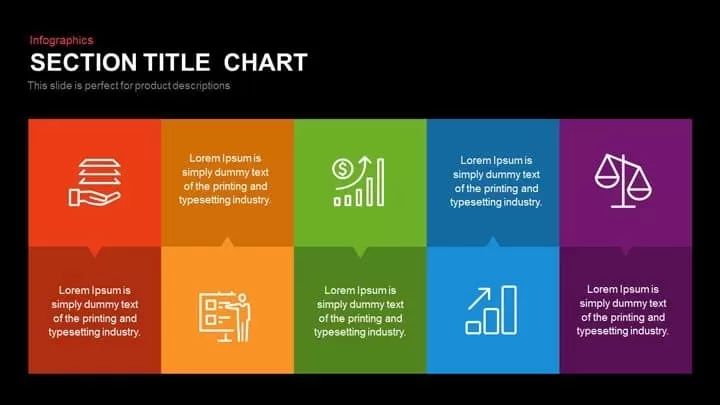
Section Title Chart PowerPoint Template and Keynote Slide
Infographic
Premium
-

Cyber Monday PowerPoint Template
PowerPoint Business Templates
Premium
-
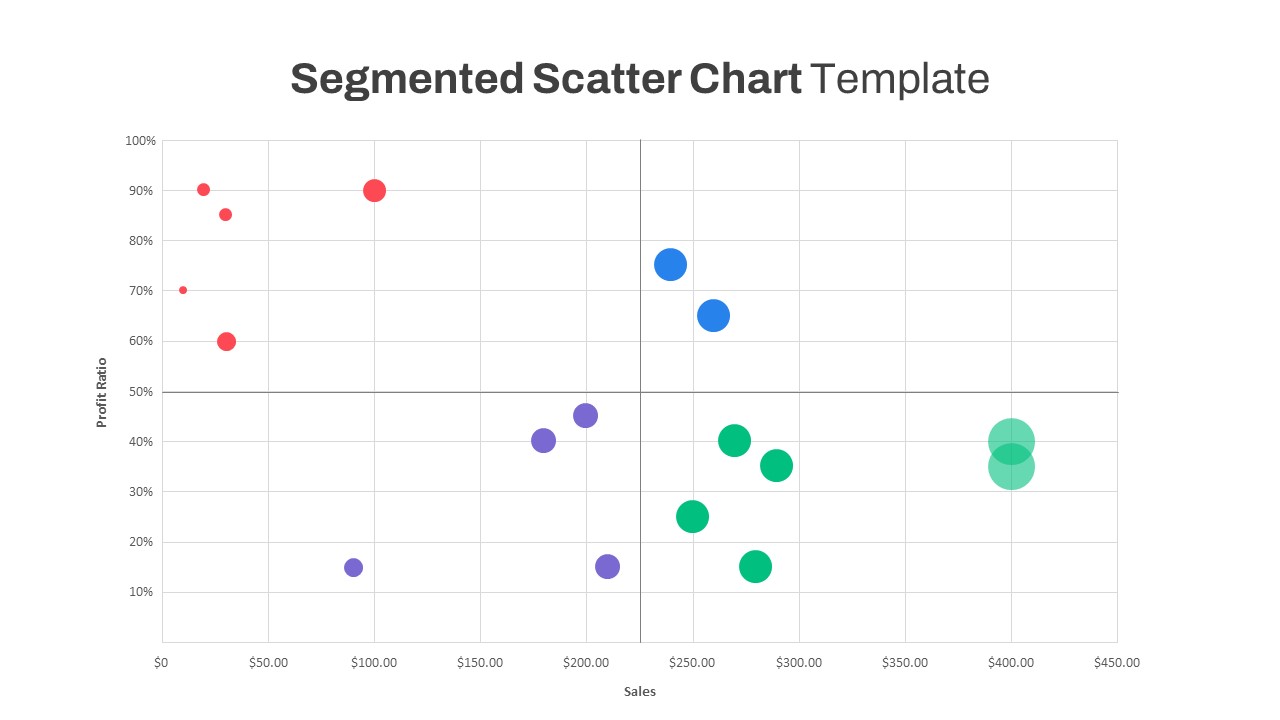
Segmented Scatter Chart PowerPoint Template
PowerPoint Charts
Premium
-

Pencil Bar Chart PowerPoint Template and Keynote Slide
Column and Bar chart
Premium
-

Combination Chart PowerPoint Template
PowerPoint Charts
Premium
-

Finance Consulting PowerPoint Template
PowerPoint Templates
Premium
-
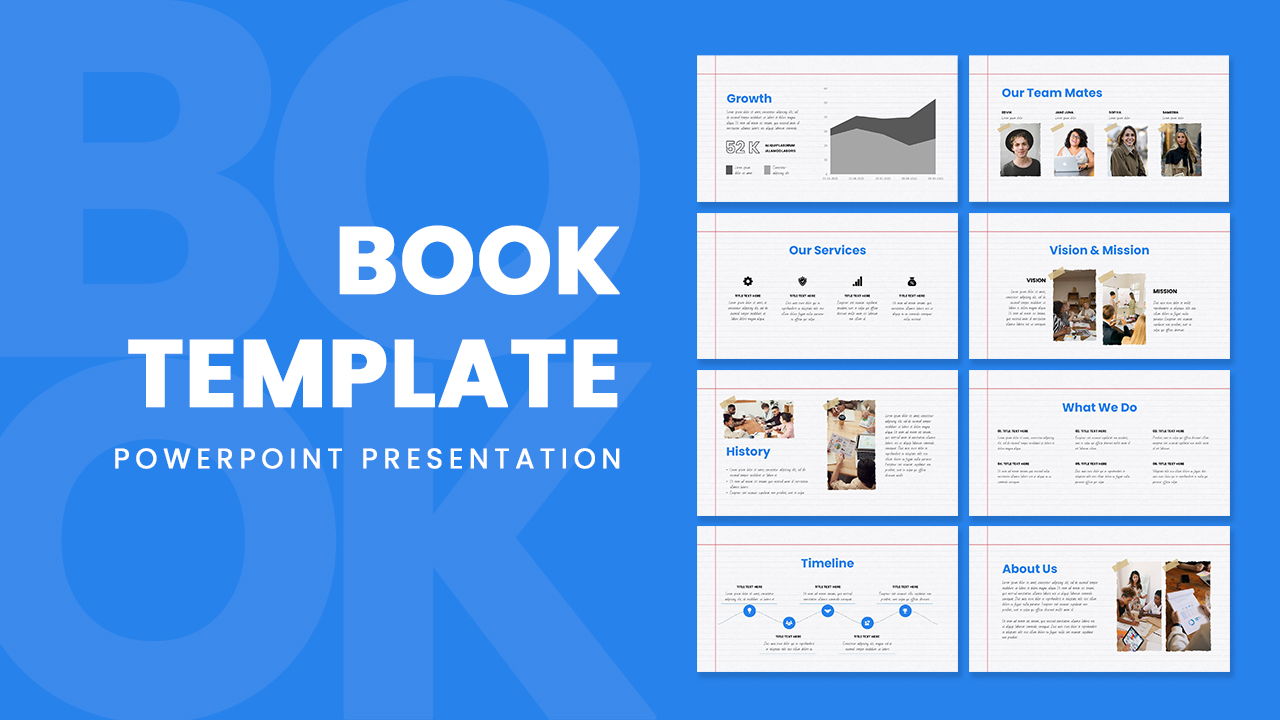
Free PowerPoint Book Template
Free slides
Free
-
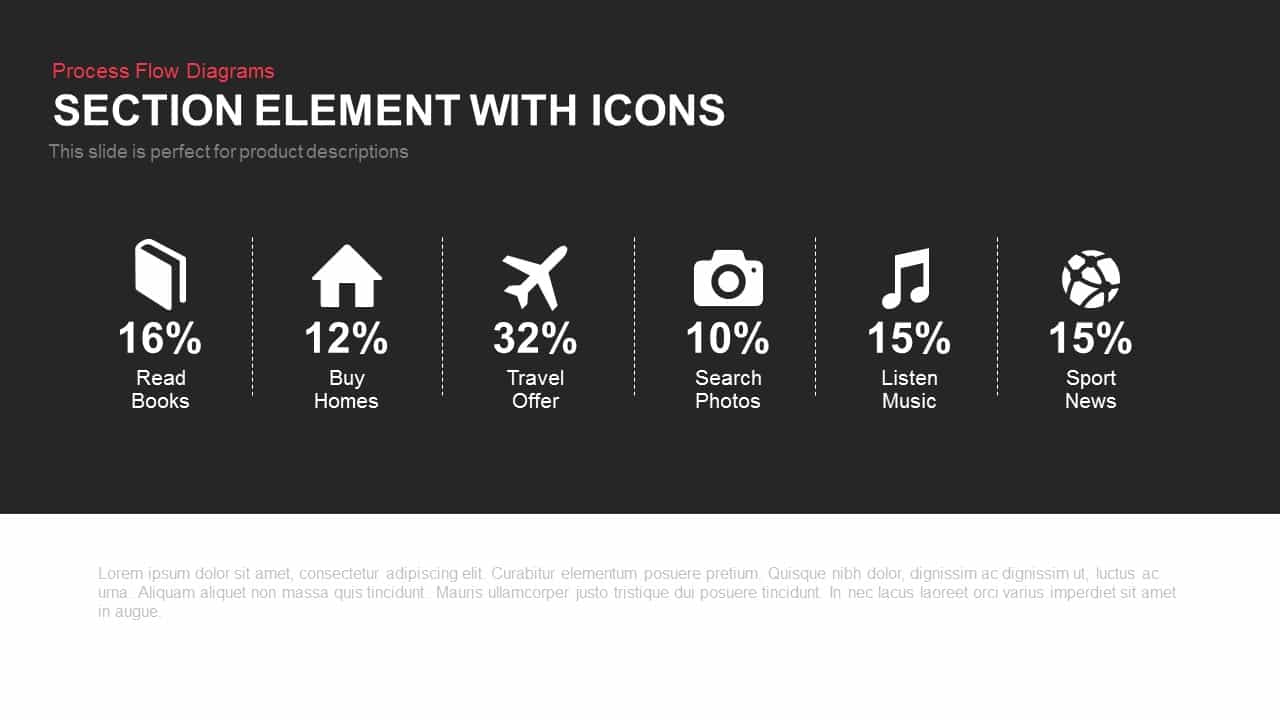
Section Element with Icons
Infographic
Premium
-
Creative Studio PowerPoint Template
PowerPoint Business Templates
Premium
-
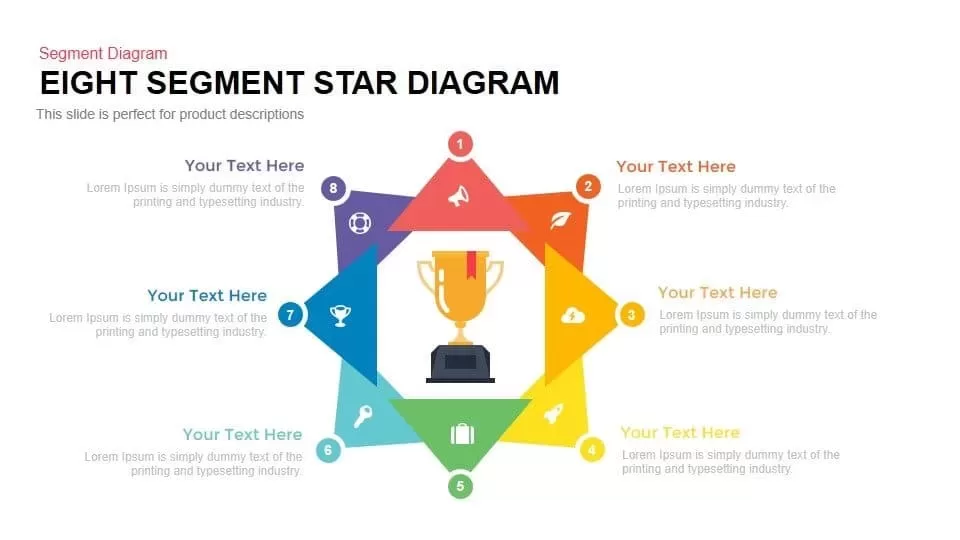
8 Segment Star Diagram Template for PowerPoint and Keynote
Infographic
Premium
-

Free Teacher’s Week Plan PowerPoint Template
PowerPoint Templates
Free
-
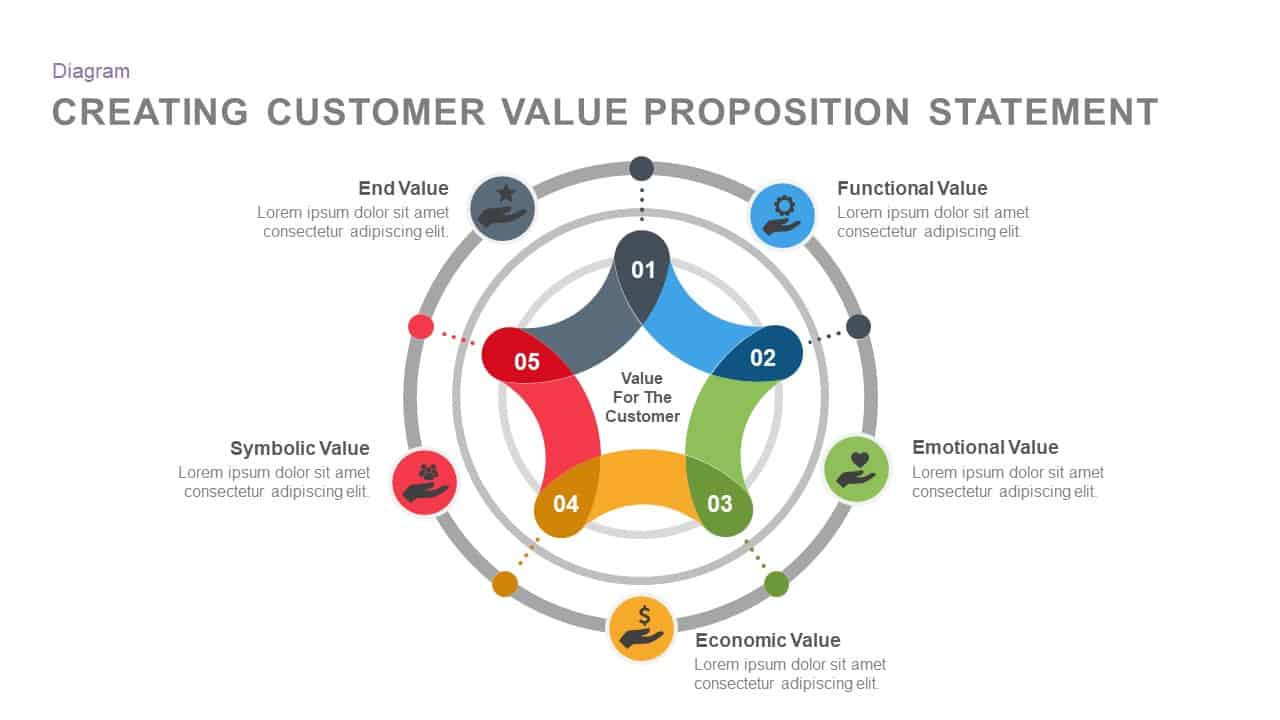
Creating Customer Value Proposition Statement Template for PowerPoint and Keynote
Business Models
Premium
-
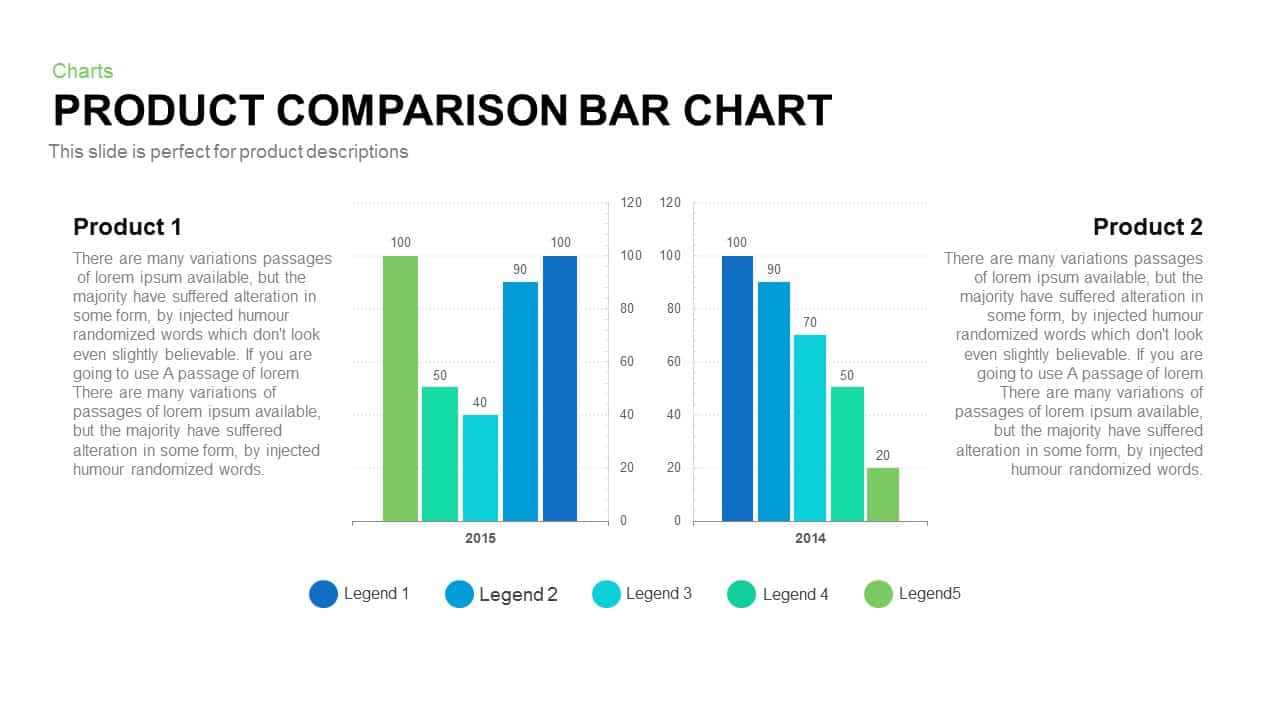
Product Comparison Bar Chart Template for PowerPoint and Keynote
PowerPoint Charts
Premium
-
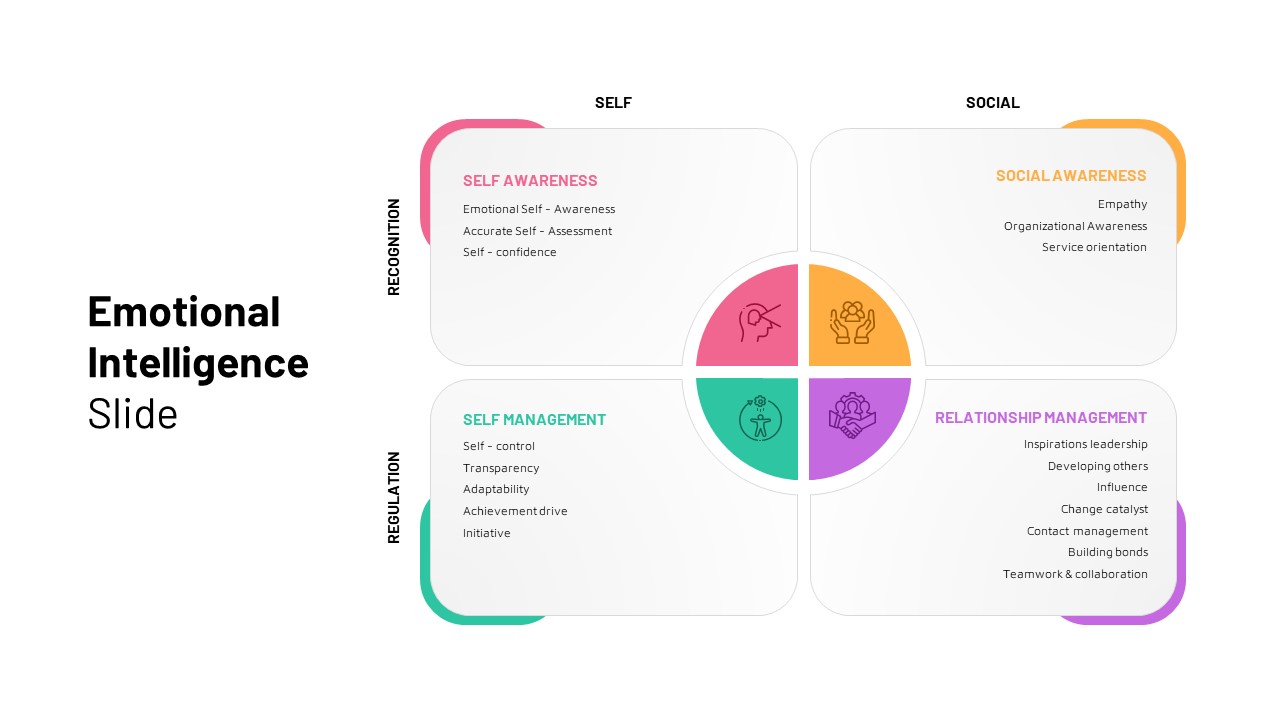
Emotional Intelligence Slide
PowerPoint Templates
Premium
-
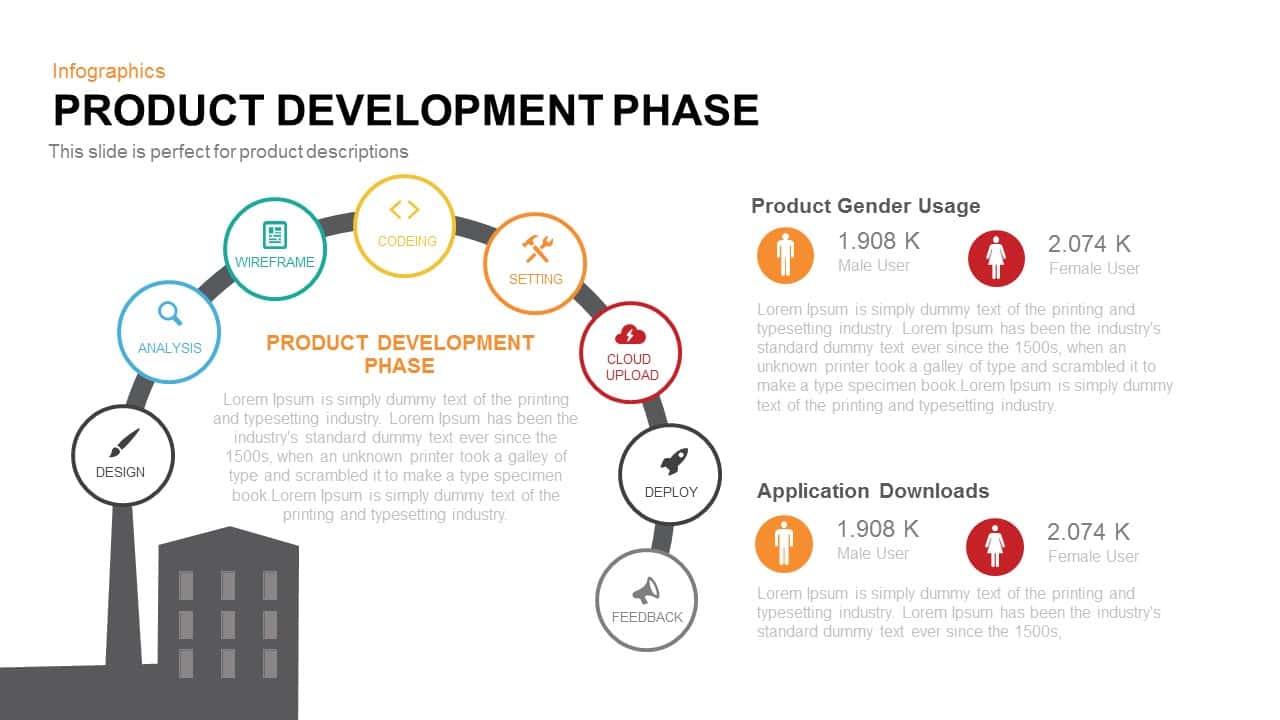
Product Development Phase PowerPoint Template and Keynote
Infographic
Premium
-
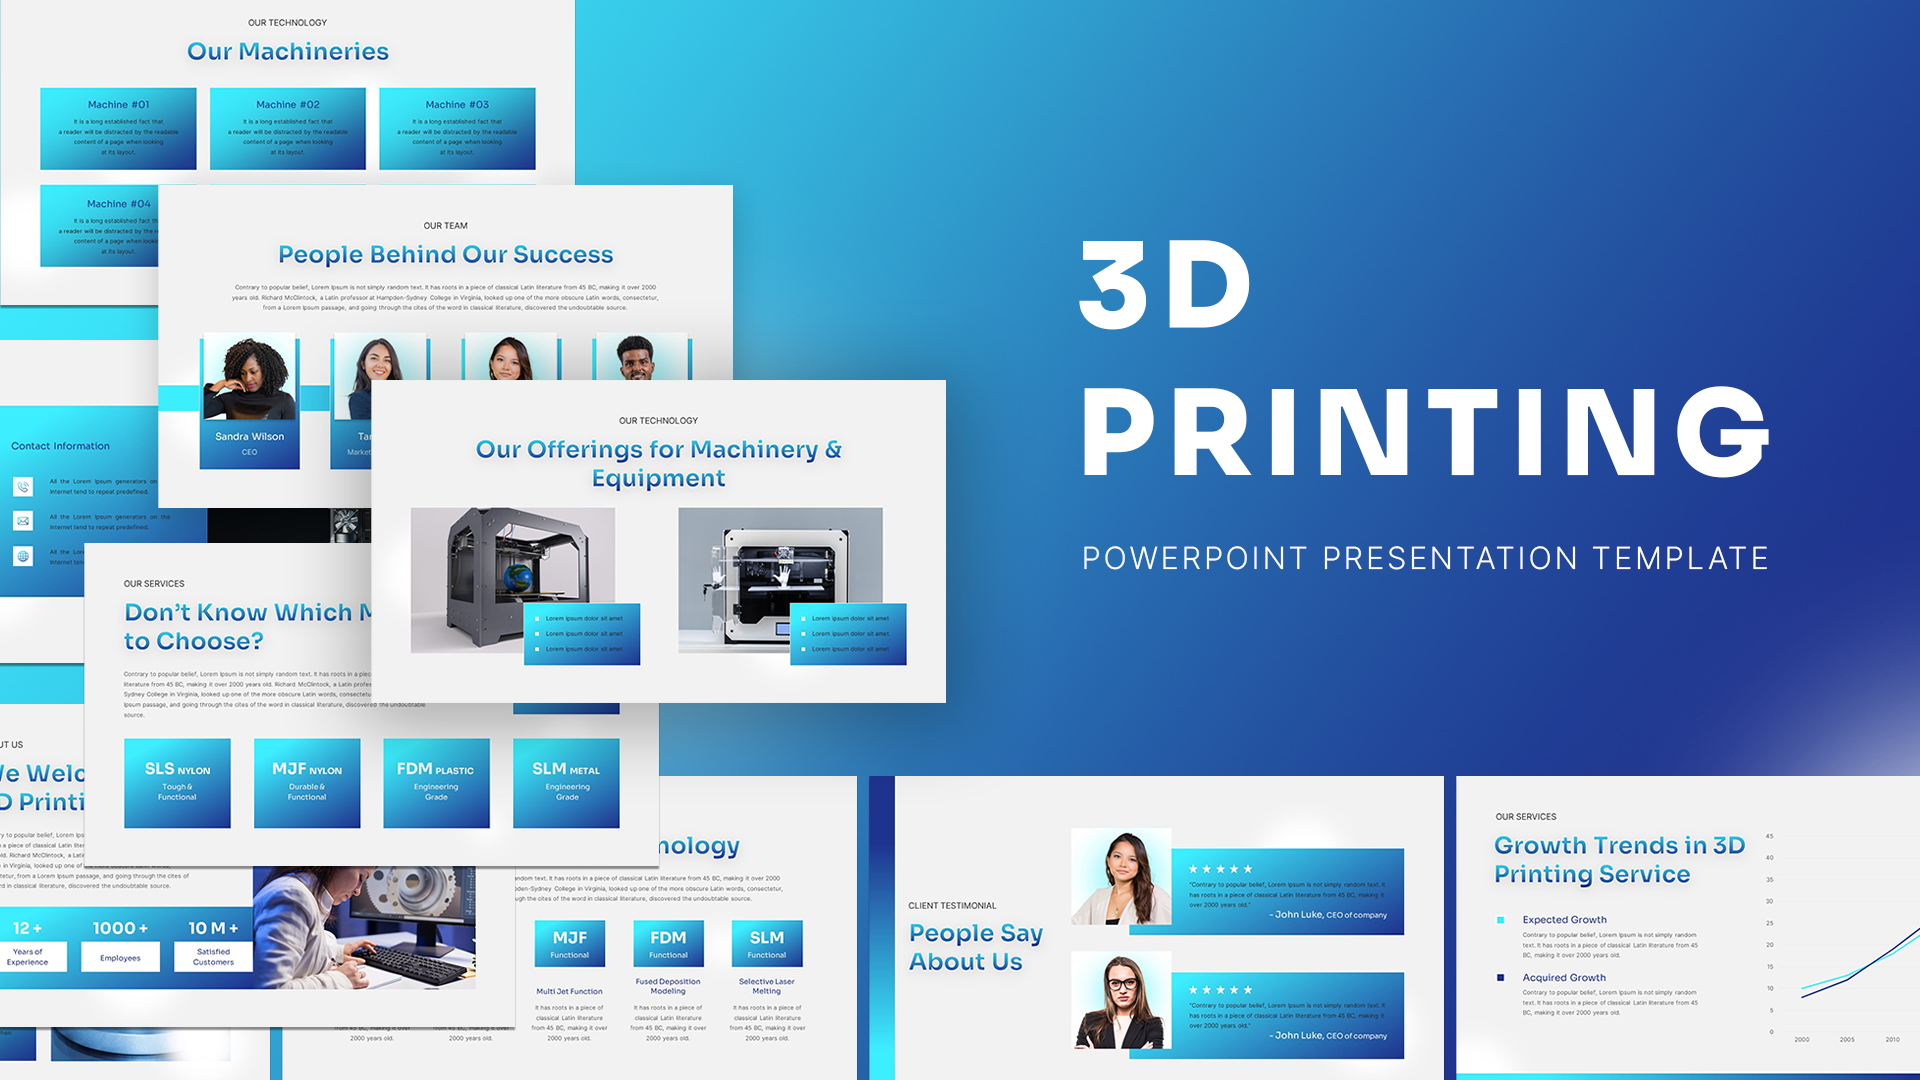
3D Printing Deck PowerPoint Template
PowerPoint Templates
Premium
-
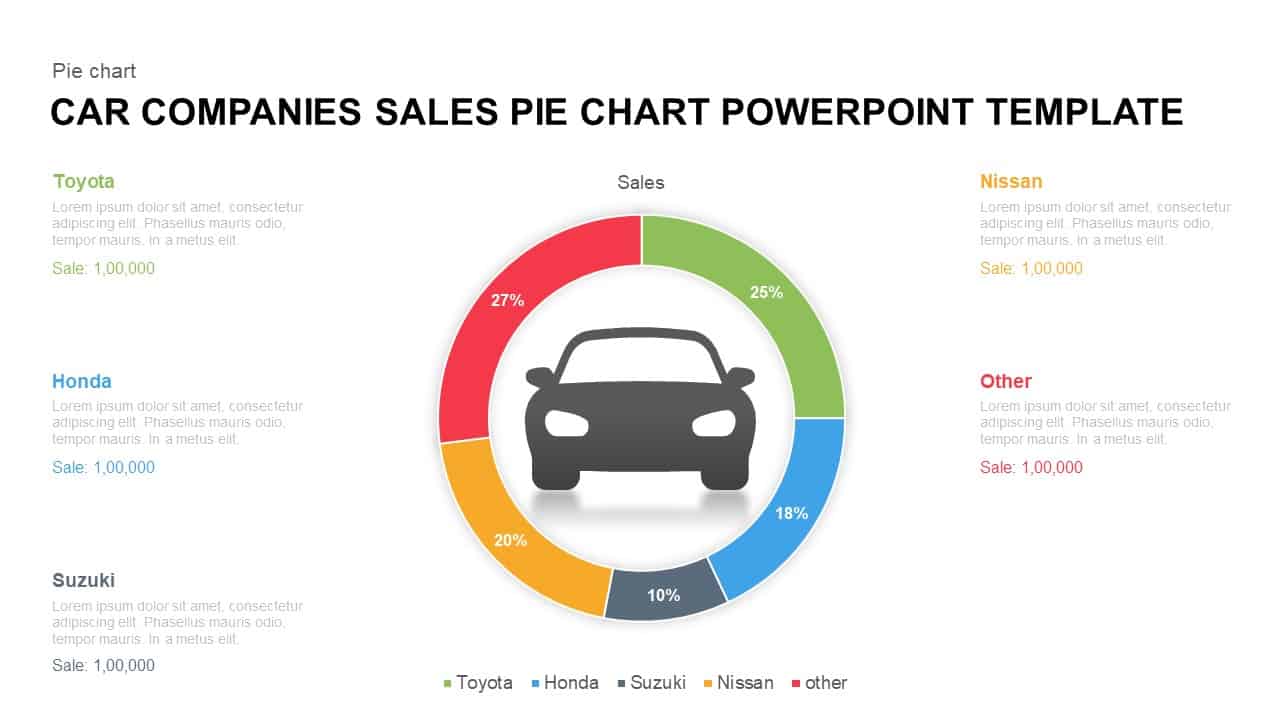
Car Companies Sales Pie Chart Template for PowerPoint & Keynote
Column and Bar chart
Premium
-
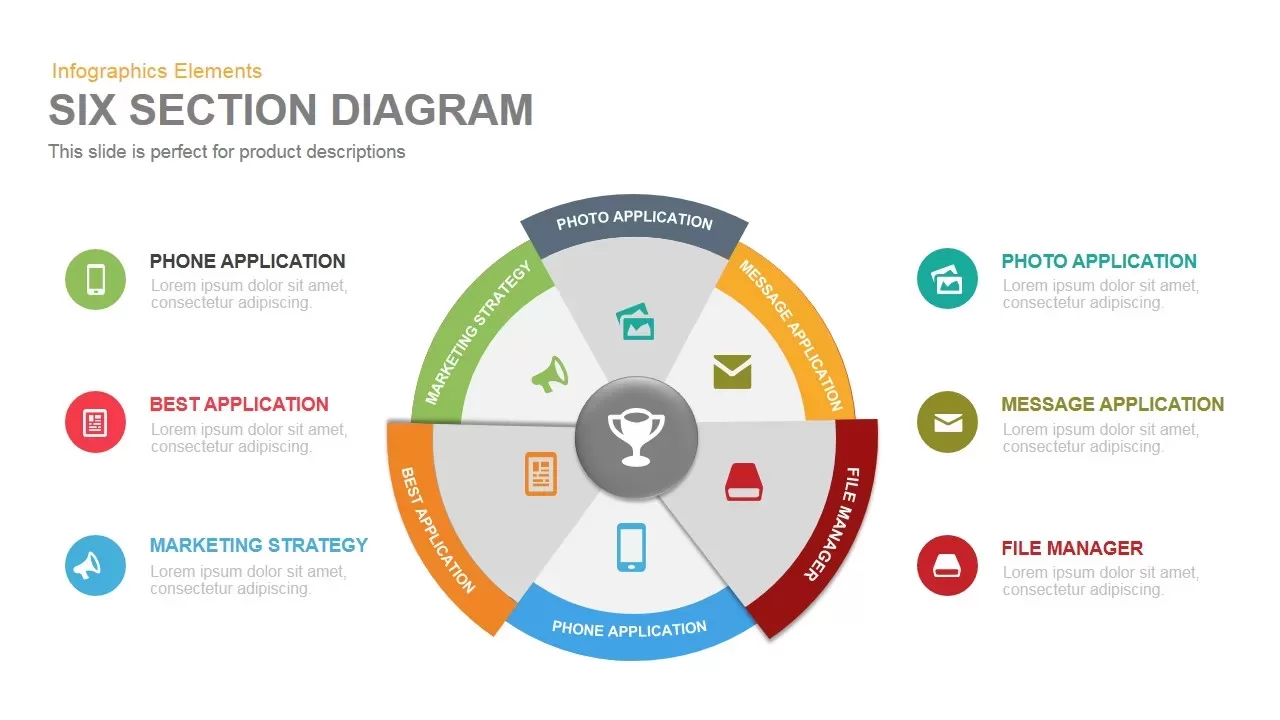
6 Section Diagram PowerPoint Template and Keynote Slide
Circular Diagrams
Premium
-
Corporate PowerPoint Presentation Template
PowerPoint Business Templates
Premium
-
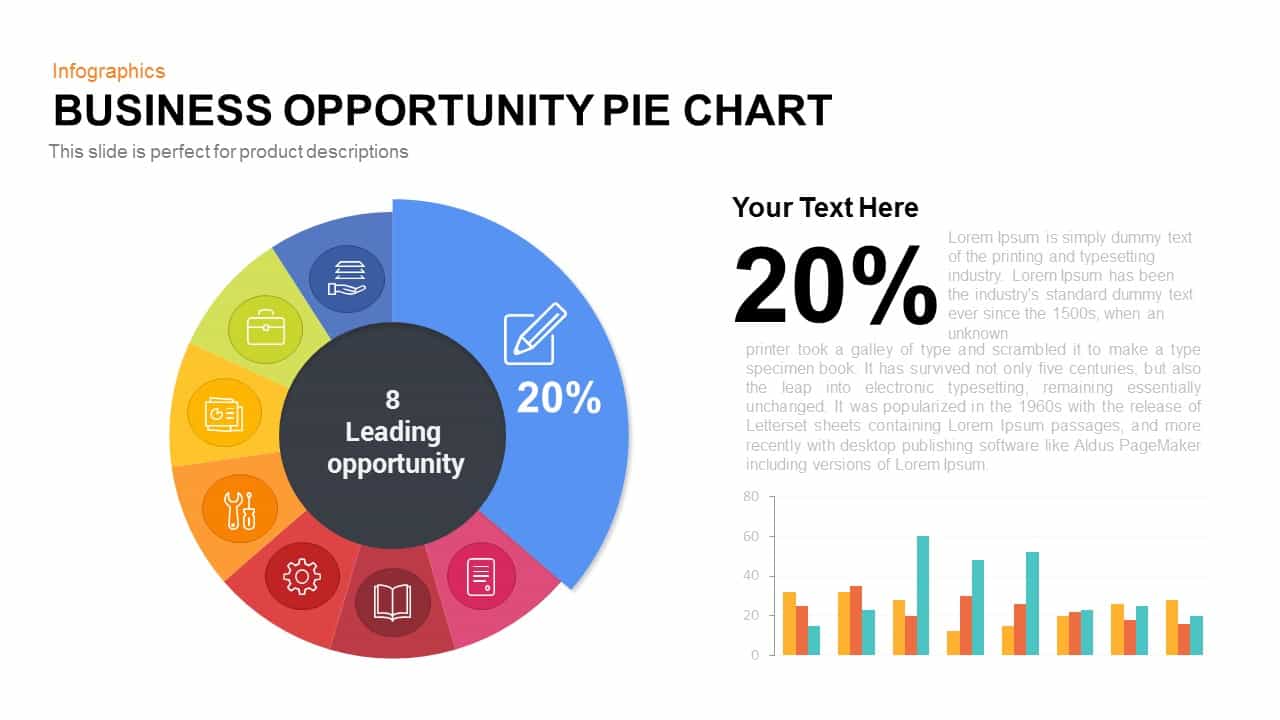
Business Opportunity PowerPoint Pie-Chart Template
Business Models
Premium
-

Radial Bar Chart PowerPoint Templates and Keynote Slides
PowerPoint Charts
Premium
-
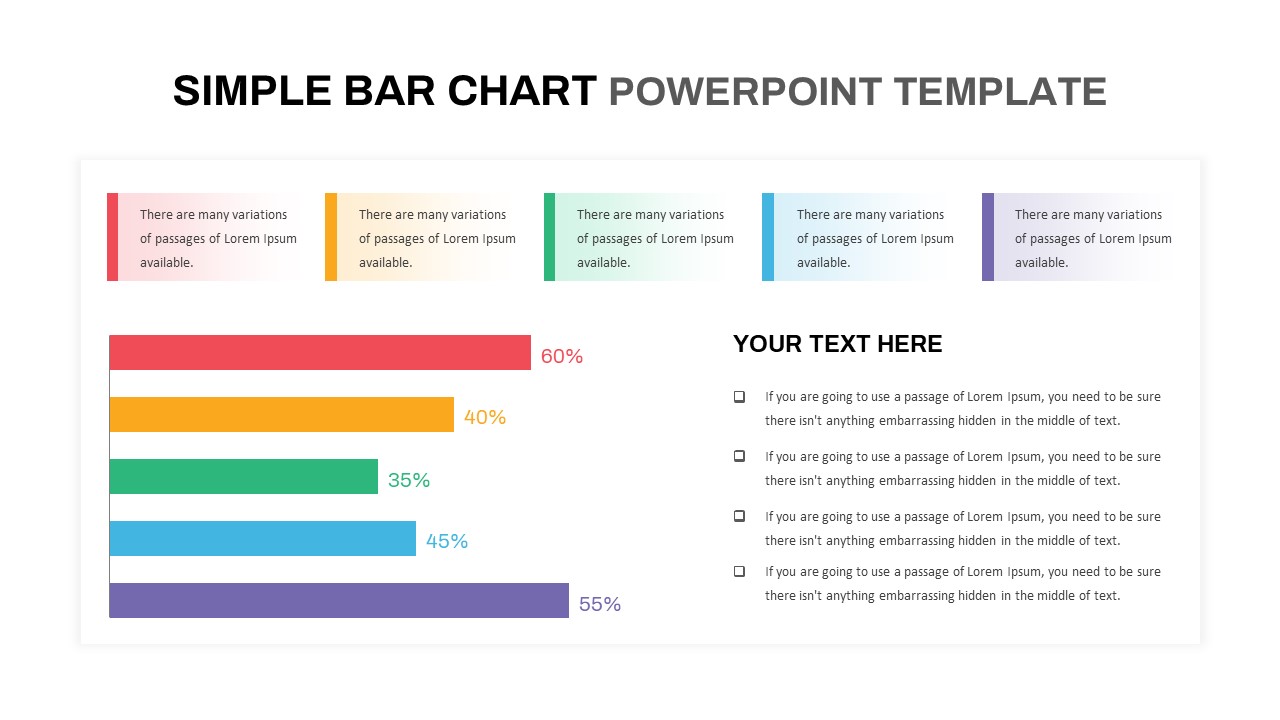
Simple Bar Chart PowerPoint Template
Column and Bar chart
Premium
-

Mekko Chart Template
PowerPoint Templates
Premium
-
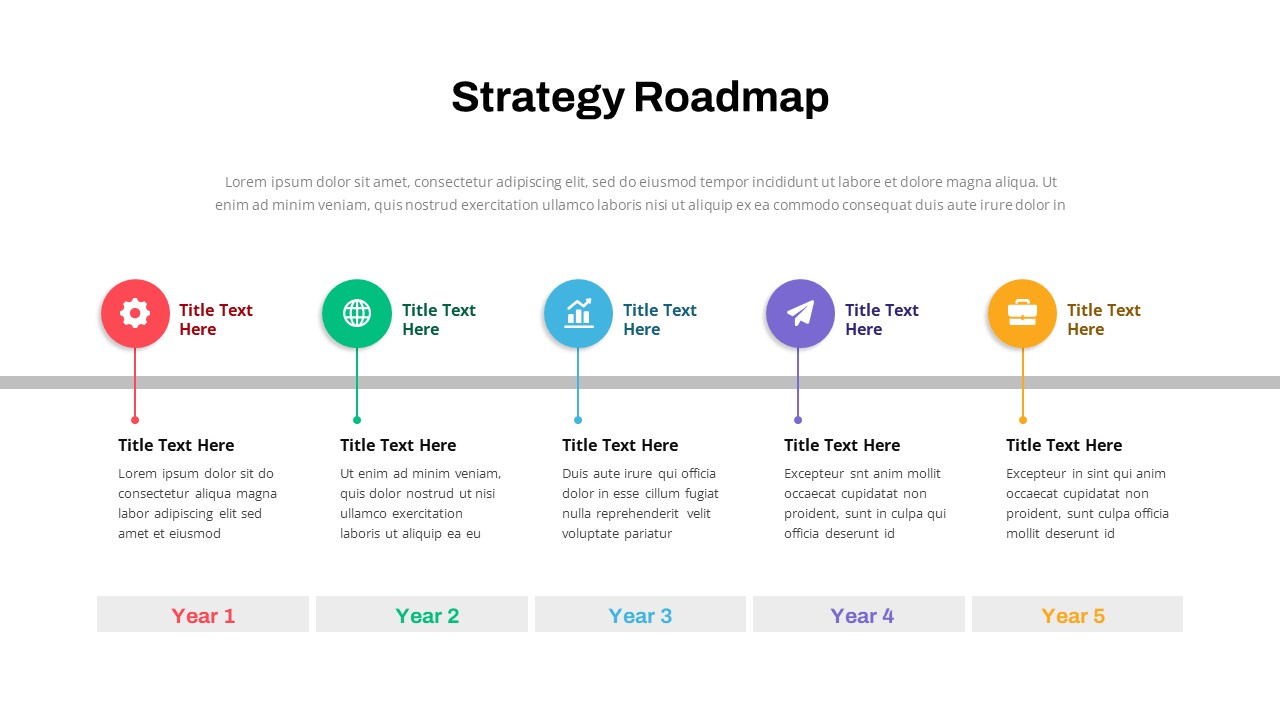
Data Strategy Roadmap PowerPoint Template
PowerPoint Templates
Premium
-
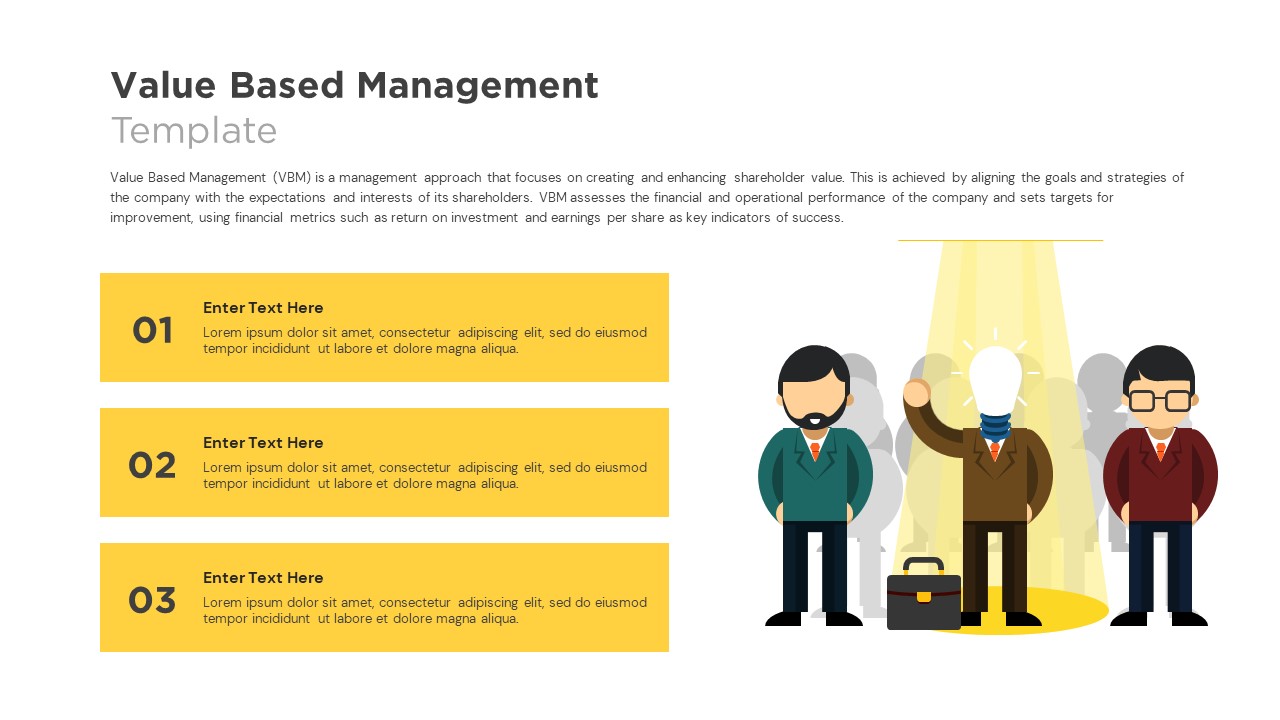
Value Based Management Template
PowerPoint Templates
Premium
-
Eight Section Representation Template for PowerPoint and Keynote
Circular Diagrams
Premium
-
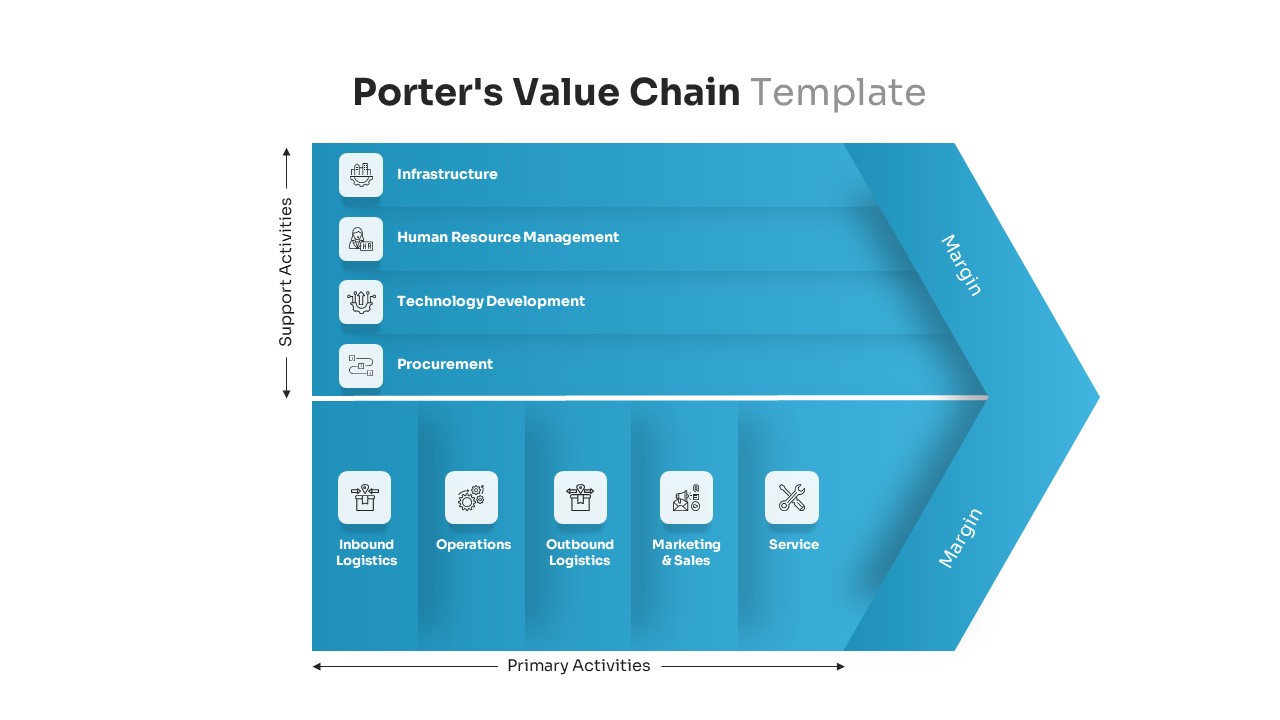
Porter’s Value Chain Template for PowerPoint & Keynote
Diagrams
Premium
-
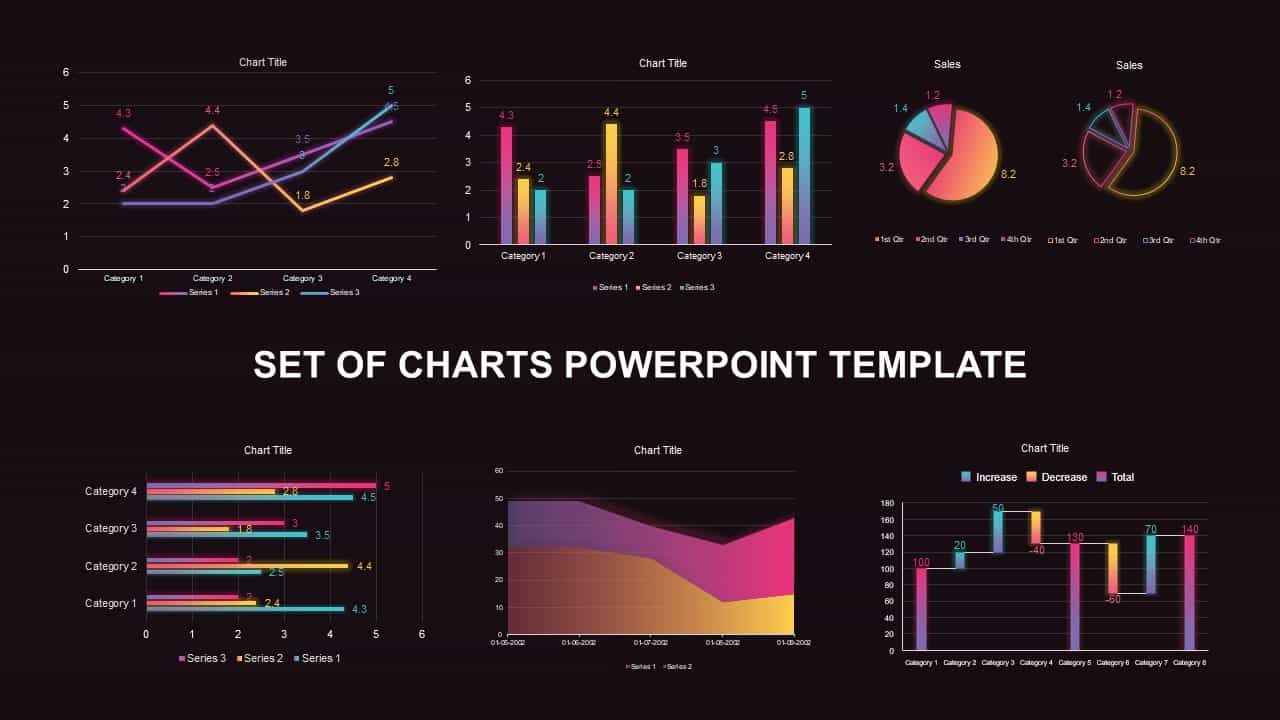
Set of Chart PowerPoint Template and Keynote Diagram
PowerPoint Charts
Premium
-
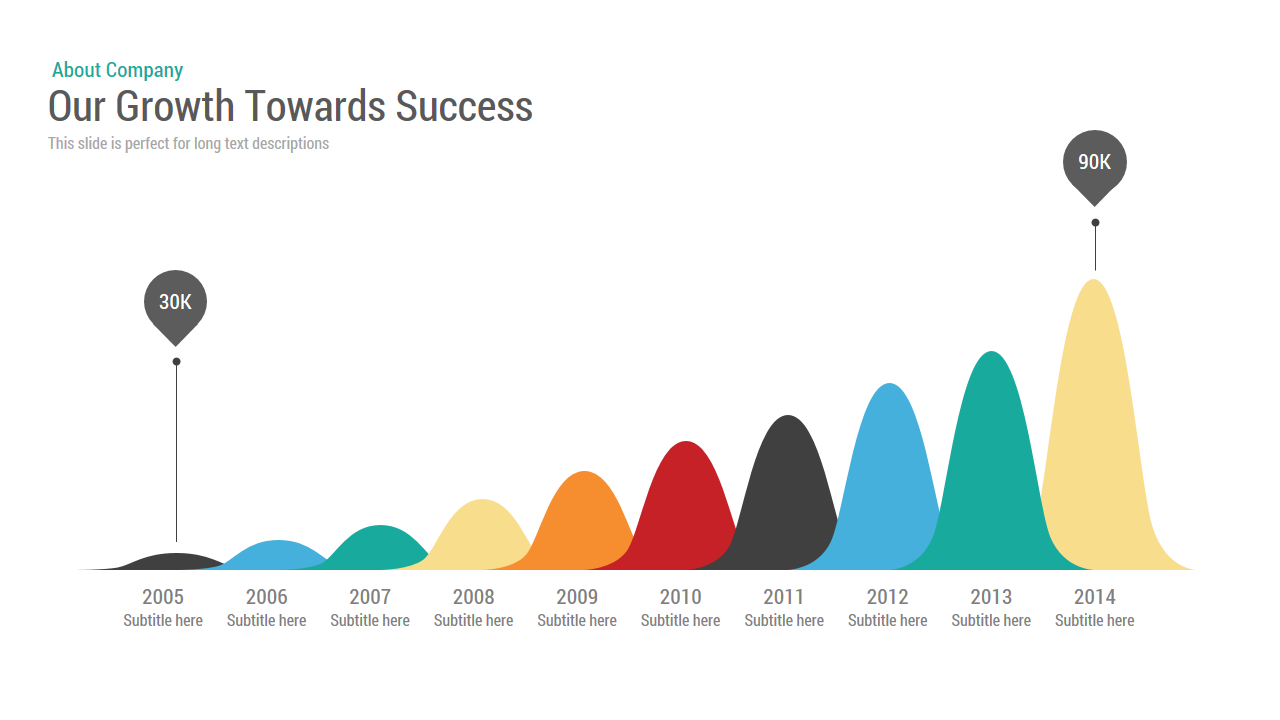
Business Growth Chart Template for PowerPoint and Keynote
Business Models
Premium
-
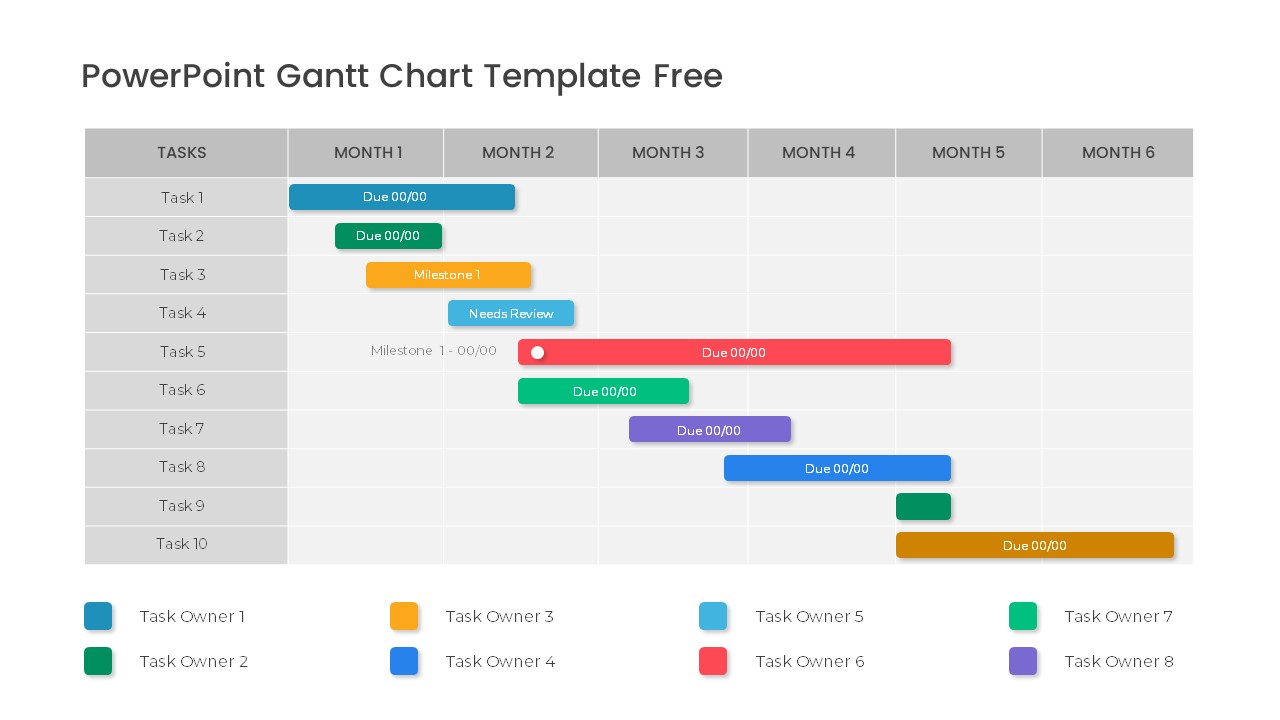
Free PowerPoint Gantt Chart Template
PowerPoint Charts
Free
-
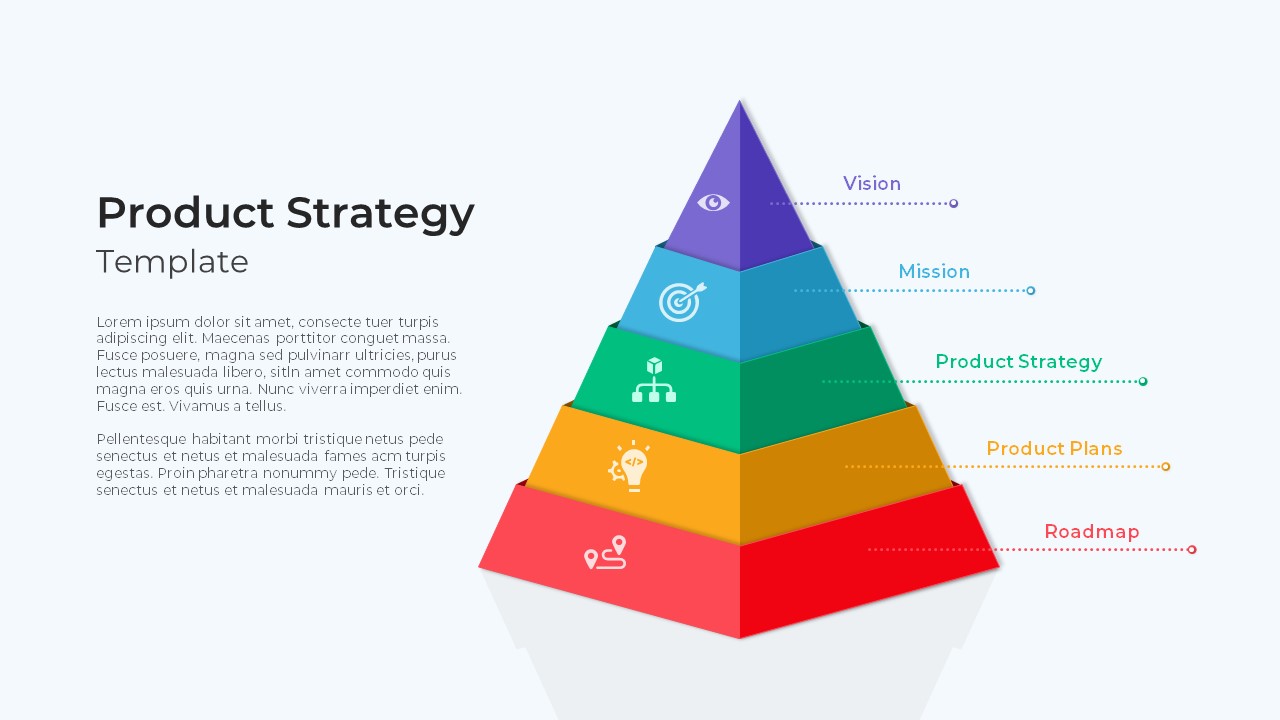
Product Strategy PowerPoint Template
Pyramid
Premium
-
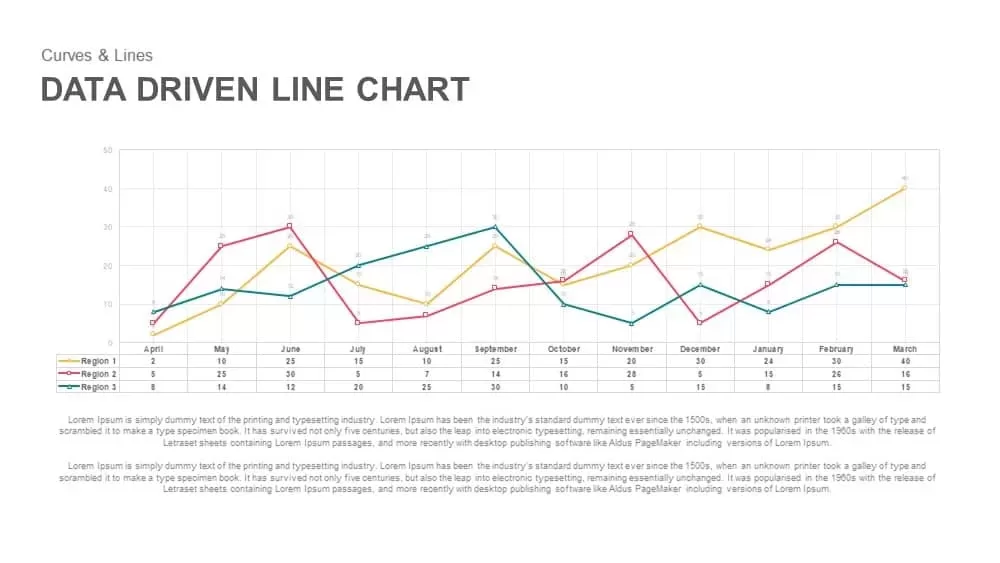
Data Driven Line Chart Template for PowerPoint & Keynote
Curves and Lines
Premium
-
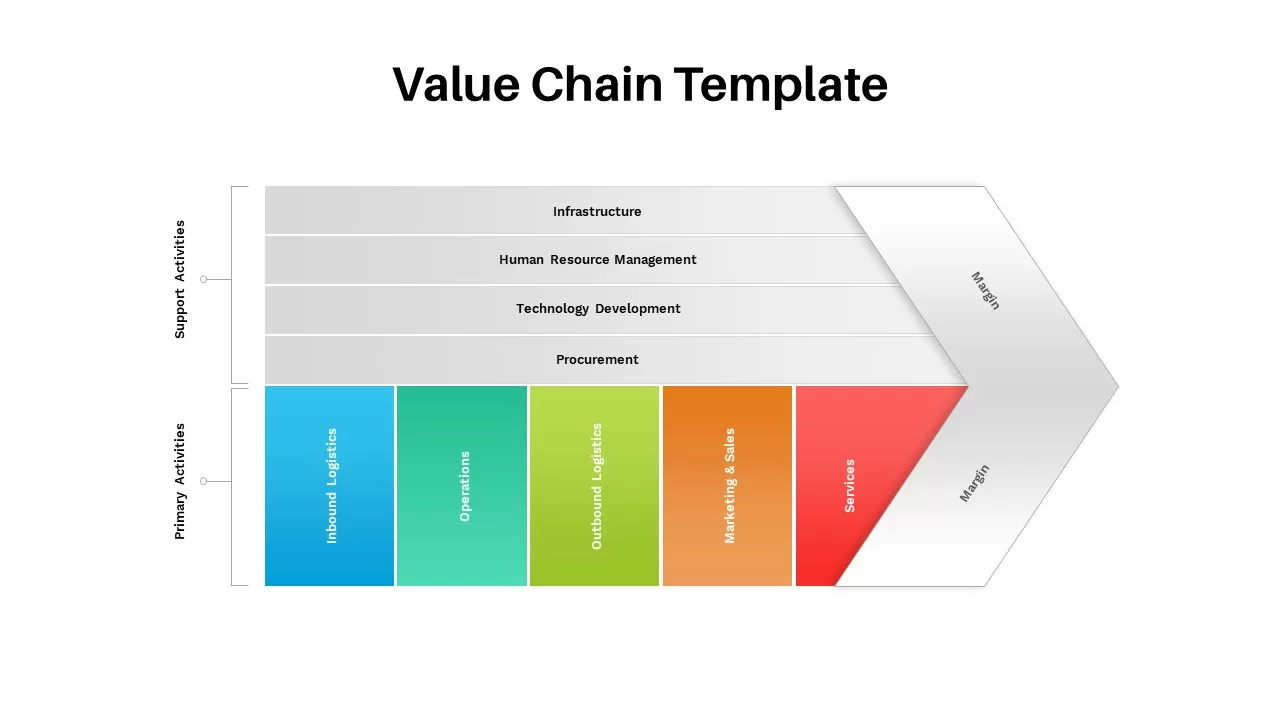
Value Chain Template
Arrow Diagrams
Premium
-
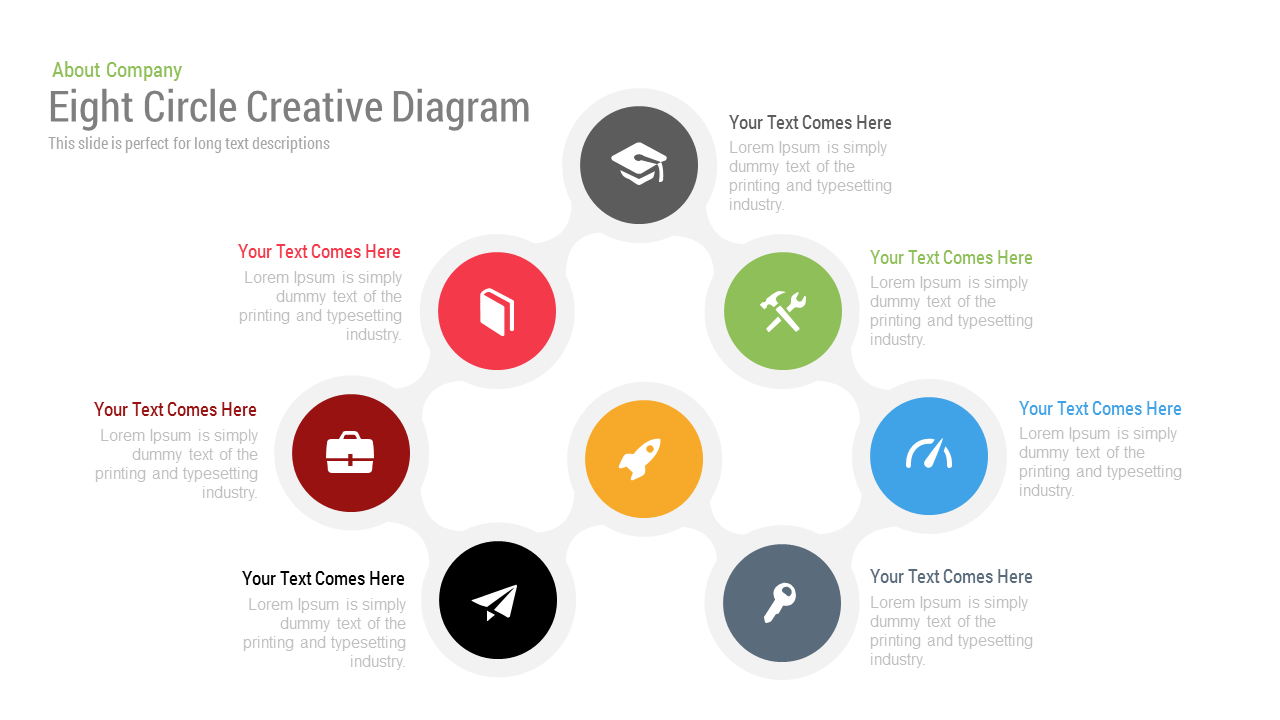
8 Circle Creative Diagram Free PowerPoint Template and Keynote Slide
Free PowerPoint Templates
Free