6 Output Process Diagram PowerPoint Template
The
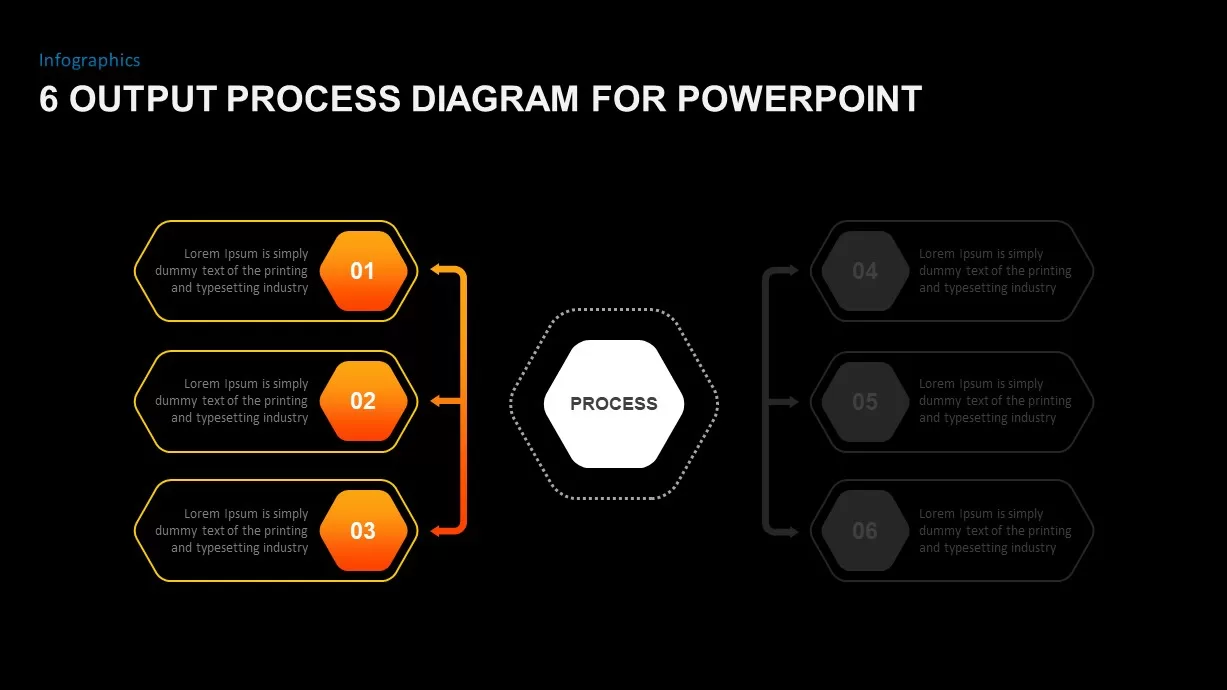
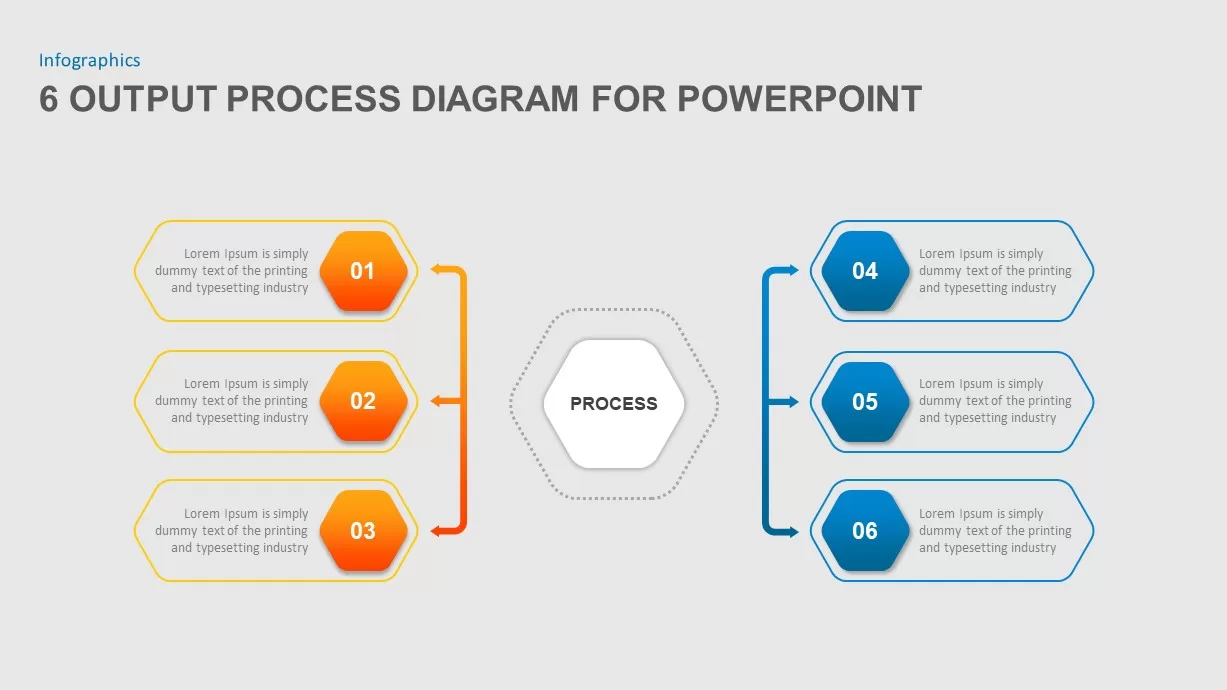
6 output process diagram for PowerPoint contains manifold alterations of a 6 section PowerPoint design. The discolouring images give a modified flowchart look in the end. When it combines the two parts together it will become a perfect infographic to display 6 elements of a concept. Its looks like a simple tree diagram to present the concept on both sides. The users can modify the slide and insert an additional number of sections or delete some, based on presentation necessities. However, this diagram has 3 variants, except the master template. These variants are the major highlight because you can project each element with separate text boxes. Furthermore, the template is fully editable to change the colours and size of substances. For instance, select the figure and modify colour from the shape fill. You can add a topic on the centre and insert infographic icons instead of numbers.
The
six output process diagram PowerPoint template is a common slide for business presentations and academic presentations. Business process and project schedules can be shown using the hexagon shape
PowerPoint callouts or the product features can be depicted by analyzing the comparison. If you are presenting product features before your viewers, you can select a miniature shape of your product or brand by the way you can insert the logo of your brand on the centre portion of the 6 section diagram. So, it’s an alternative or product description. Besides,
company profile presentations including company history and vision and mission can be portrayed using six hexagon flat boxes. The task management elements can be displayed using the
PowerPoint template. Task management is the route of managing tasks through their life cycle. It comprises planning testing, tracking and reporting.
Download 6 output process diagram for PowerPoint presentation and make necessary changes to the features according to your subject or presentation topic. PowerPoint presentation needs flexible and minimal designs to attract and hold the attention of the viewers.