search

Essentials

Must-have decks for quick wins

By Industry

Professionally tailored slides for every sector

By Style

Minimal, modern and creative designs

By Topic

Explore slides curated by purpose and theme

TimelineTimelineRoadmapRoadmapStrategyStrategyCompany ProfileCompany ProfileTableTableComparisonComparisonSWOTSWOTAgendaAgendaListListArrowArrowMapsMapsProcessProcessStagesStagesCircularCircularFunnelFunnelTeamTeamOrg ChartOrg Chart

FinanceFinanceAccountingAccountingKPIKPIRevenueRevenueTechnologyTechnologySoftware DevelopmentSoftware DevelopmentAdvertisingAdvertisingBrand StrategyBrand StrategyCustomer journeyCustomer journeyHealthHealthMedicalMedicalNursingNursing

Business PlanBusiness PlanBusiness StrategyBusiness StrategyBusiness ProcessBusiness ProcessBusiness ProposalBusiness ProposalDigital MarketingDigital MarketingMarketing FunnelMarketing FunnelCustomer ExperienceCustomer ExperienceGantt chartGantt chartRisk ManagementRisk ManagementScrumScrumProject StatusProject StatusRecruitmentRecruitmentEmployee performanceEmployee performanceLeadershipLeadershipAI PowerPoint TemplateAI PowerPoint TemplateInformation TechnologyInformation TechnologyCloud ComputingCloud ComputingMachine LearningMachine Learning

AI Presentation Maker

Install the Windows plugin for quick access to templates and design tools.

AI Infographics Maker

Use our Office 365 add - in to access templates directly from the cloud.

Exe Version

Install the Windows plugin for quick access to templates and design tools.

Office 365

Use our Office 365 add - in to access templates directly from the cloud.

Mac Version

Get the Mac plugin to easily browse, insert, and customize templates and visuals within PowerPoint.

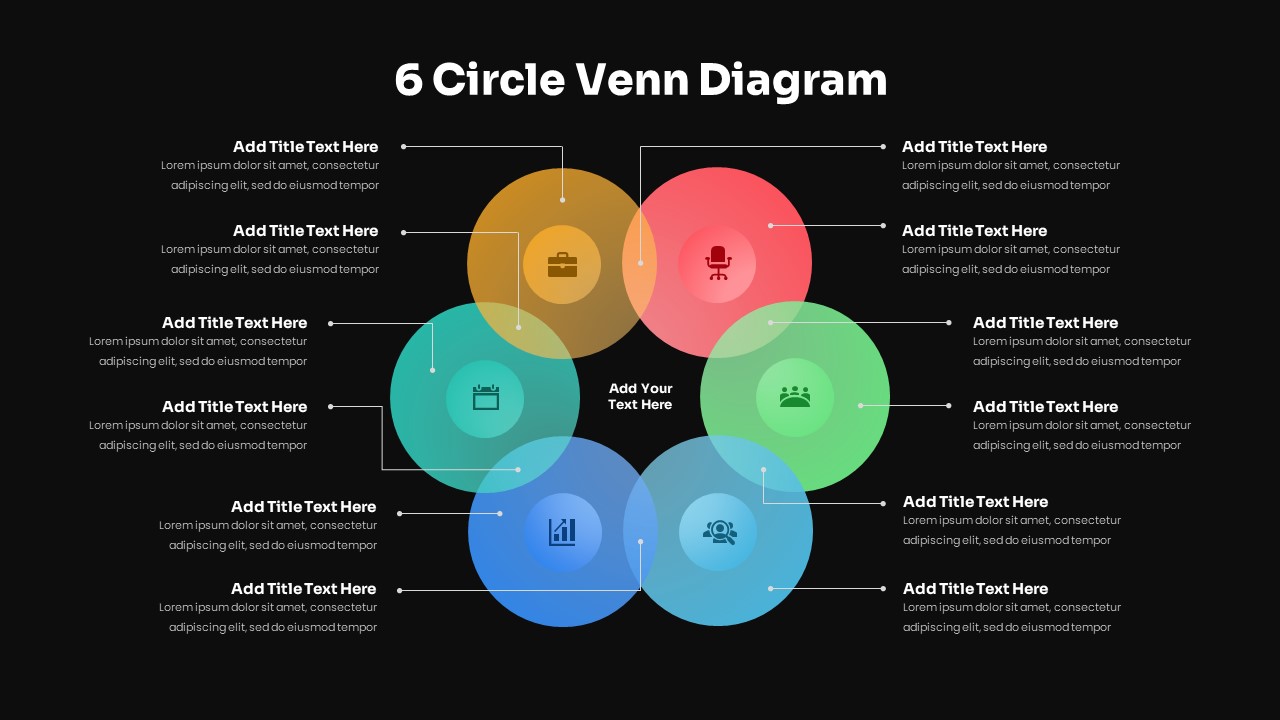
6 Circle Venn infographic template
This template is part of a deck featuring multiple slides. To check out all slides, click on See All. See All round right arrow
6 Circle Venn Diagram PowerPoint Template

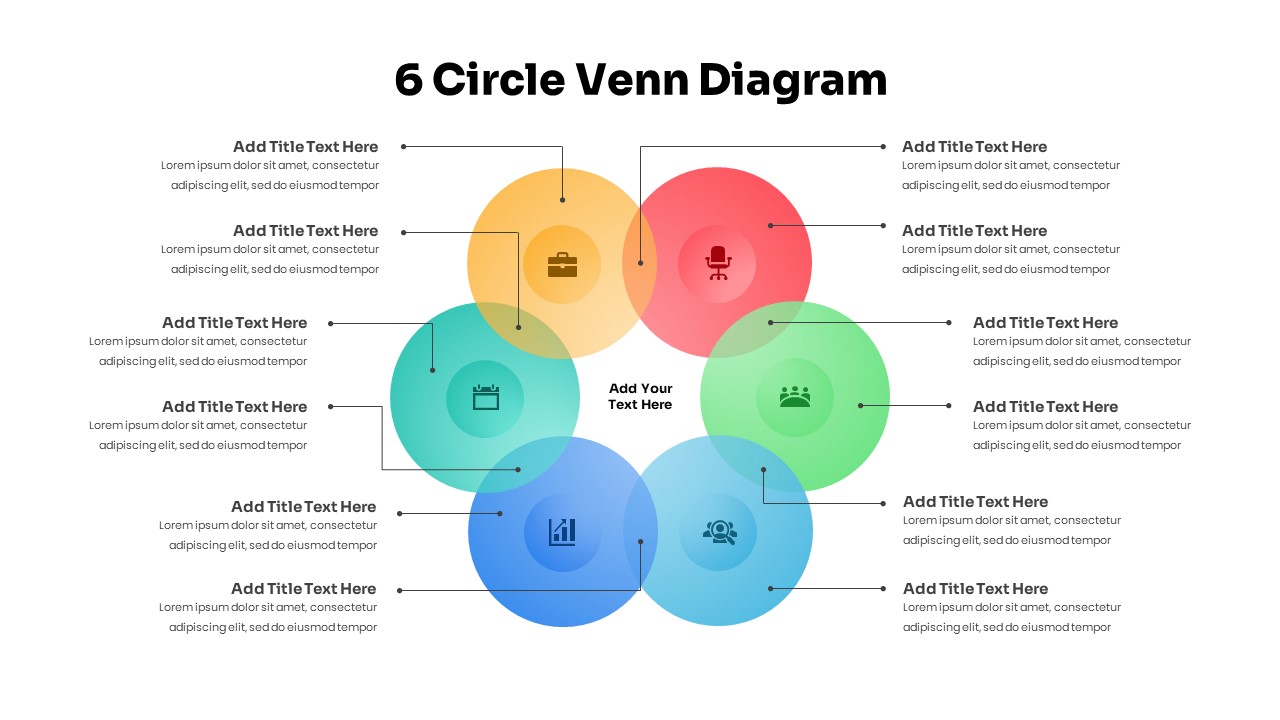
6 circle Venn Diagram PowerPoint Template is a multi-step comparison diagram illustrating intersecting circle shapes to show the relationship among six groups. Usually, a Venn diagram presents logical relationships or dissimilarities between two or more items. This Venn also allows users to produce engaging presentations by comparing complex data sets. Each PPT circle in the diagram overlaps with one another. There is countless use for Venn diagram powerpoint templates, from research purposes to teach elementary set theory. Venn diagrams are the perfect option for statistics presentations and math presentations. These editable diagrams in colorful PowerPoint design include text and graphics in the six-circle Venn diagram template. 6 circle Venn diagram template for PowerPoint is an educational template for learning purposes. So, teachers, researchers, business managers, and any professionals can use the PowerPoint Venn diagram for multiple purposes. This Venn diagram allows users to present similarities and differences between items. Each PPT circle is colored red, light green, light blue, blue, green, and yellow. In addition, all the rings or circles have three text areas that enable you to create similarities and differences. Further, the circles have infographic clipart icons that help distinguish the topic. Additionally, text placeholders are indicated by thin lines, making you understand the subject impeccably. Like other PowerPoint templates, this Venn diagram PPT allows feature changes. Use complex Venn diagrams for displaying multiple data sets. Alternatively consider exploring 5 circle venn diagram powerpoint template.