3d Spheres Fill Level Diagram for PowerPoint
3D sphere fill level infographics for PowerPoint presentation is a modern PowerPoint to show segmented distributions and proportions of a phenomenon using aesthetic model chart shows. Normally, data presentation needs typical charts, graphs, diagrams, and other scientific ways showing statistics. Here, the same can be done with the sophisticated 3D sphere charts as modulated graphical shows. this
3d ppt template is an alternative of pie chart PowerPoint, line graph PowerPoint, chart PowerPoint, that are widely used to show the ratio, average, percentage, correlation, and so on. Slide bazaars creatorsare always looking for modern visual graphics which guarantees the supreme attention and participation of the audiences.
The
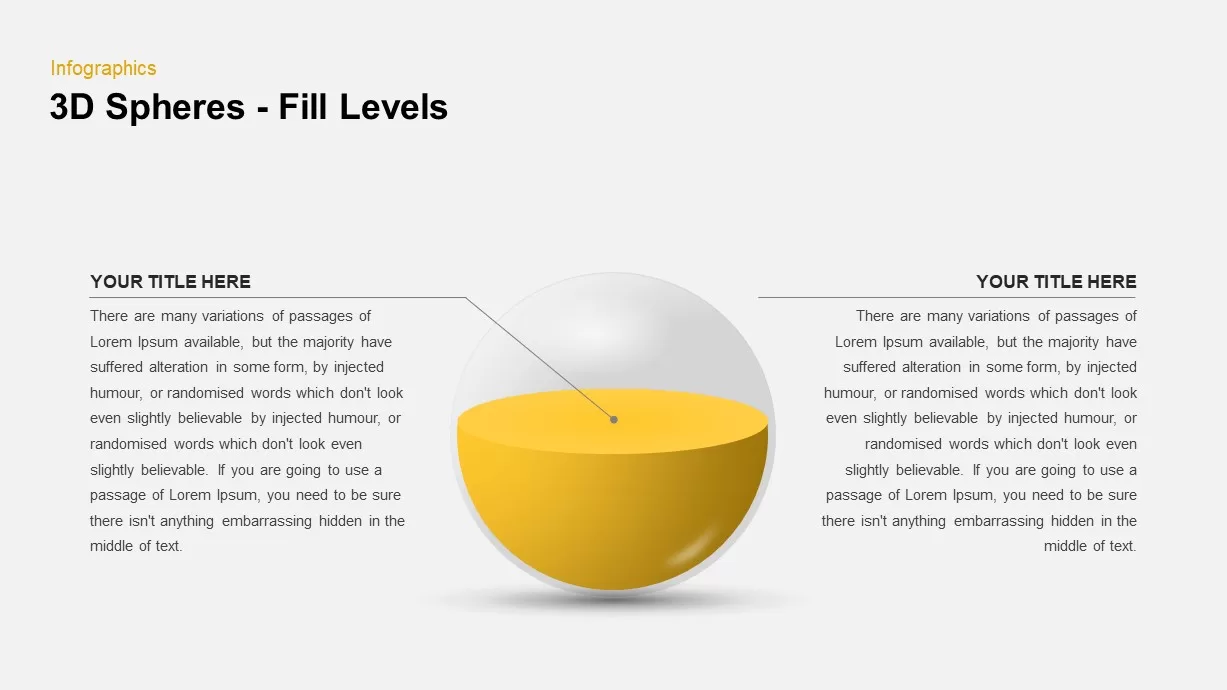
3d sphere fill level diagram PowerPoint is a modern technique of statistical presentation. It can be used as a substitute for normal bar graphs. The colorful vessels filled with the liquid in different proportions are perfect to show your sales data or the revenue development within a course of time.Data and value organized precisely and faultlessly so the user can give factual picture about the activity. Hence, the entire concepts simply transfer to the viewers.The data can be demonstrated by this modern editable graphics with high understanding.
The
3D sphere template for data presentation contains 22 visual representations with different variants. So the template is fit to present any presentation both technical and non-technical issues. It is also fit for timeline model presentations as a linear progression development or it may use to show vertical presentation with prioritized steps. Business professionals can use this diagram to illustrate market segmentation, and the financial outcomes and outlays through proportional values. Researchers are the groups whom get the service of the diagram. Both science and social science researchers can produce their reports through PowerPoint using the 3d graphic chart diagram. . It is also used to show; market capitalization, sales developments, financial outcomes and chronological progress of the business or organization. The template includes statistical models and trends.
Use
editable 3d sphere PowerPoint as a substitute for your data presentation charts.