


3D Bar Chart Infographics Template for PowerPoint and Keynote
- Version
- Download 341
- File Size 0.00 KB
- File Count 1
- Create Date January 10, 2016
- Last Updated February 15, 2024
3D Bar Chart Infographics Template for PowerPoint and Keynote
3D Bar Chart PowerPoint Template and Keynote Slide
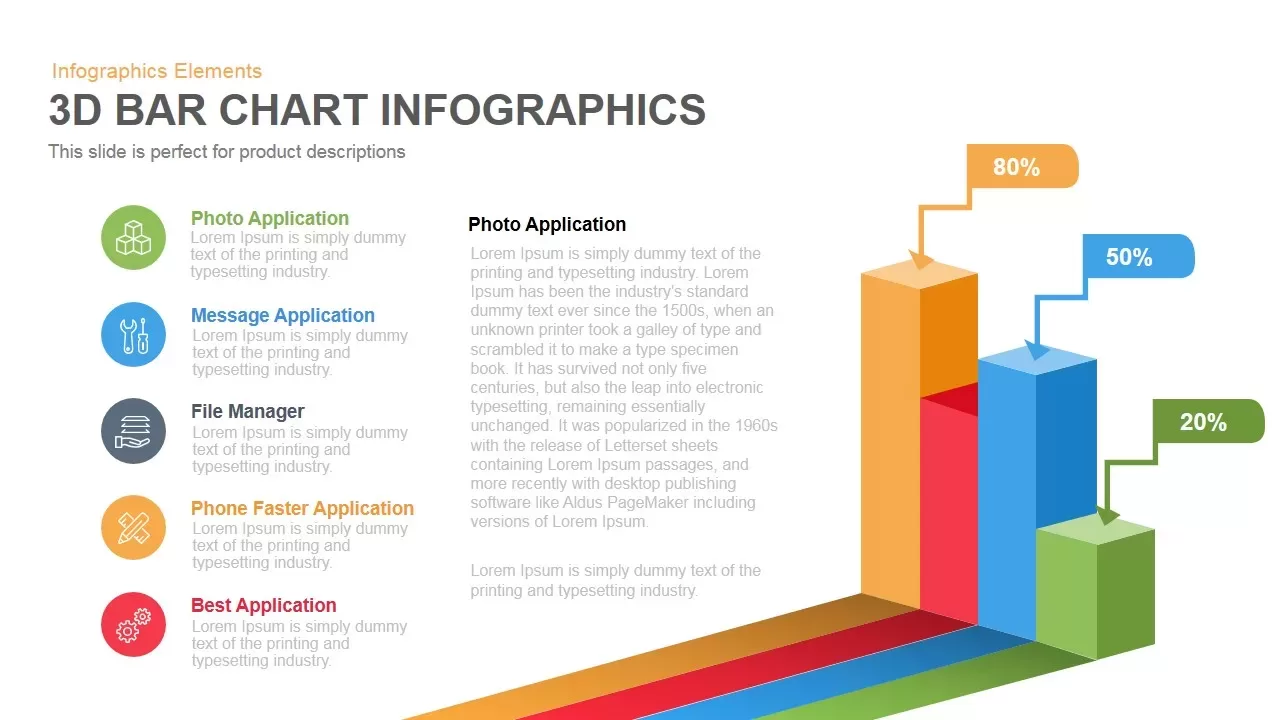
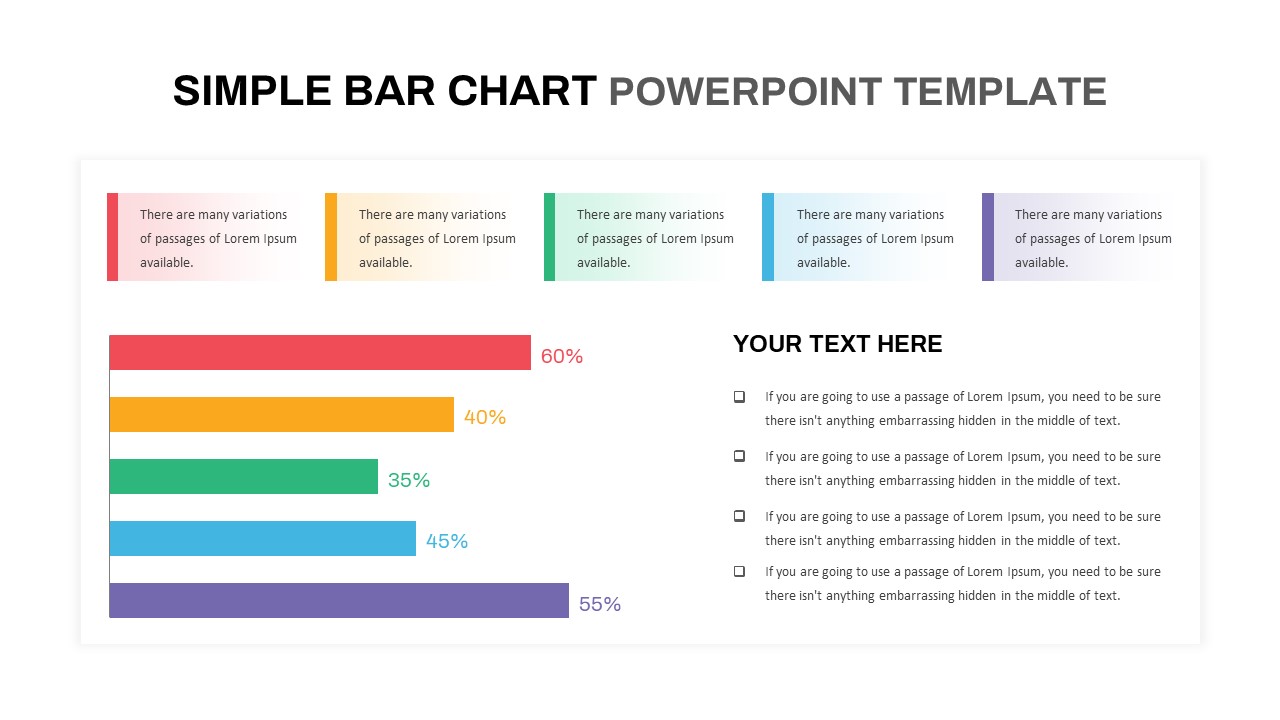
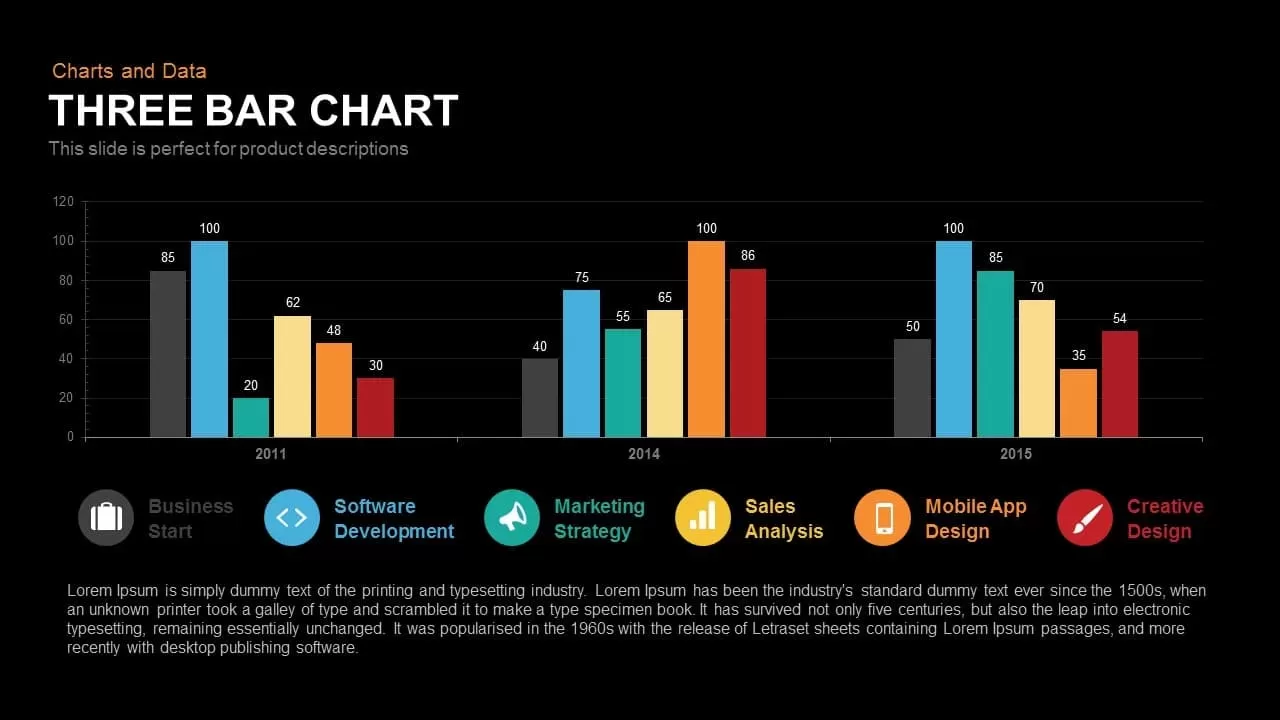
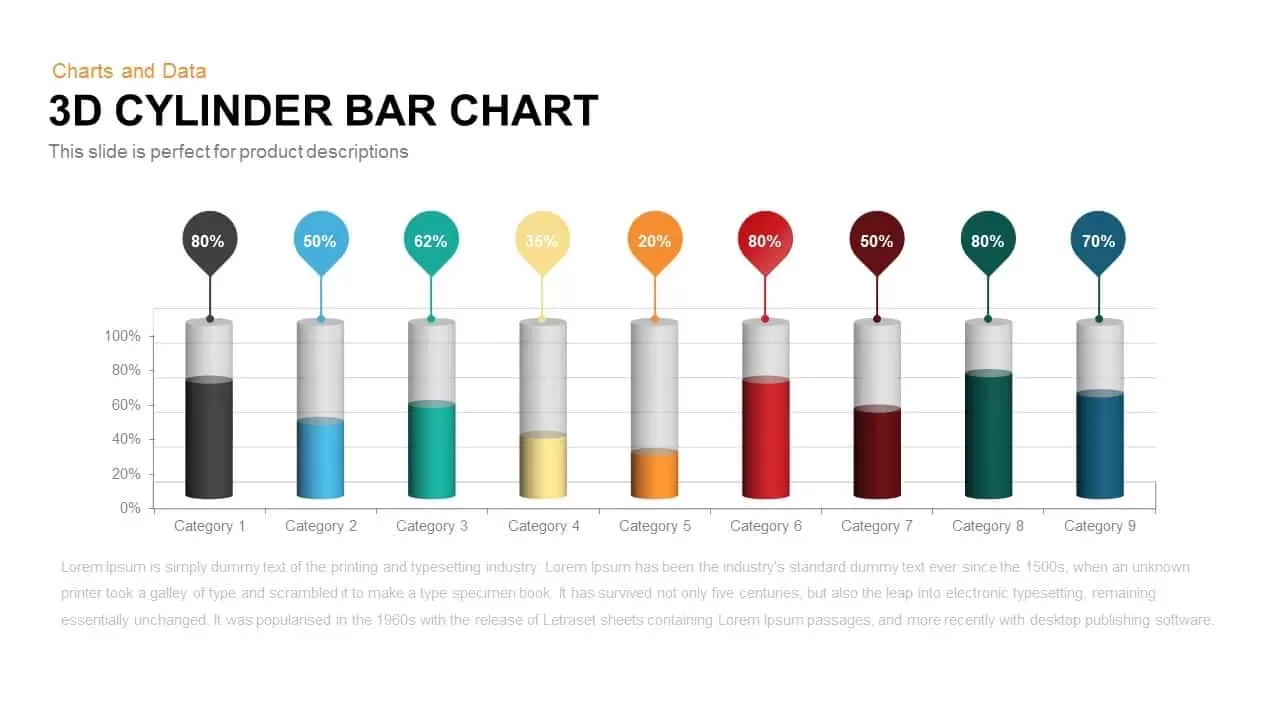
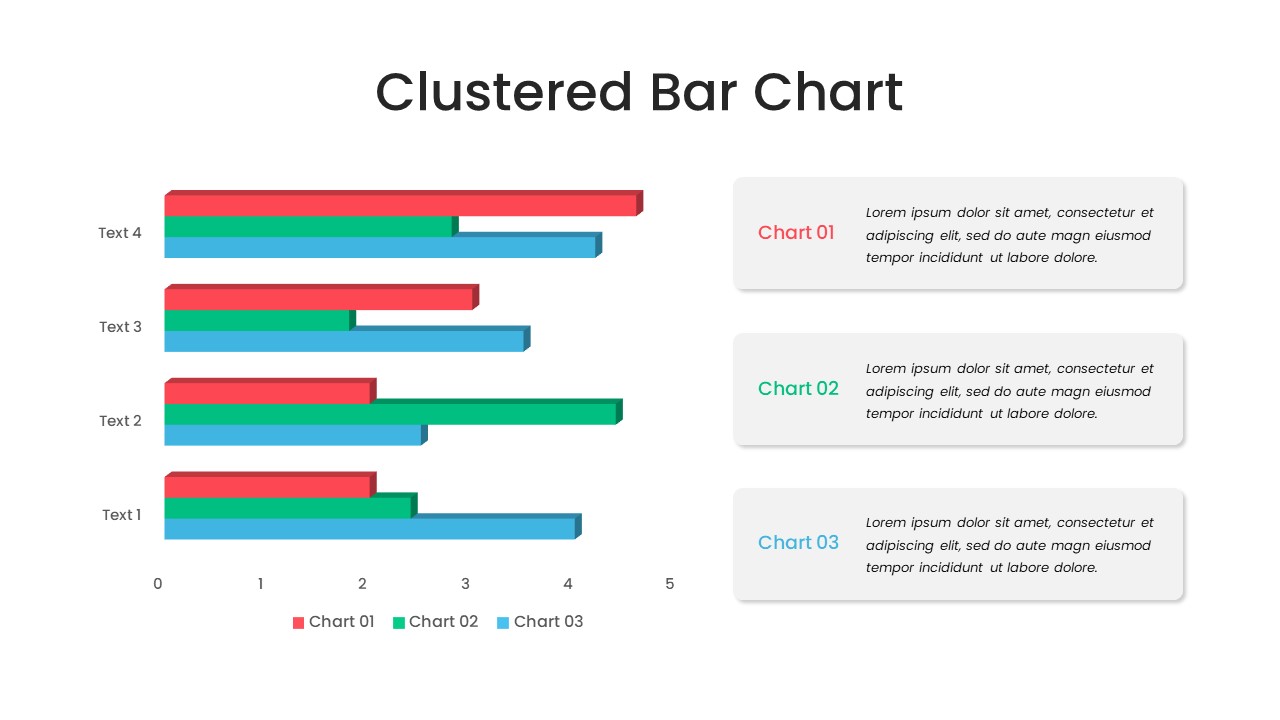
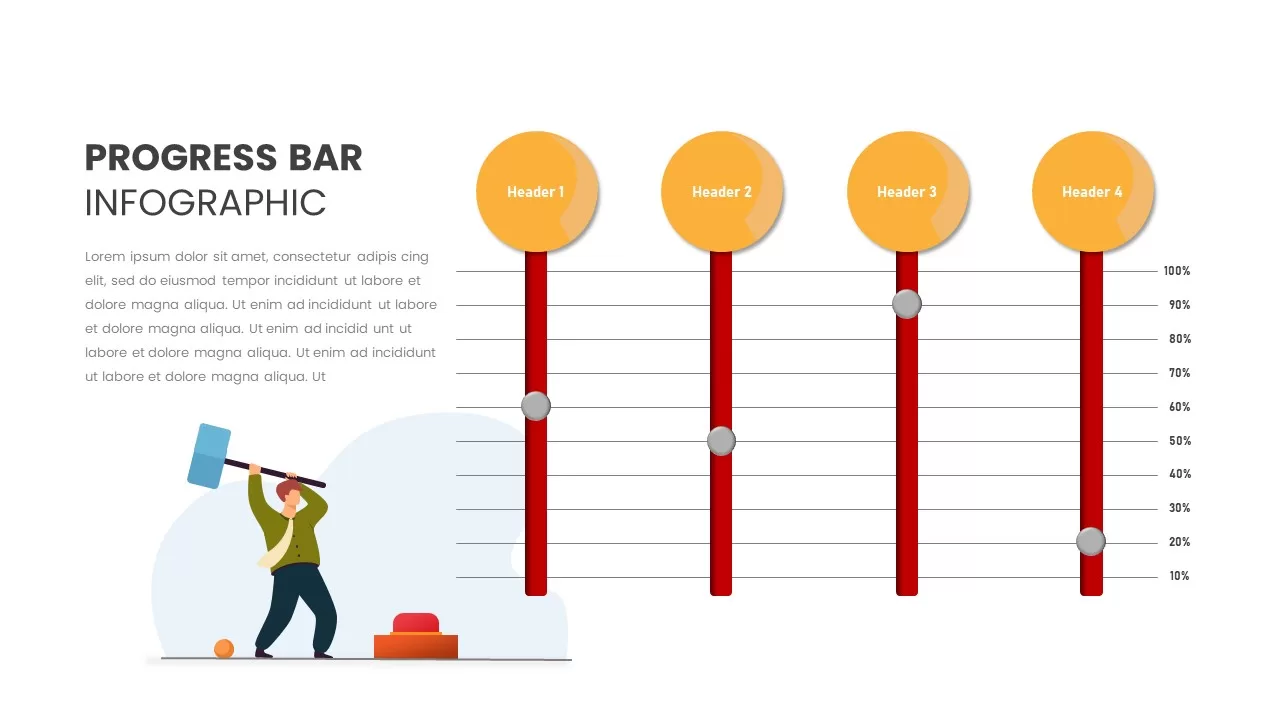
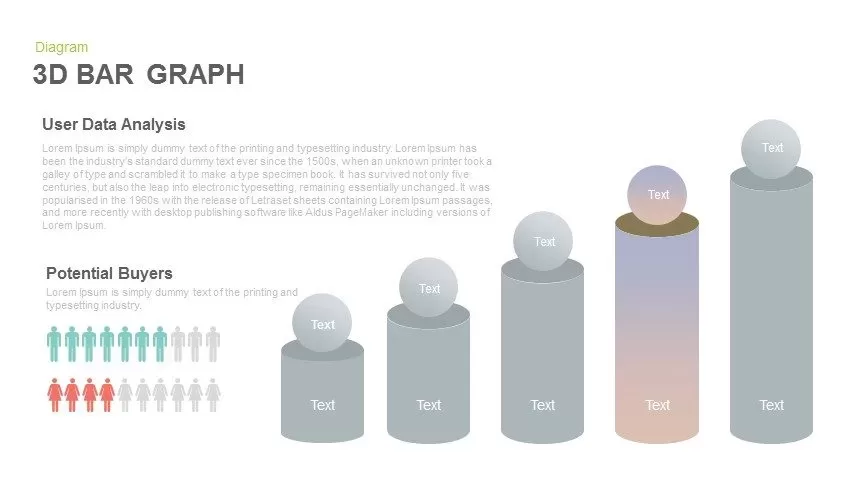
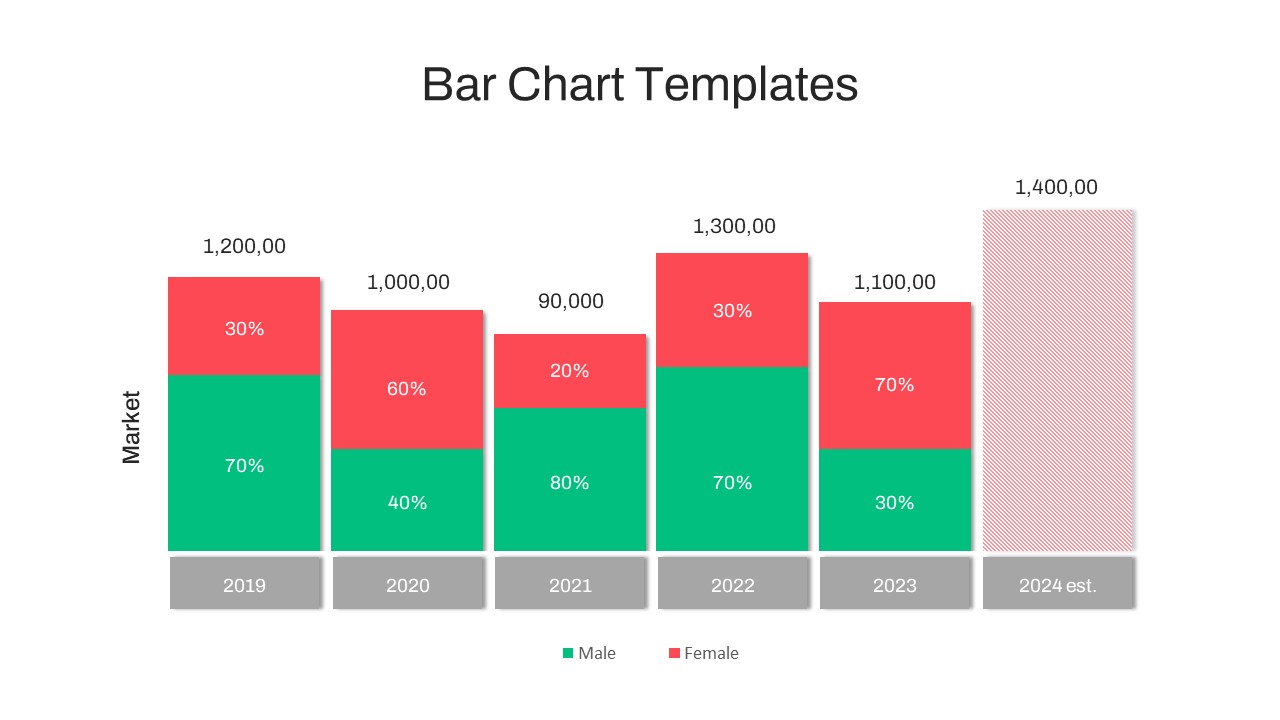
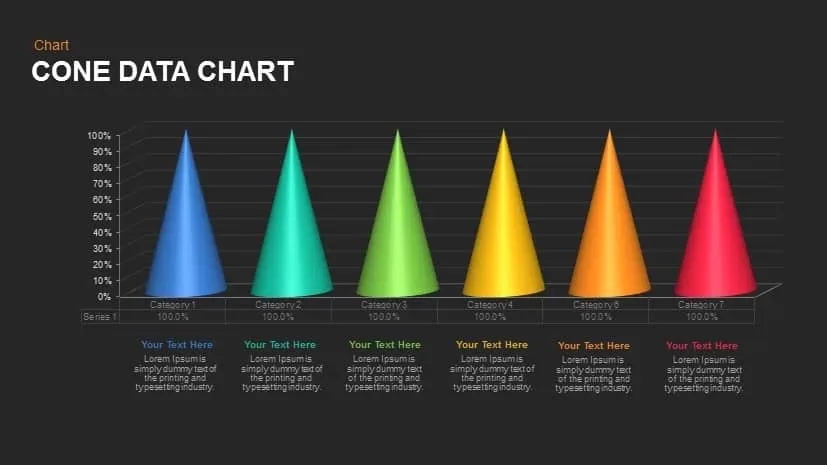
3d bar chart PowerPoint template and keynote slide is a creative diagram containing four stages or bars. The 3d bar shapes give a professional look and feel to the template. This bar infographic is functioning in business presentation as the competition’s presentation. Such as market position, sports ranking or progress level of product. For instance, use this slide to describe the market analysis of customer segmentation and category wise usage of a particular product. Unlike other regular column charts, this PowerPoint chart is the visual of the 3-dimensional graph.
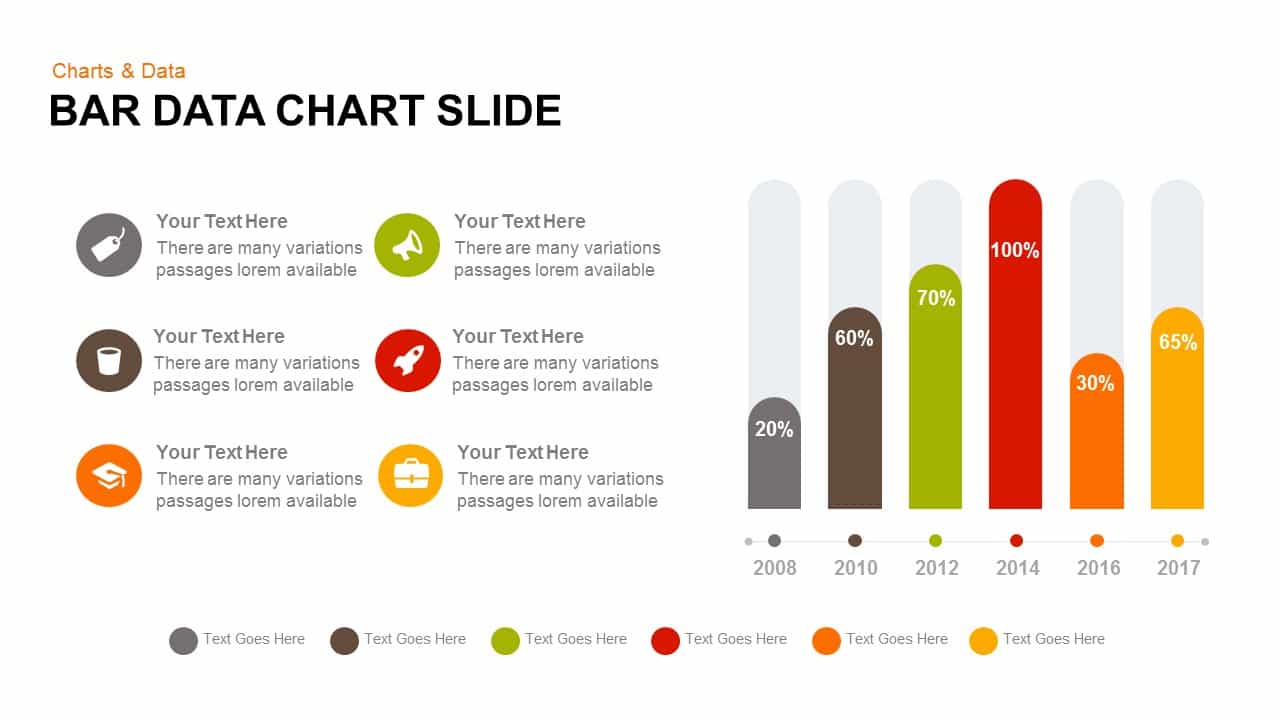
The 3d bar diagram for PowerPoint is a vector graphic template of high-resolution shapes. Hence, it is simple to alter the size of images without affecting the picture quality. For example, increase or decrease the bar measurement to show progress value simply by dragging characters in a respective direction. This customizable PowerPoint contains two different backgrounds, one is black and other is white. The 3D bars demonstrate a step design with percentage and text placeholders. These placeholders support in inserting presentation information with heading and caption. This incredible effect helps the audience to focus on diagram more. Although it is a predesigned template, to the replica in other presentation, quickly alter the typescript present. The PowerPoint diagram of 3D process permits users to customize various properties of the template. Such as, content and layout, recoloring the objects, adds elements, moving or resizing etc. the infographic icons may replace or delete accordingly. Use this multi-block slide to improve business presentation in stages.
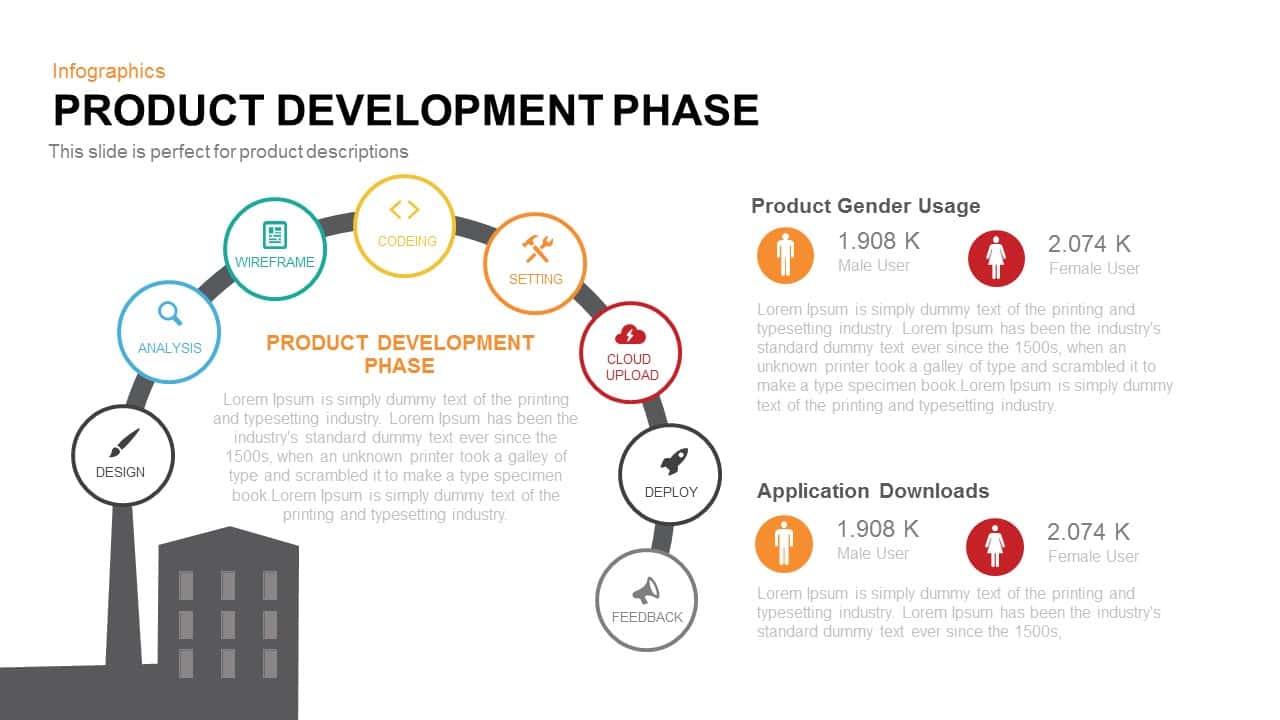
The 3d bar chart infographics PowerPoint and keynote template is ideal for the presentation of the product description. The six topic areas the elaborate area for the detailed description that is adjacent to the bars generate enough place for the textual themes. Users can download more charts and data PowerPoint for a precise statistical presentation.
Attached Files
| File |
|---|
| SB00108-3d-Bar-Chart-Infographics.zip |
Login to download this file
Add to favorites
Add to collection
-

Item ID
SB00108 -

Related Templates
-

Pencil Bar Chart PowerPoint Template and Keynote Slide
Column and Bar chart
Premium
-
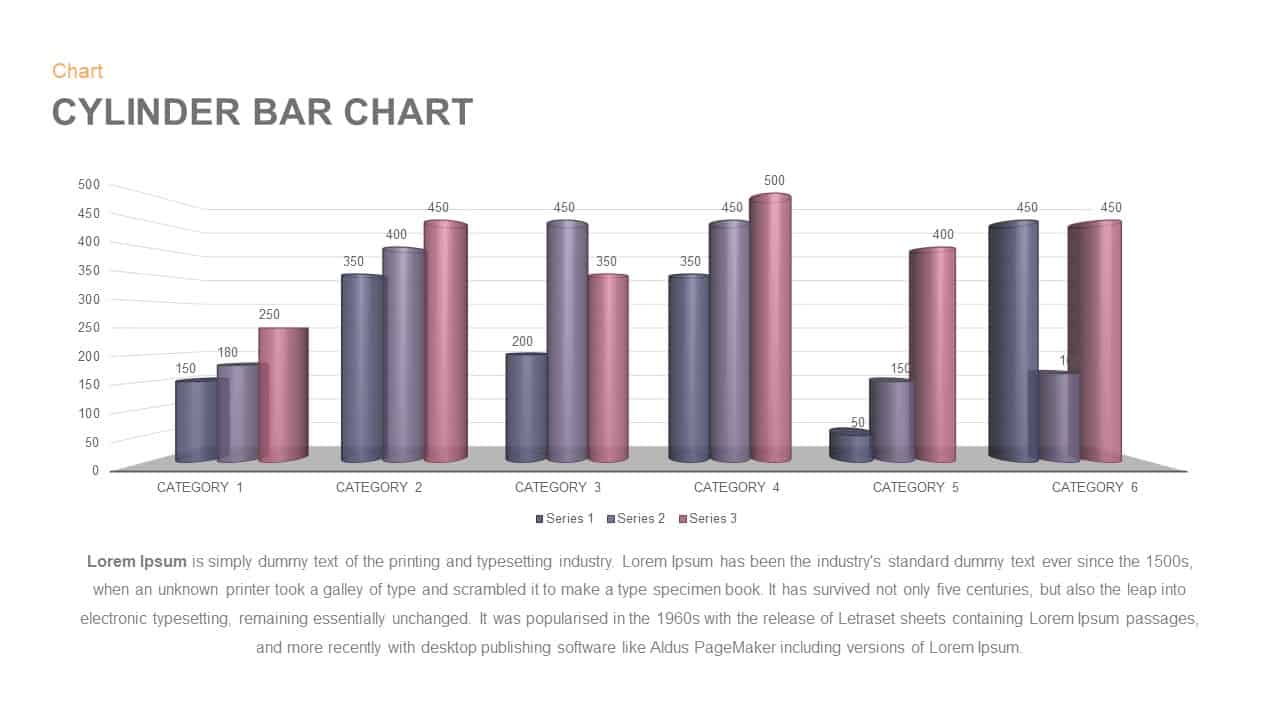
Cylinder Bar Chart PowerPoint Template and Keynote Slide
Column and Bar chart
Premium
-
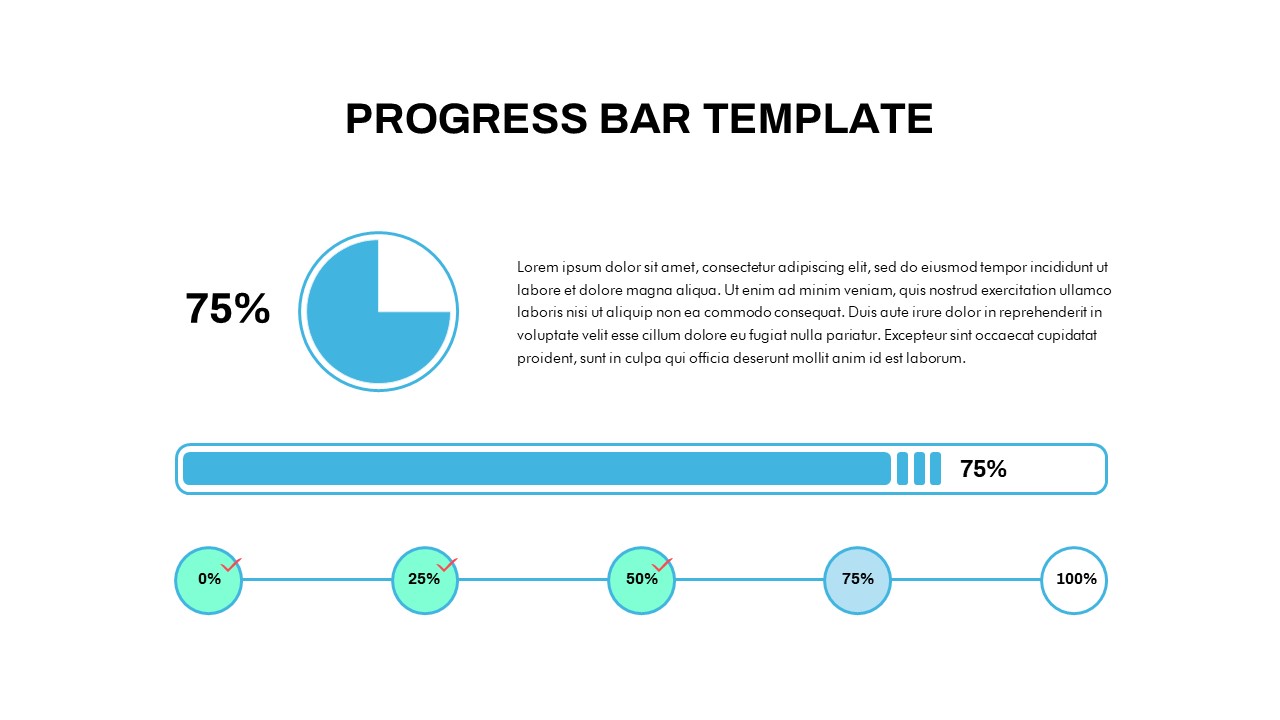
Progress Bar Chart PowerPoint Template
PowerPoint Templates
Premium
-

Creative Bar Chart Data Analysis PowerPoint Template and Keynote
Infographic
Premium
-
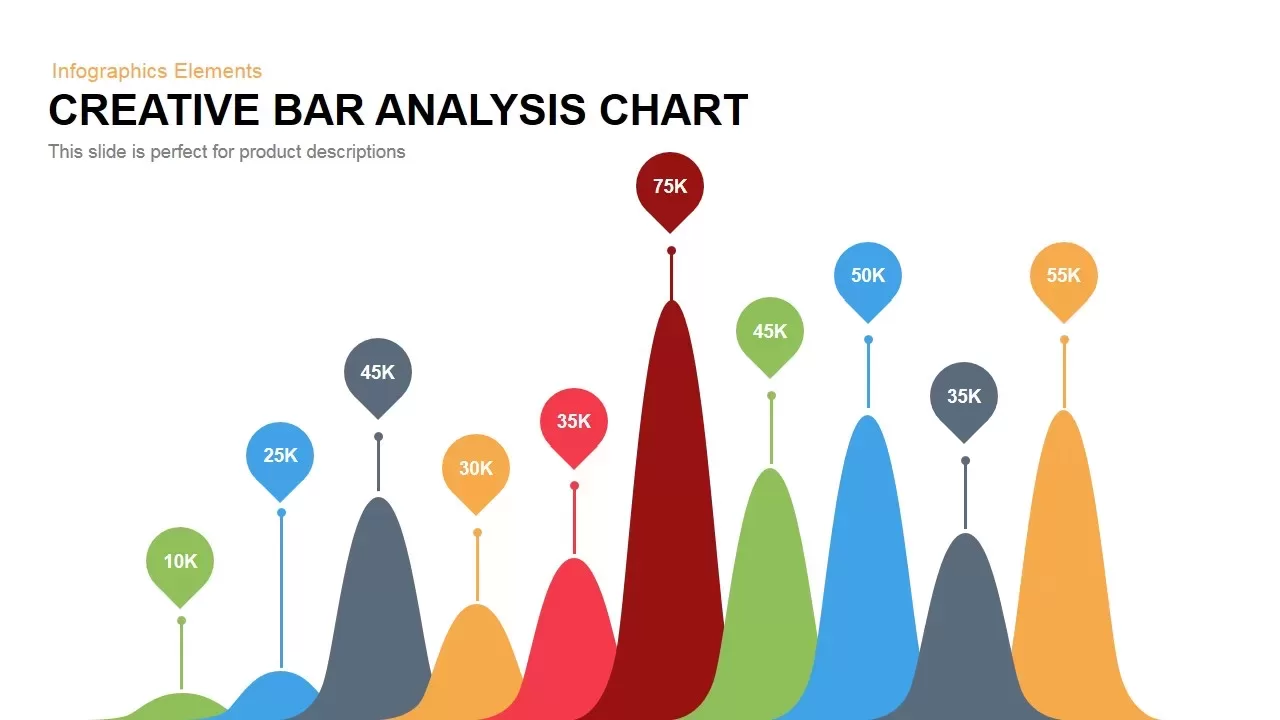
Creative Bar Chart Analysis PowerPoint Template and Keynote
Column and Bar chart
Premium
-
Progress Chart PowerPoint Template
PowerPoint Templates
Premium
-
Sample Bar Chart Template for PowerPoint and Keynote Presentation
Column and Bar chart
Premium
-
Progress Timeline Bar PowerPoint Template
Timeline PowerPoint Template
Premium
-
Comparison Bar Charts PowerPoint Template and Keynote Slide
Column and Bar chart
Premium
-
Simple Bar Chart PowerPoint Template
Column and Bar chart
Premium
-
3 Bar Chart PowerPoint Template and Keynote Slide
Column and Bar chart
Premium
-
Data Bar Chart Template for PowerPoint and Keynote
Column and Bar chart
Premium
-

Radial Bar Chart PowerPoint Templates and Keynote Slides
PowerPoint Charts
Premium
-
Product Comparison Bar Chart Template for PowerPoint and Keynote
PowerPoint Charts
Premium
-
3D Cylinder Bar Chart PowerPoint Template and Keynote Slide
Column and Bar chart
Premium
-
Radial Bar Chart Template for PowerPoint and Keynote
Circular Diagrams
Premium
-
Bar of Pie Chart PowerPoint Template
PowerPoint Templates
Premium
-

Animated Clustered Bar Chart PowerPoint Template
PowerPoint Charts
Premium
-
World Map Infographic PowerPoint Template and Keynote Slide
PowerPoint Charts
Premium
-
Clustered Bar Chart PowerPoint Template
Column and Bar chart
Premium
-
Weekly Data Charts PowerPoint Presentation Template and Keynote Slide
Infographic
Premium
-
For and Against Vote Count Bar Chart for PowerPoint Presentation
Column and Bar chart
Premium
-
Sales Bar Chart Template for PowerPoint and Keynote
Column and Bar chart
Premium
-
Progress Bar PowerPoint template
PowerPoint Business Templates
Premium
-
Animated Stacked Bar Chart PowerPoint Template
Column and Bar chart
Premium
-
Market Development Matrix Chart – Ansoff Matrix PowerPoint Template
Business Models
Premium
-
Free Charts & Graphs Deck PowerPoint Template
PowerPoint Templates
Free
-

Free Stock Market PowerPoint Template
PowerPoint Templates
Free
-
3d Bar Graph PowerPoint Template and Keynote Slide
Diagrams
Premium
-

Mekko Chart Template
PowerPoint Templates
Premium
-
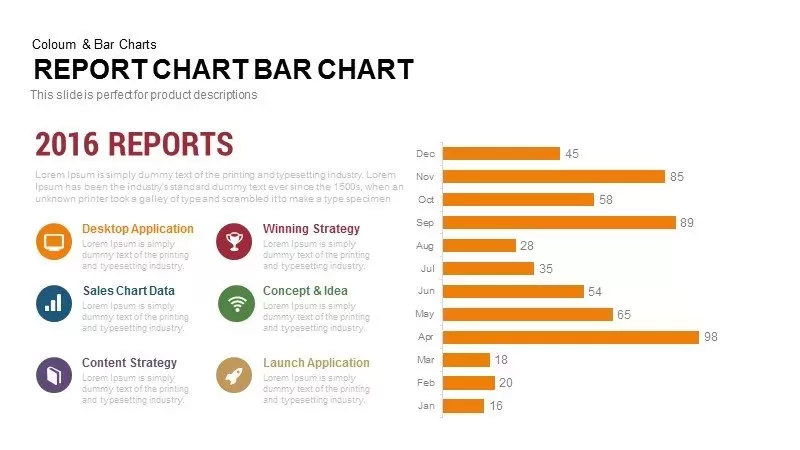
Report Bar Chart PowerPoint Template and Keynote
Column and Bar chart
Premium
-
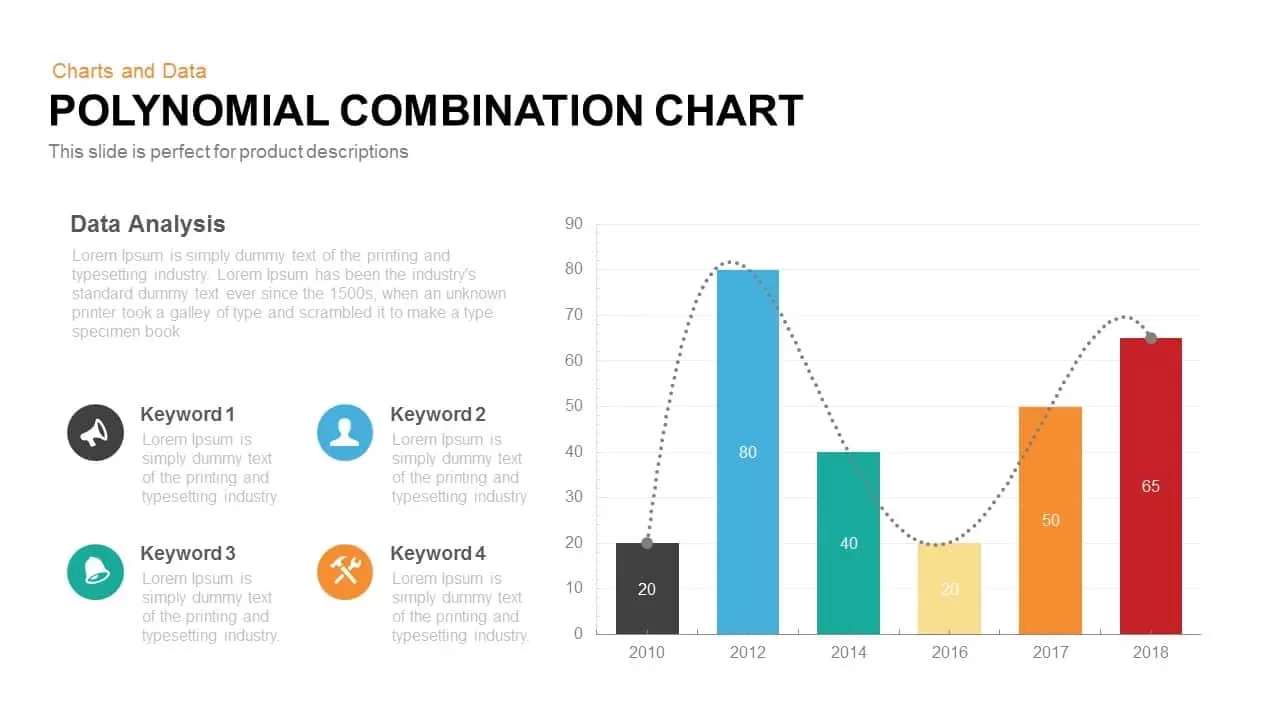
Polynomial Combination Chart PowerPoint Template and Keynote Slide
Column and Bar chart
Premium
-

Free Charts and Graphs PowerPoint Template
PowerPoint Templates
Free
-

Clustered Column Chart PowerPoint Template
PowerPoint Charts
Premium
-
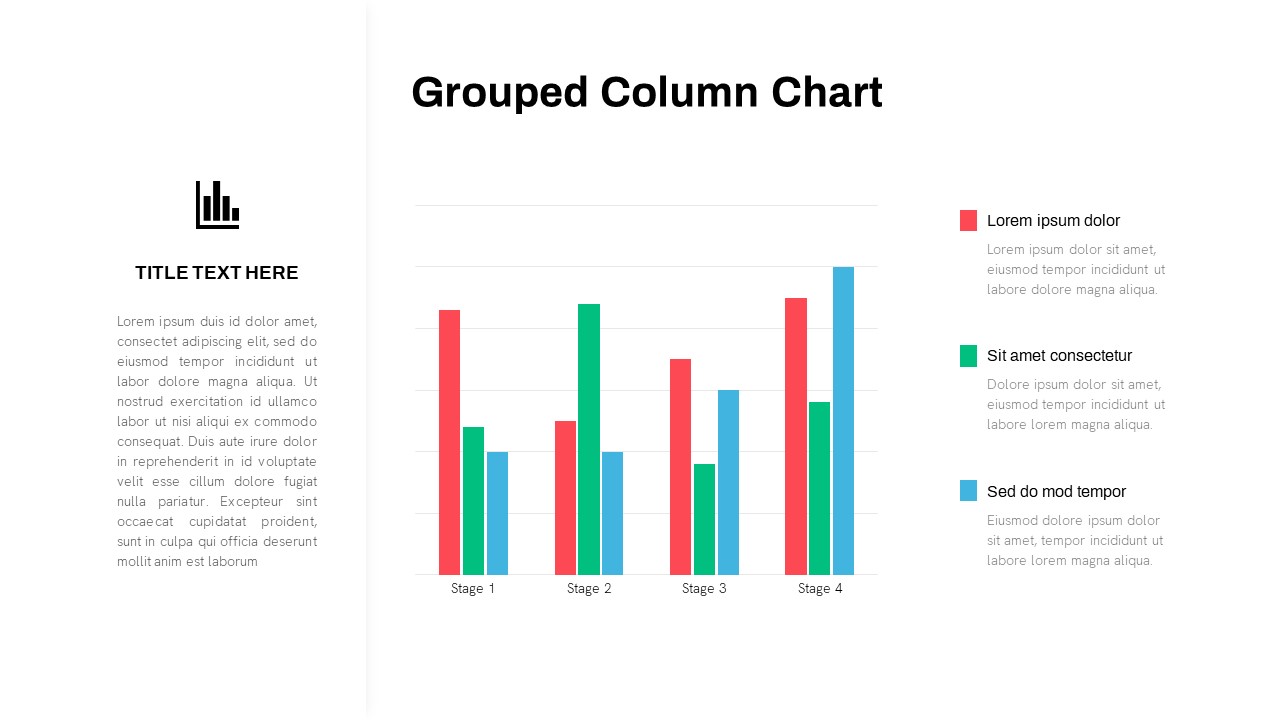
Grouped Column Chart PowerPoint Template
Column and Bar chart
Premium
-
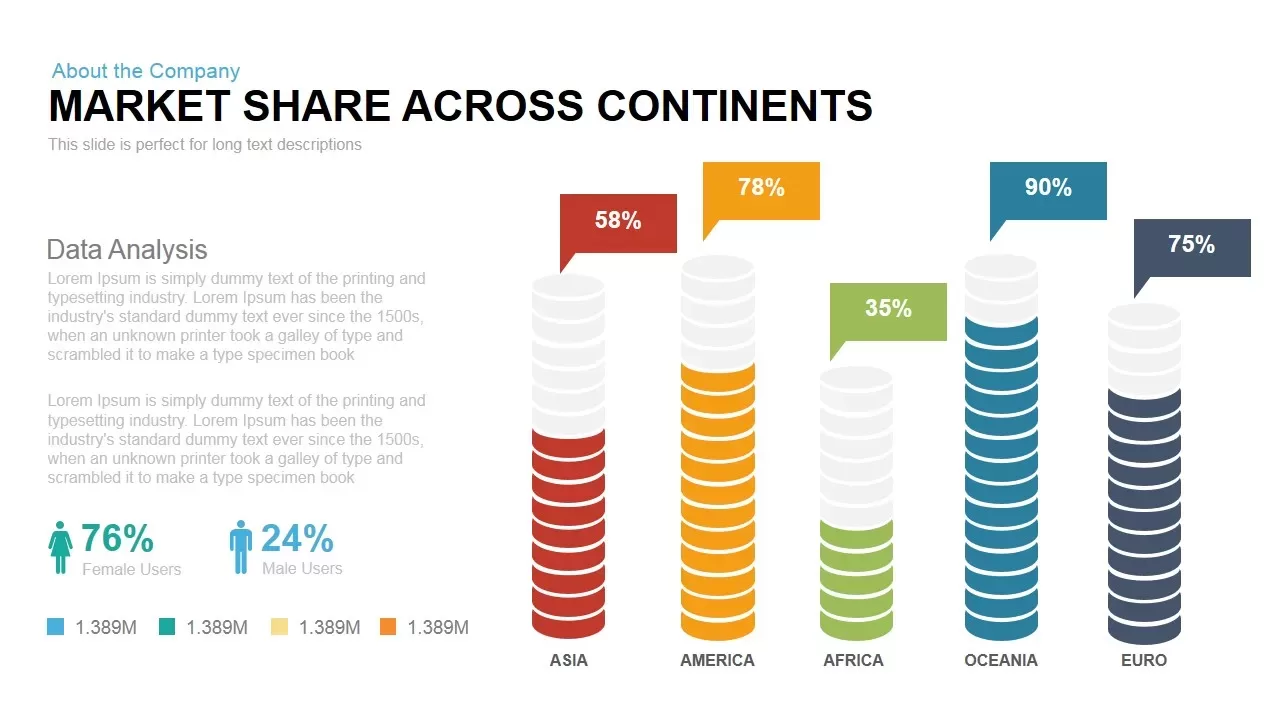
Market Share across Continents PowerPoint & Keynote template
Diagrams
Premium
-
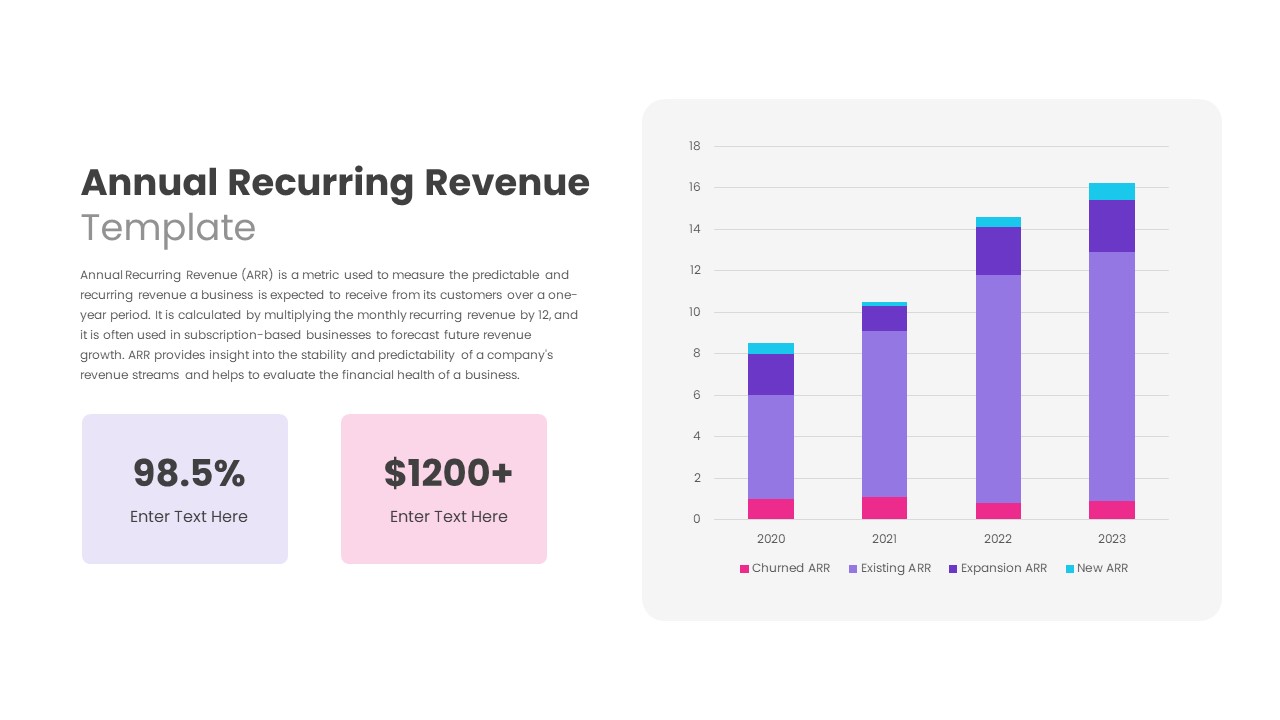
Annual Recurring Revenue PowerPoint Template
PowerPoint Templates
Premium
-
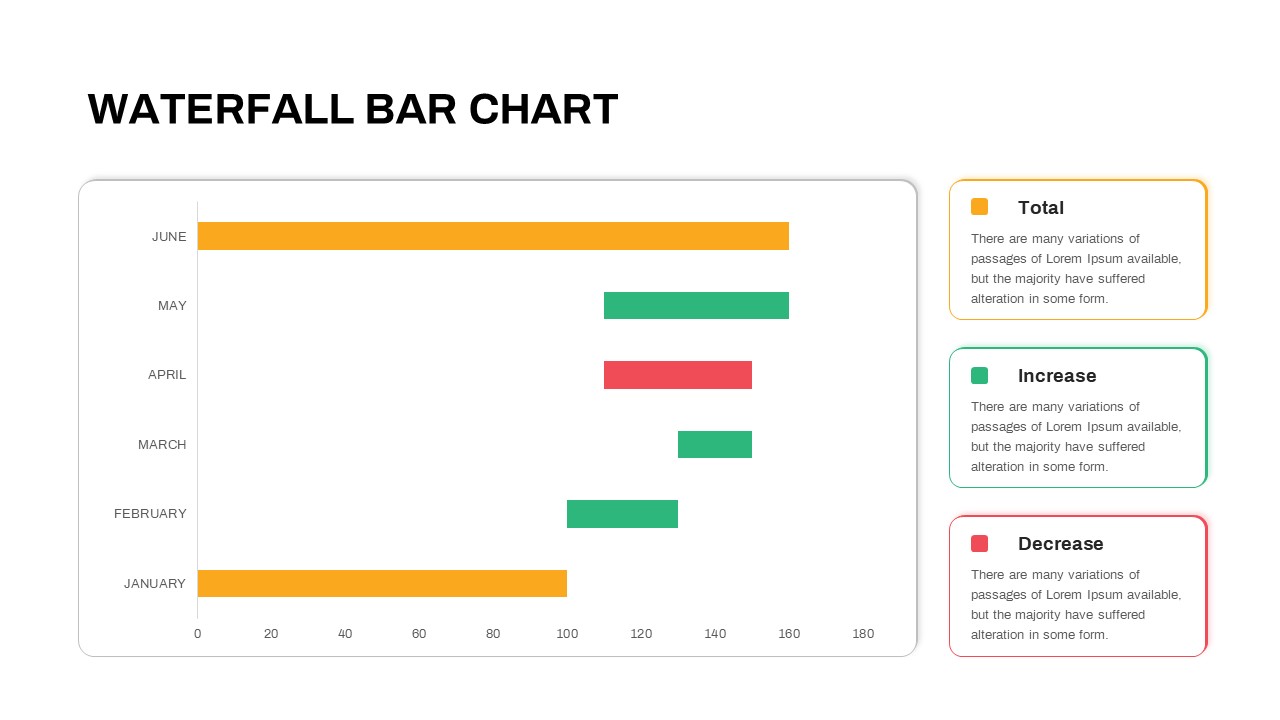
Waterfall Bar Chart PowerPoint Template
PowerPoint Charts
Premium
-
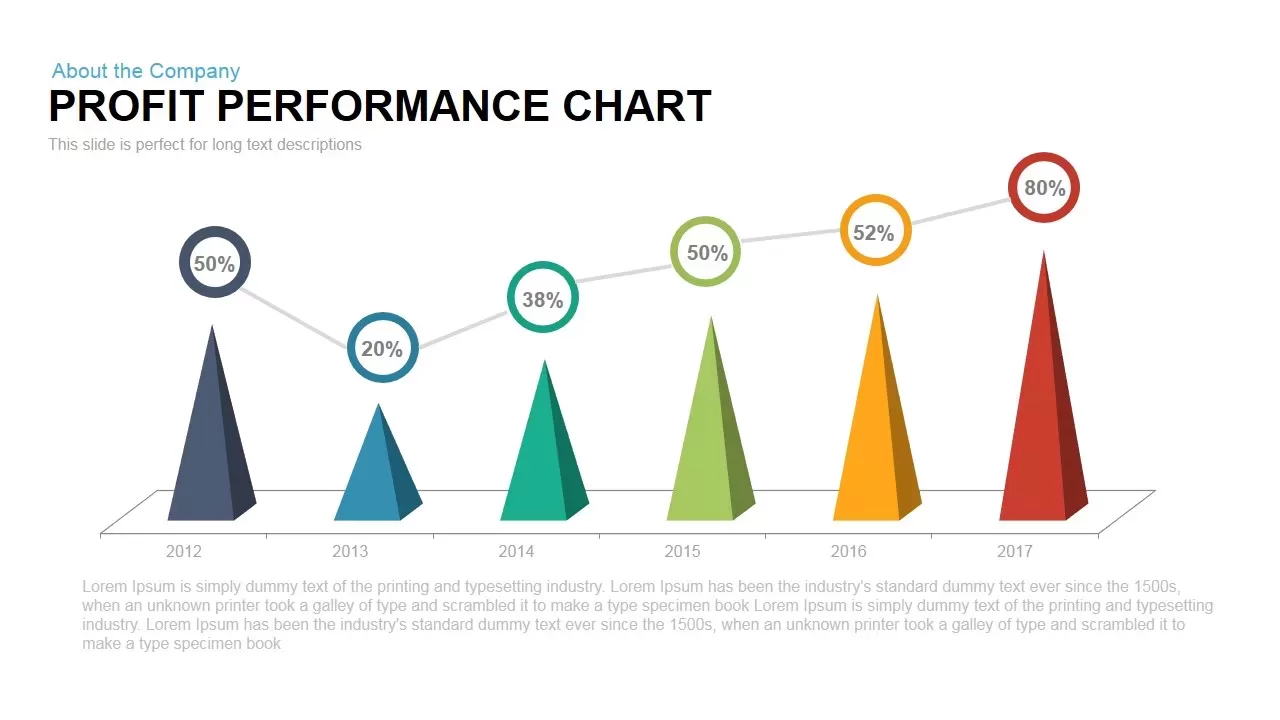
Profit Performance Chart PowerPoint Template
PowerPoint Charts
Premium
-

Combination Chart PowerPoint Template
PowerPoint Charts
Premium
-
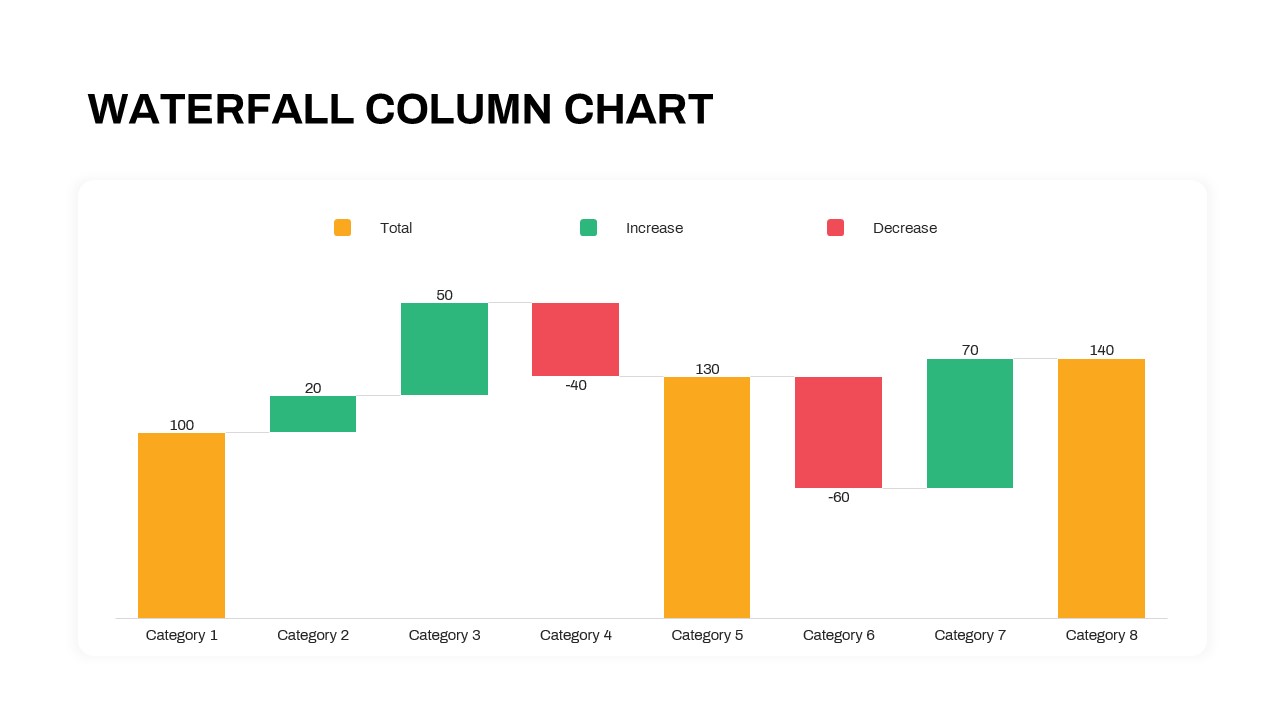
Waterfall Column Chart PowerPoint Template
Column and Bar chart
Premium
-

Product Launch Checklist Template
Business Models
Premium
-
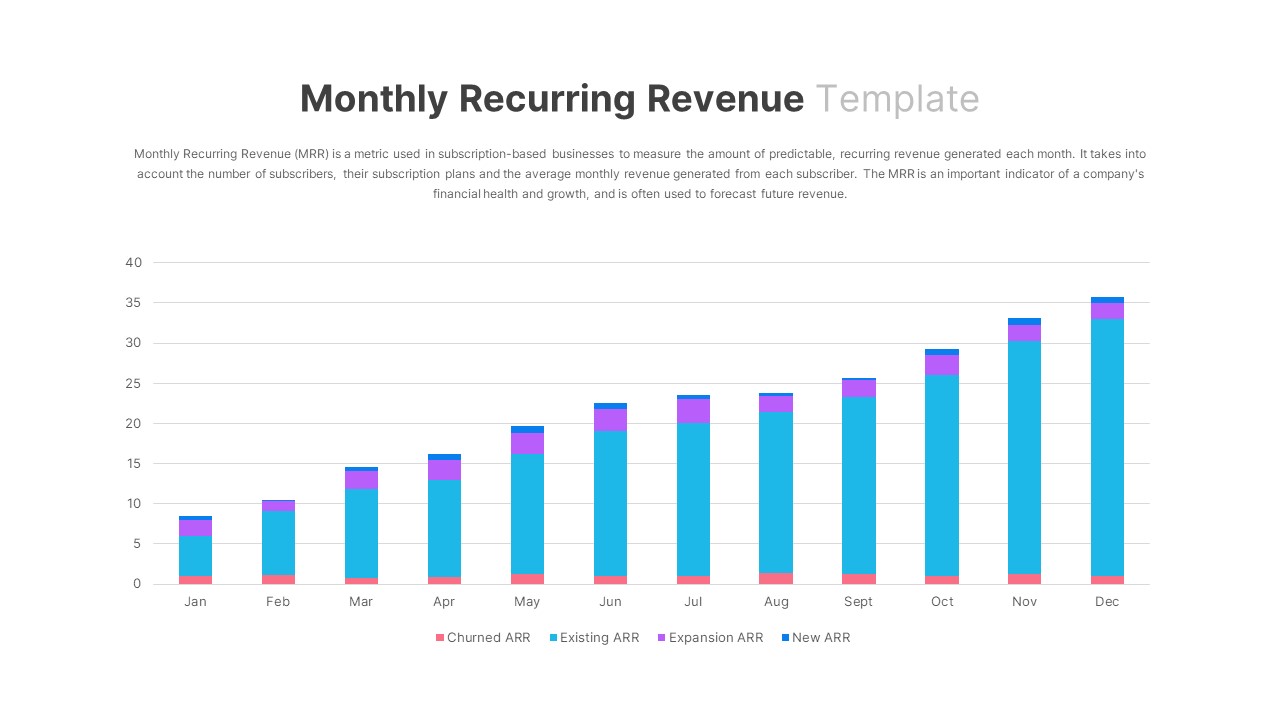
Monthly Recurring Revenue PowerPoint Template
PowerPoint Templates
Premium
-
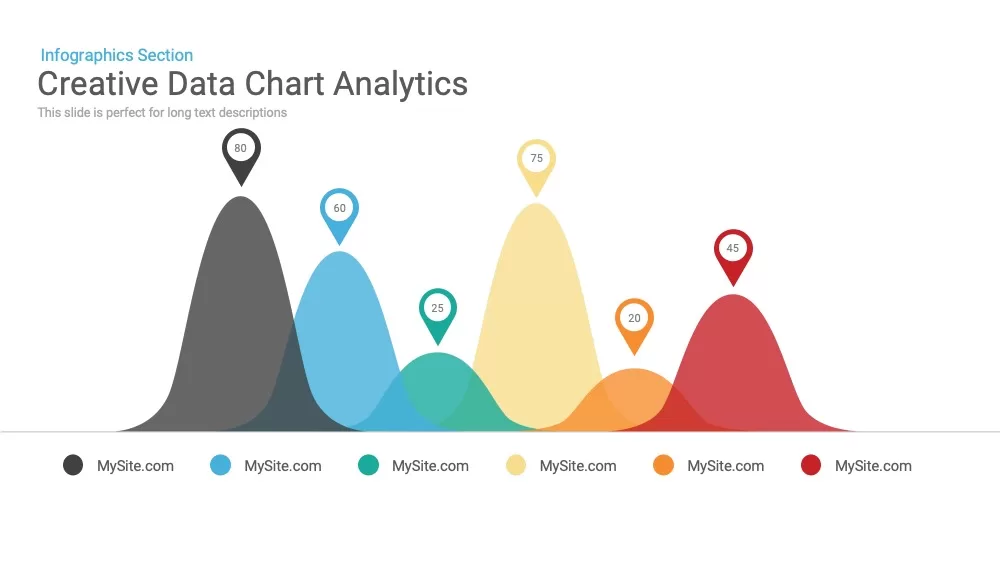
Data Analytics Chart PowerPoint Template and Keynote Slide
Diagrams
Premium
-
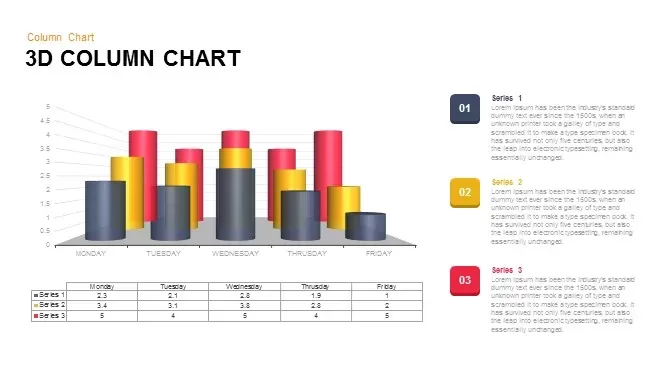
3D Column Chart for PowerPoint and Keynote Presentation
PowerPoint Charts
Premium
-
Product Development Phase PowerPoint Template and Keynote
Infographic
Premium
-
Timeline Bar Chart PowerPoint
Column and Bar chart
Premium
-
Business Growth Chart Template for PowerPoint and Keynote
Business Models
Premium
-

Go To Market PowerPoint Template
PowerPoint Templates
Premium
-
Progress Bar
PowerPoint Templates
Premium
-
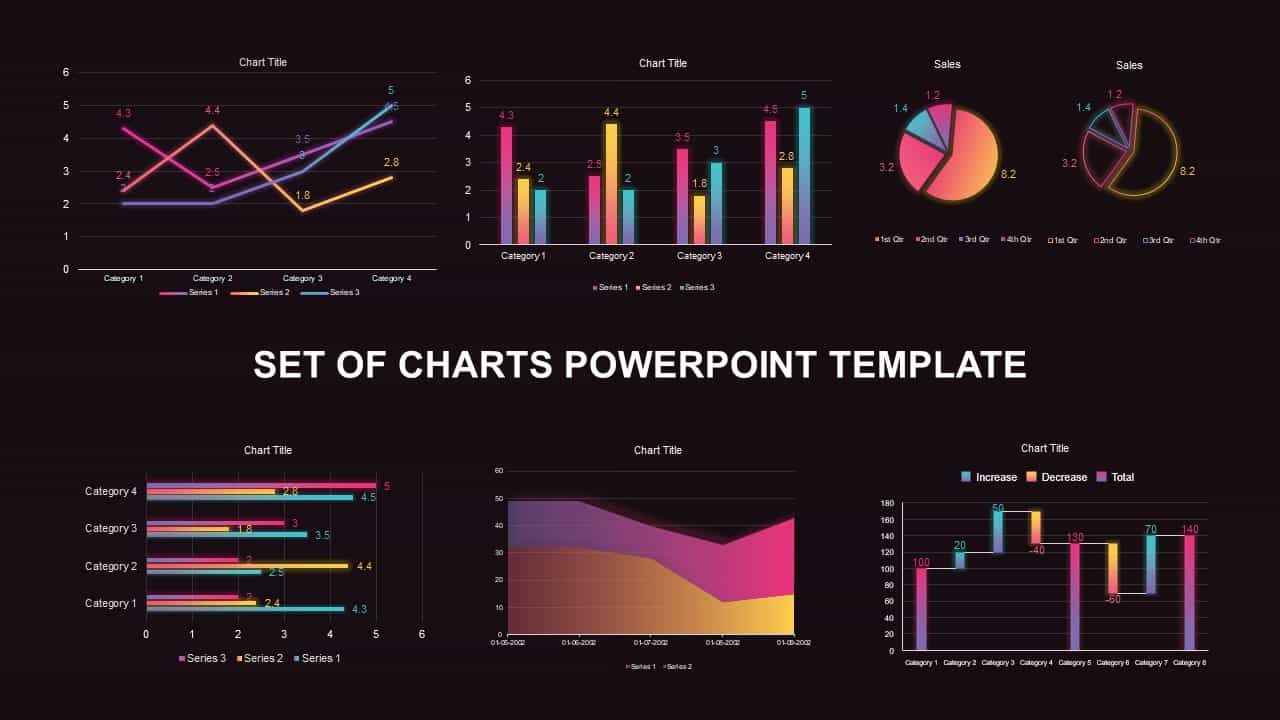
Set of Chart PowerPoint Template and Keynote Diagram
PowerPoint Charts
Premium
-
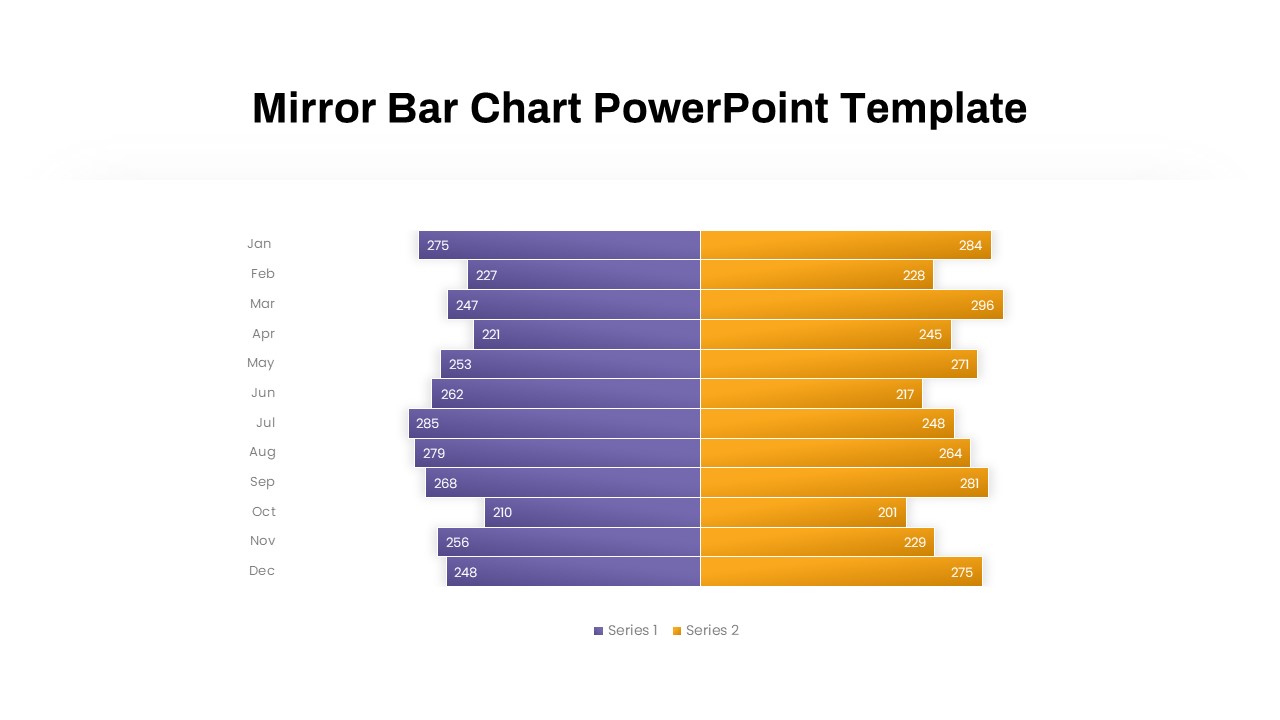
Mirror Bar Chart PowerPoint Template
PowerPoint Templates
Premium
-
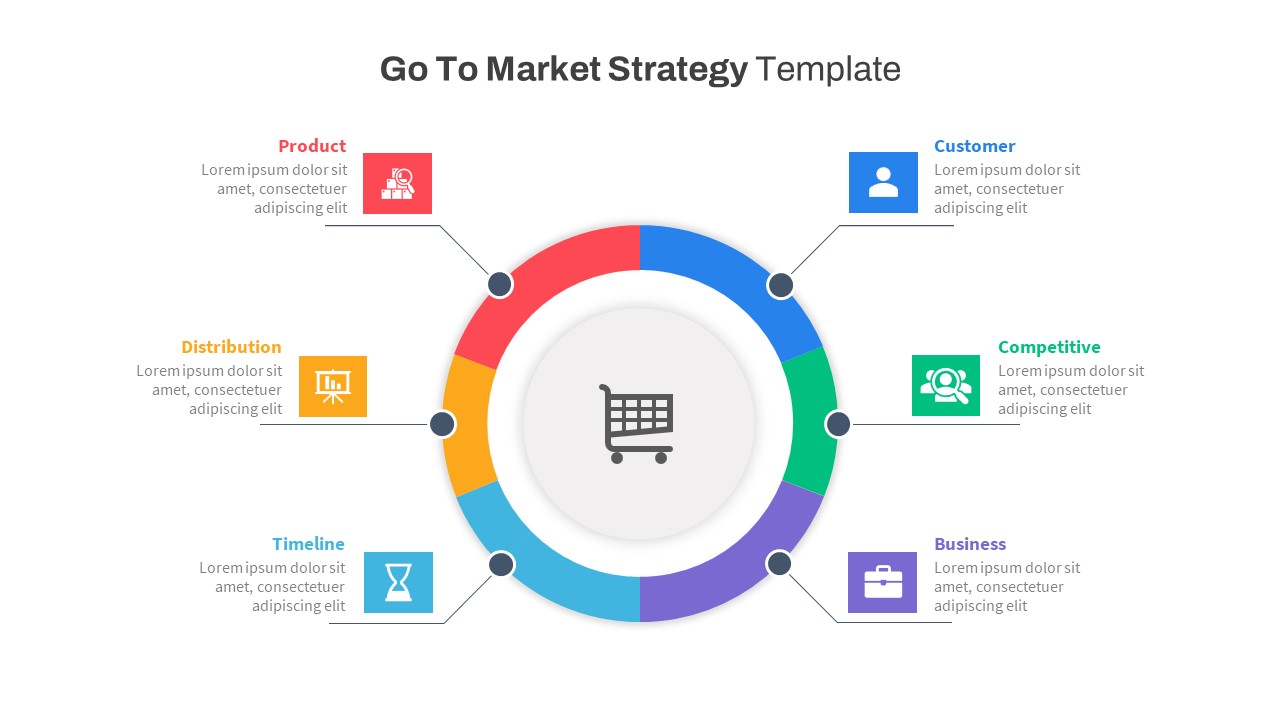
Free Go To Market Strategy PowerPoint Template
Circular Diagrams
Free
-

Creative Stage Infographic PowerPoint and Keynote Template
Stage Diagrams
Premium
-
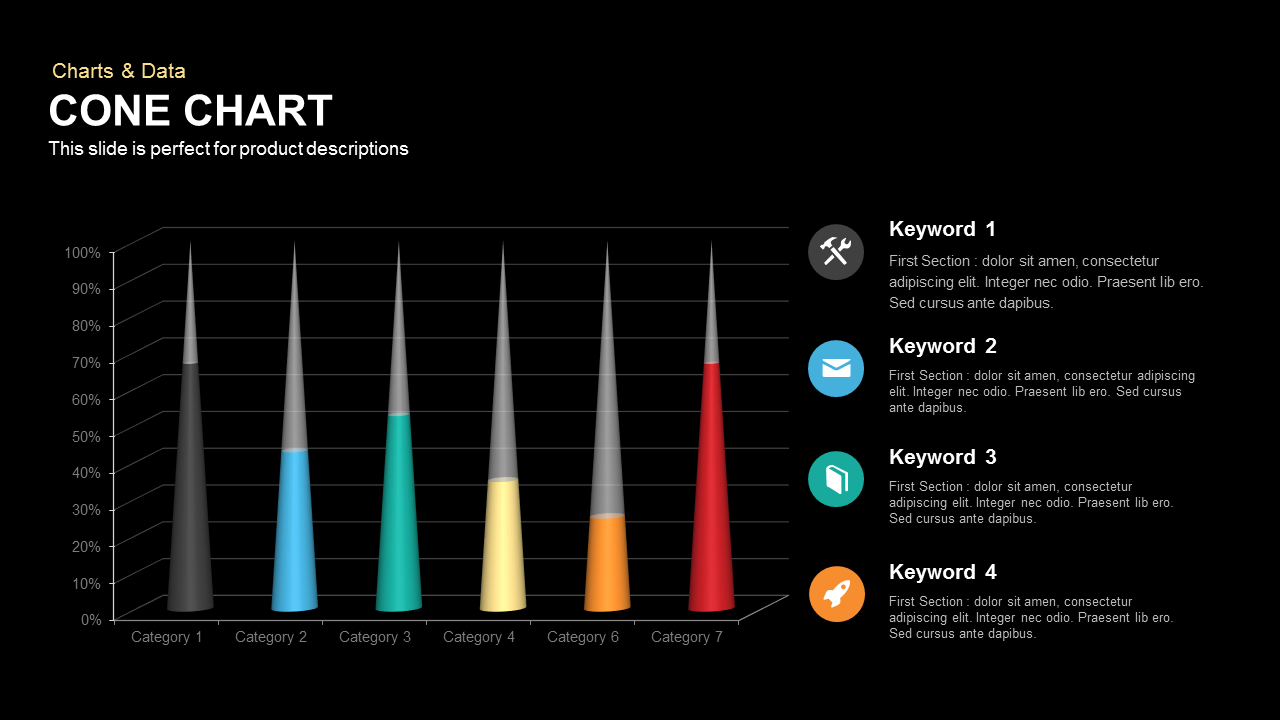
Cone Chart PowerPoint Template
Column and Bar chart
Premium
-
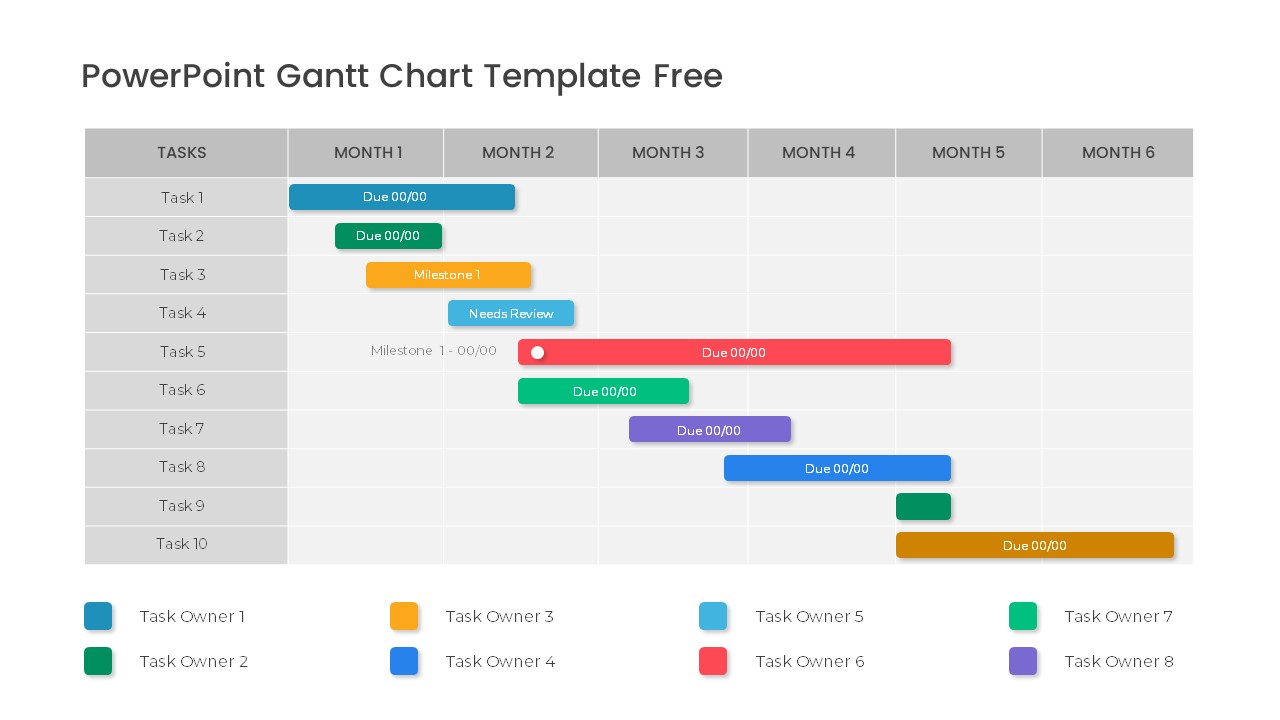
Free PowerPoint Gantt Chart Template
PowerPoint Charts
Free
-
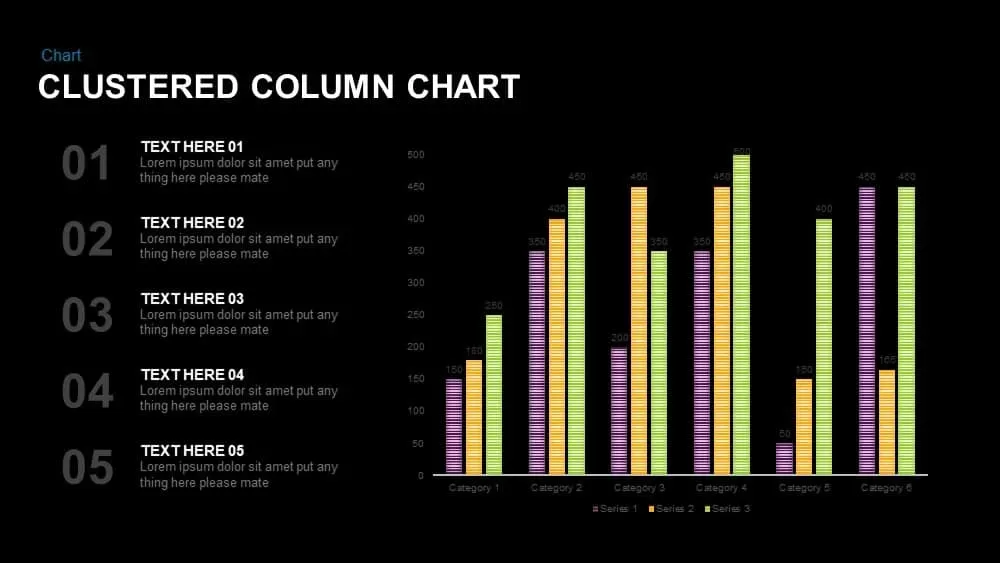
Clustered Column Chart PowerPoint and Keynote Slide
PowerPoint Charts
Premium
-
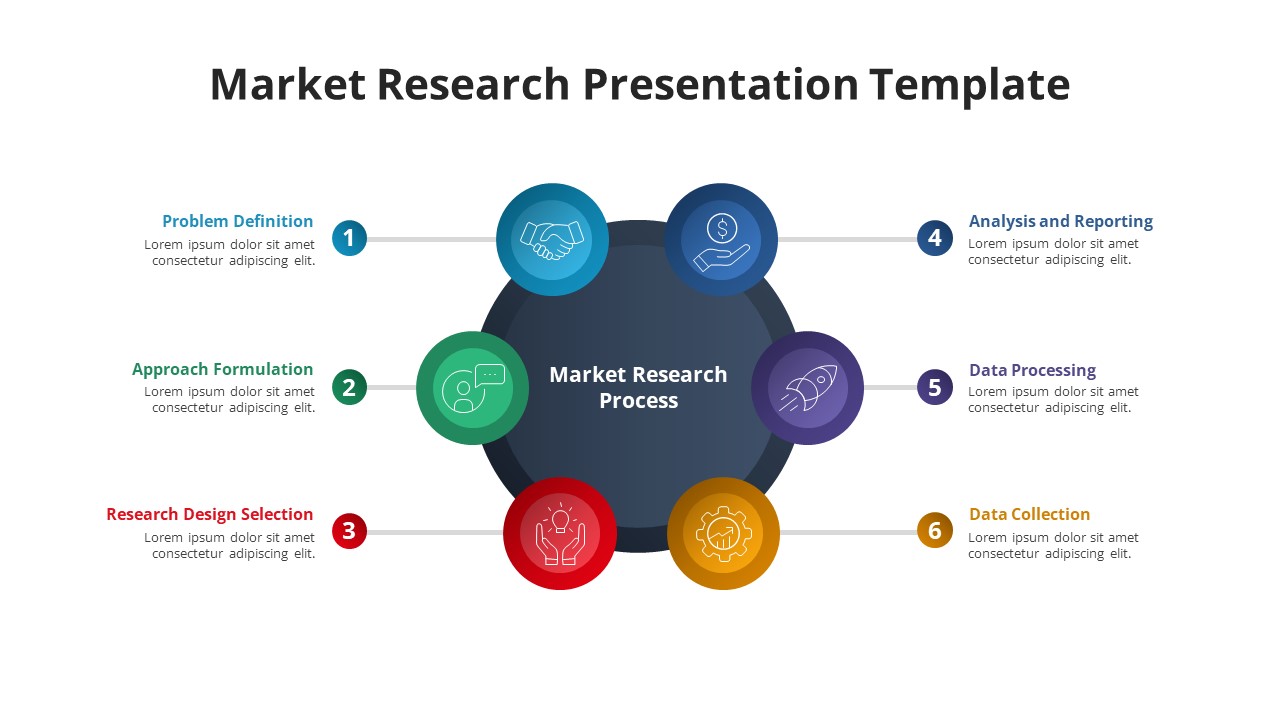
Market Research PowerPoint Template Free
PowerPoint Templates
Free
-
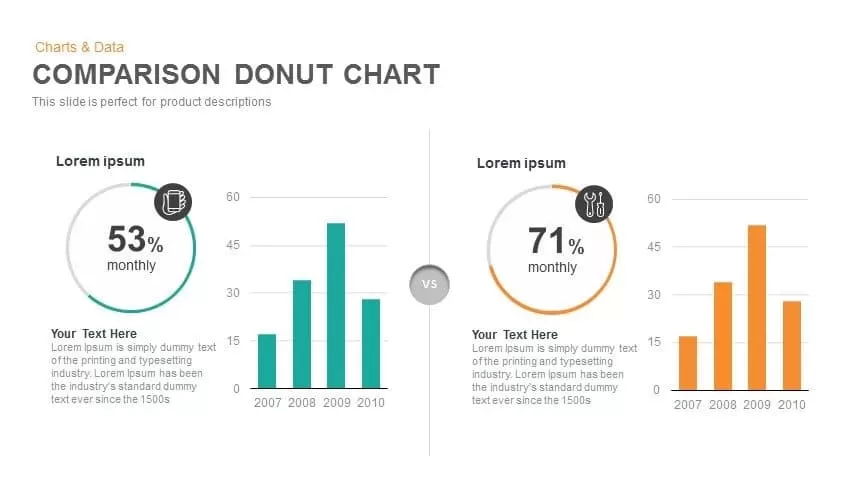
Comparison Donut Chart PowerPoint Template and Keynote
Keynote Templates
Premium
-
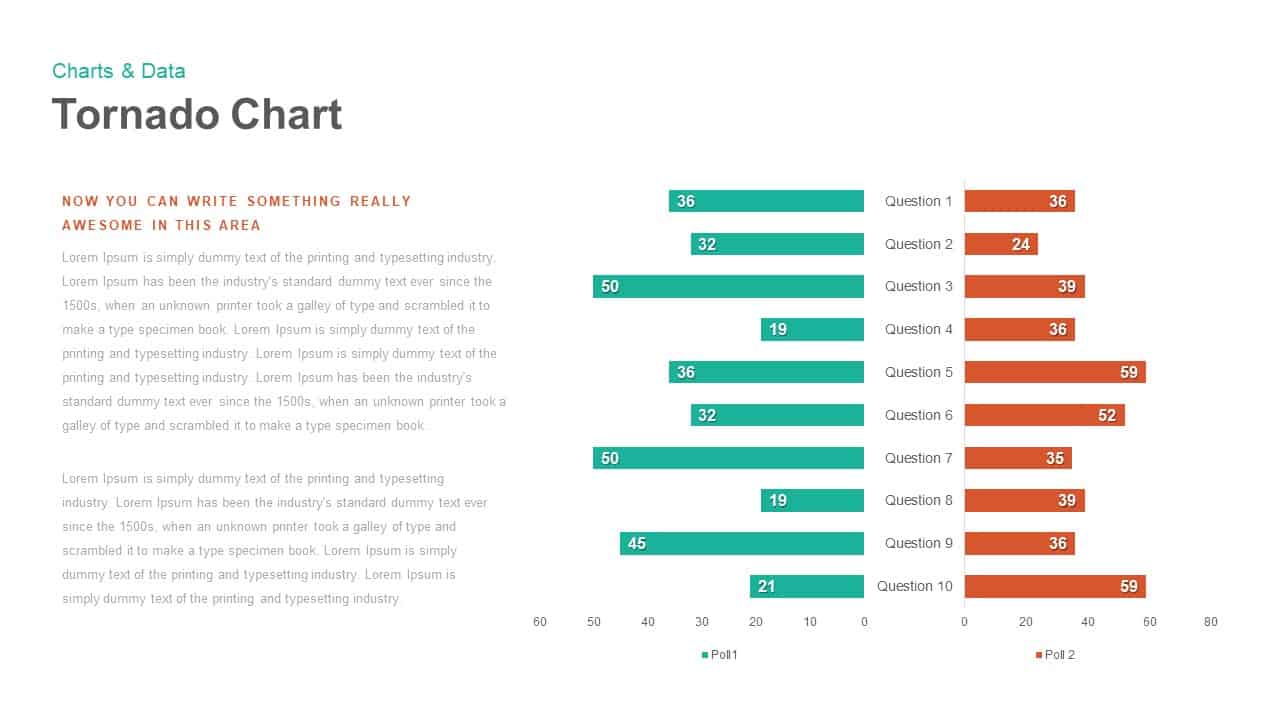
Tornado Chart PowerPoint template and keynote Slide
Diagrams
Premium
-
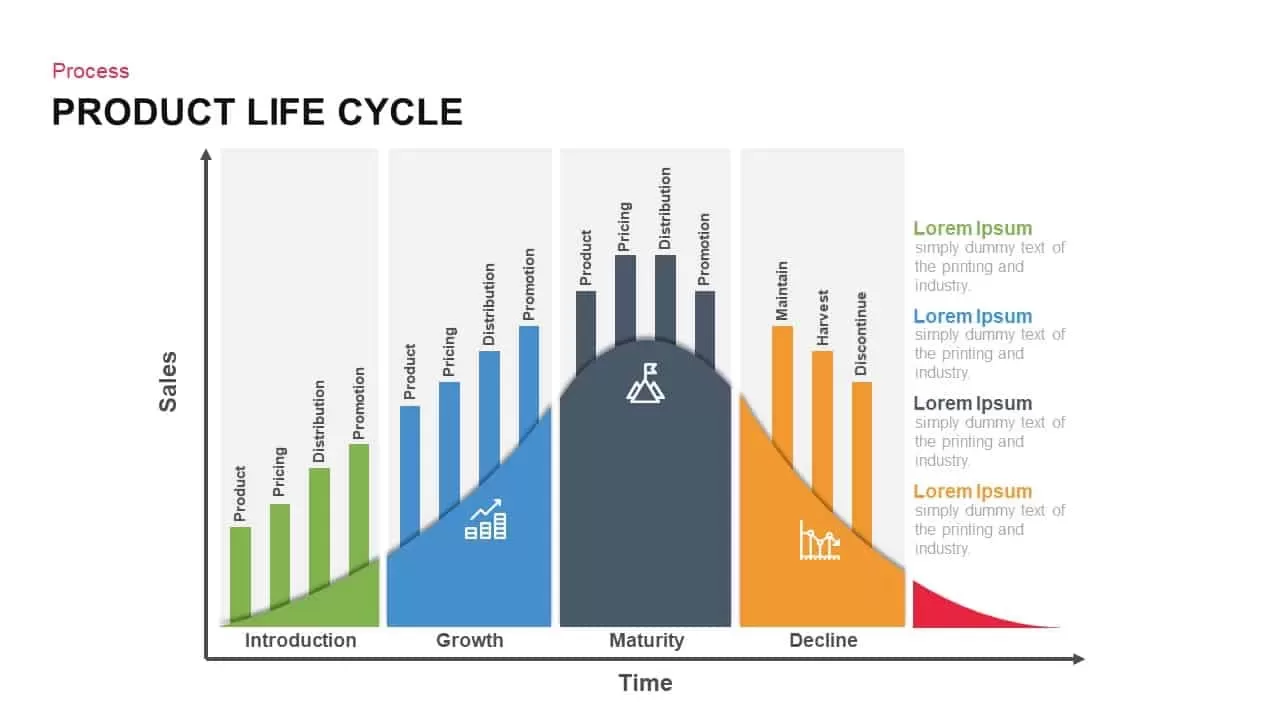
Product Life Cycle PowerPoint Template and Keynote Diagram
Business Models
Premium
-
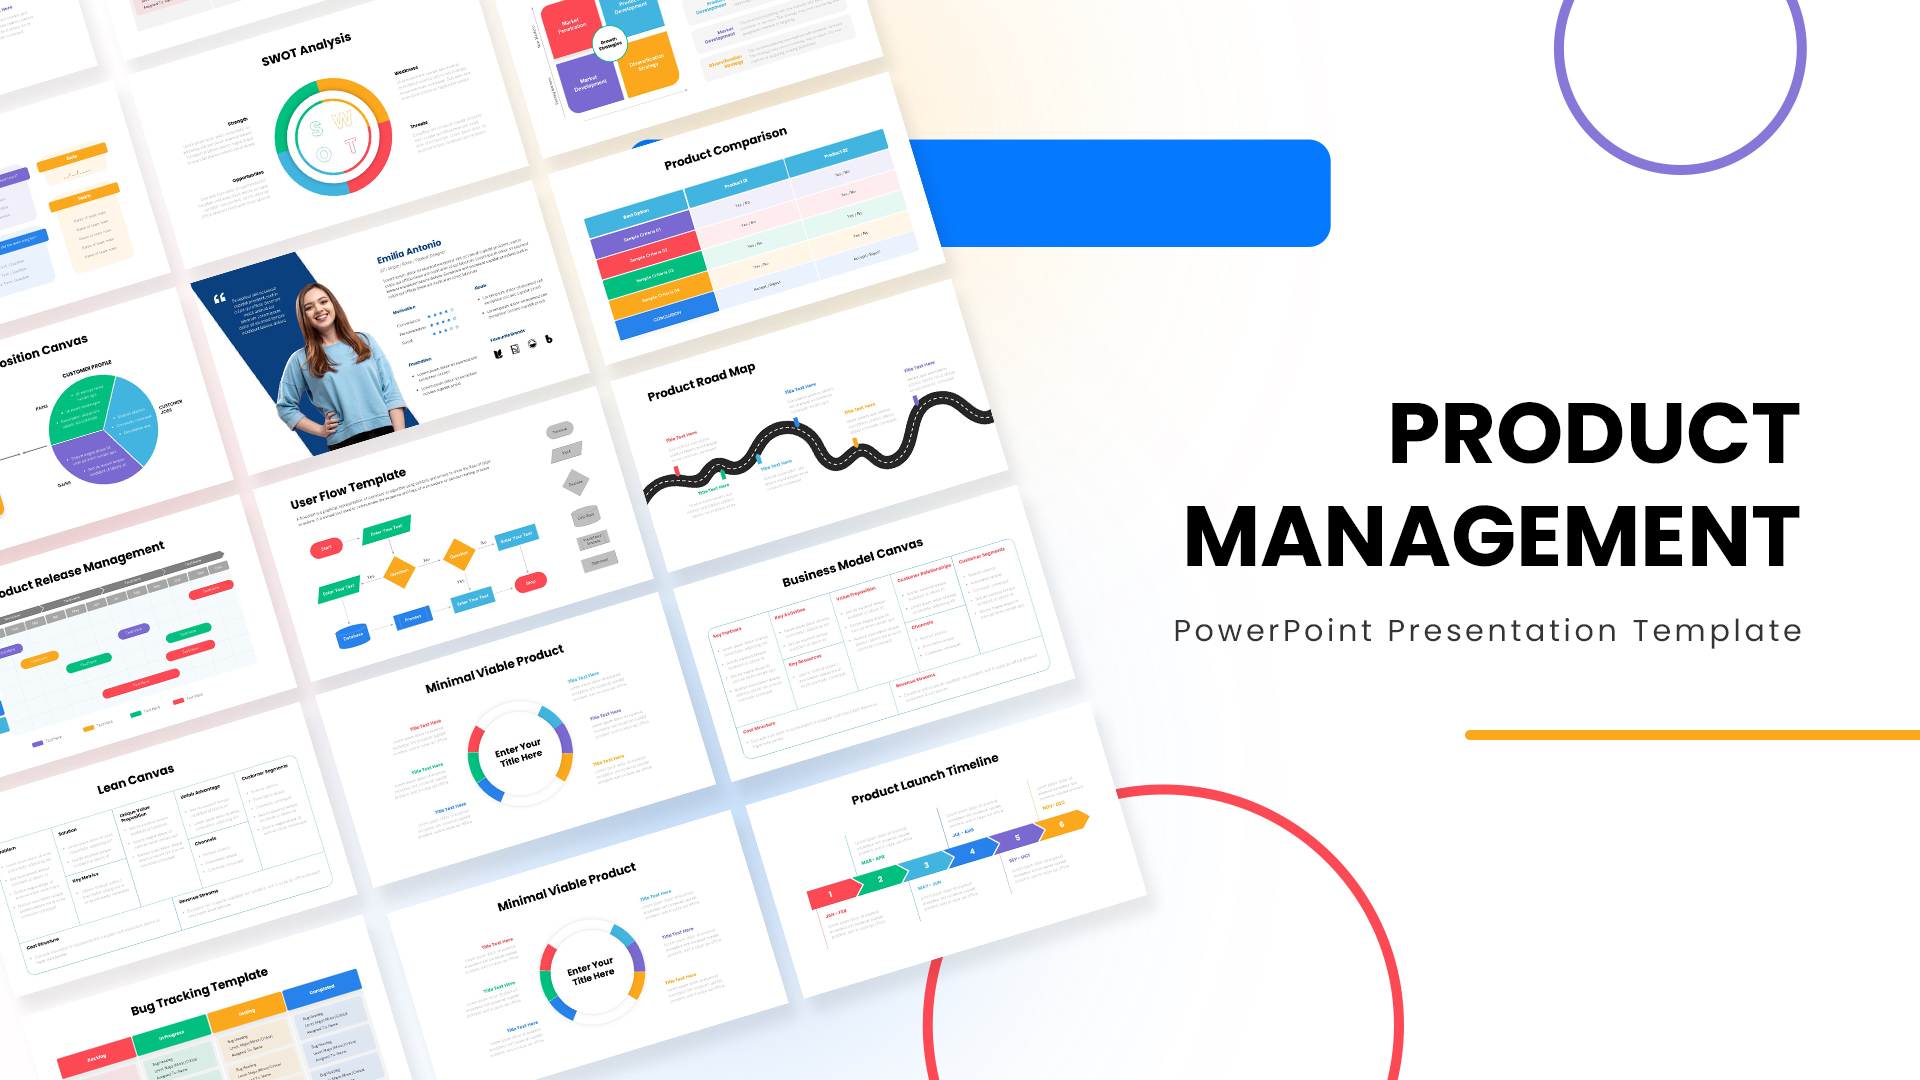
Product Management PowerPoint Template
PowerPoint Templates
Premium
-
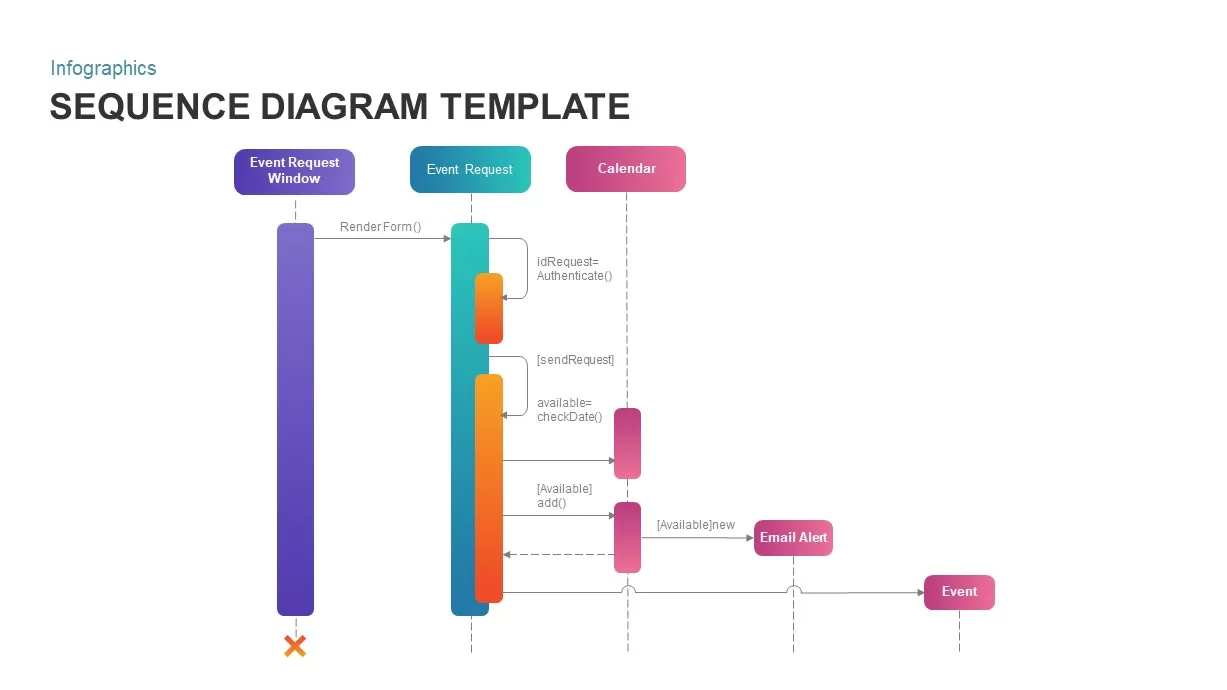
Sequence Diagram for PowerPoint Presentations
Diagrams
Premium
-
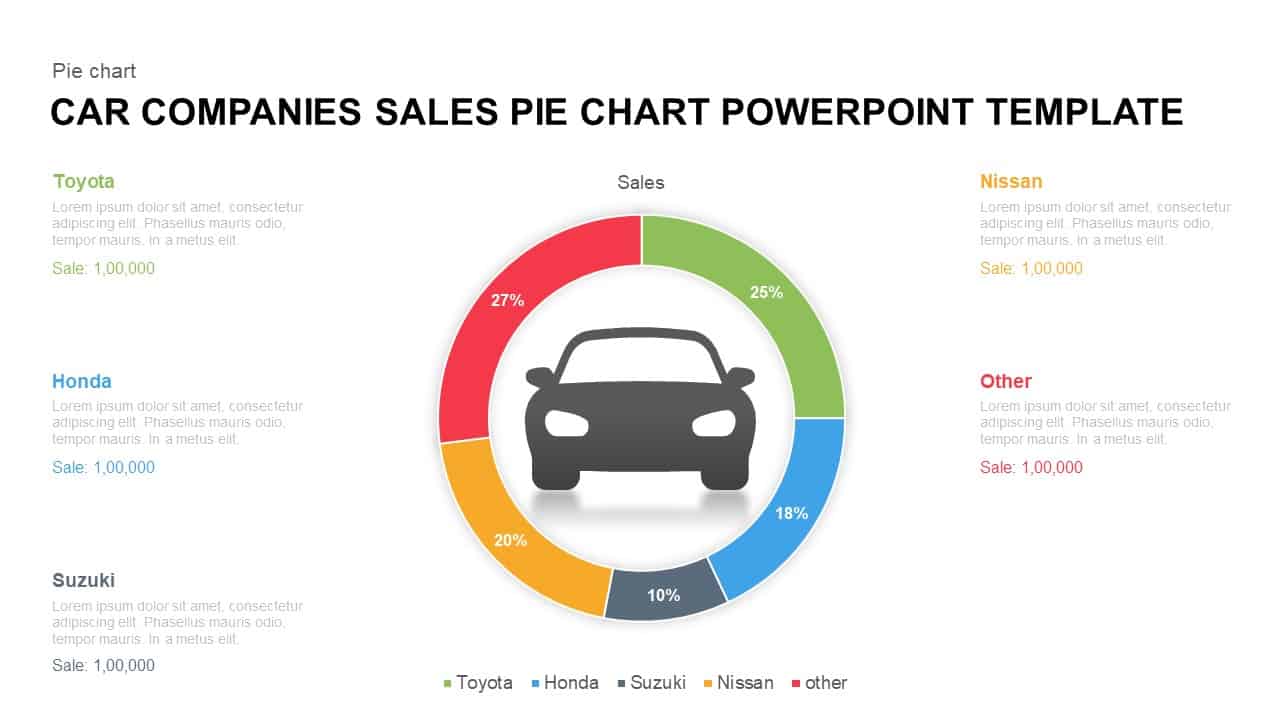
Car Companies Sales Pie Chart Template for PowerPoint & Keynote
Column and Bar chart
Premium
-
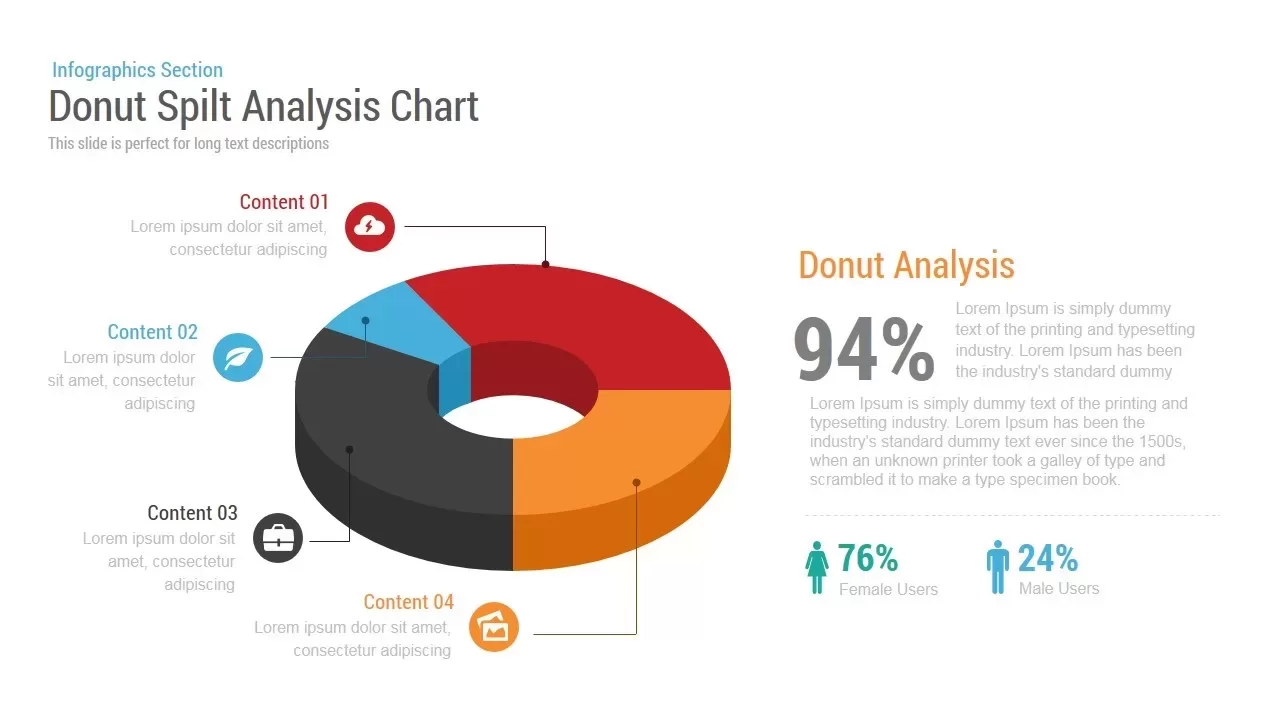
Donut Split Analysis Chart PowerPoint Template and Keynote Slide
Infographic
Premium
-
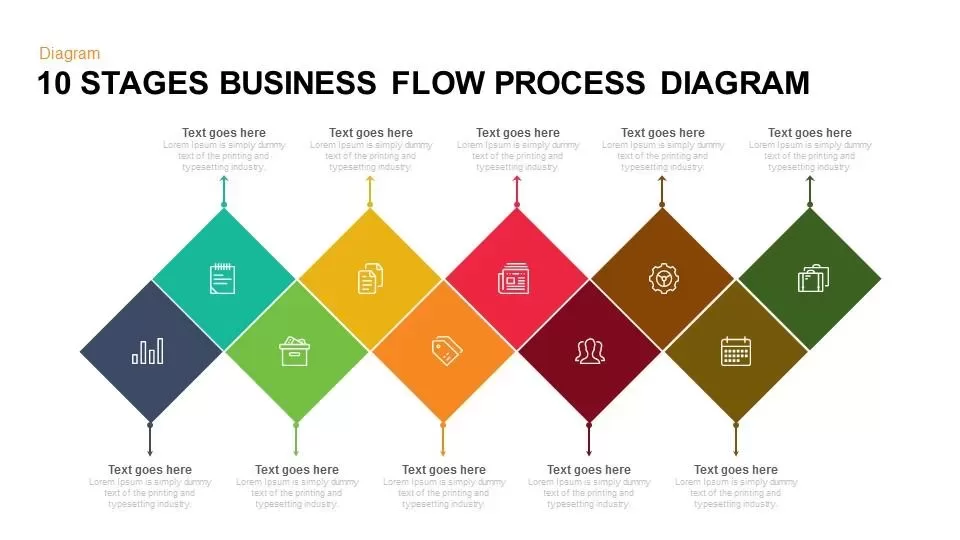
10 Stages Business Flow Process Diagram Template for PowerPoint and Keynote
Diagrams
Premium
-
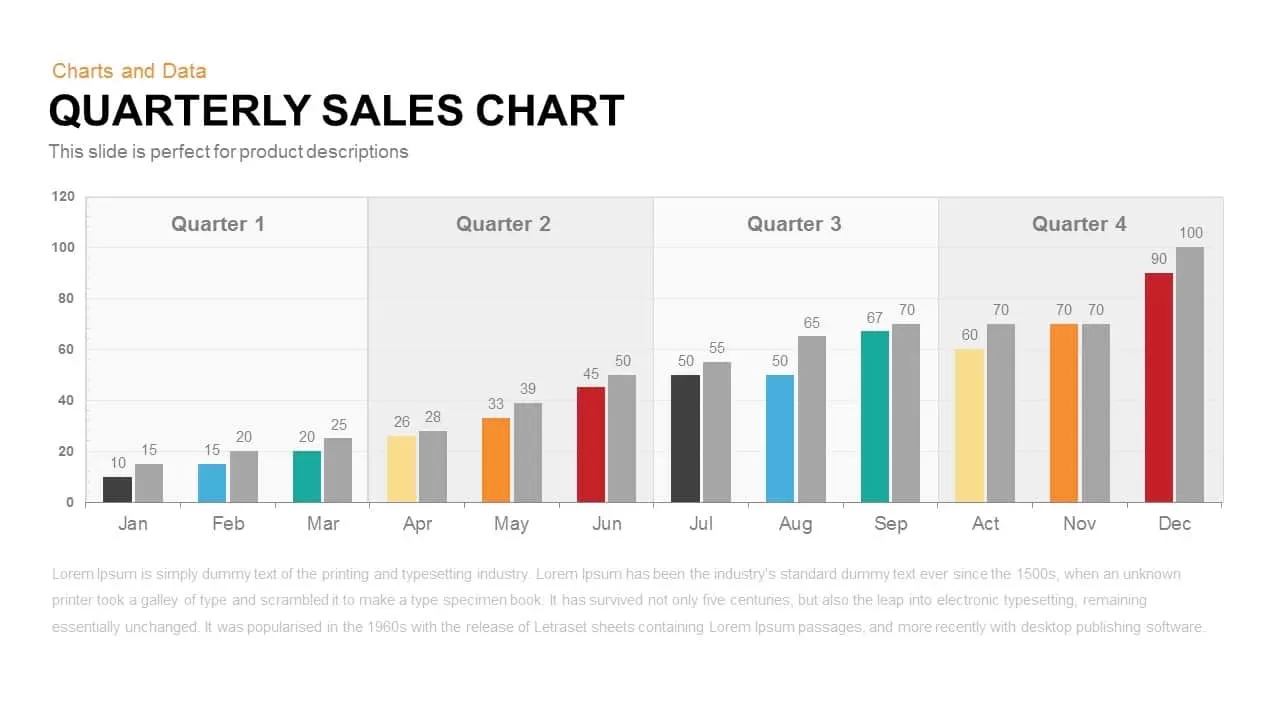
Quarterly Sales Chart PowerPoint Template and Keynote Slide
Column and Bar chart
Premium
-
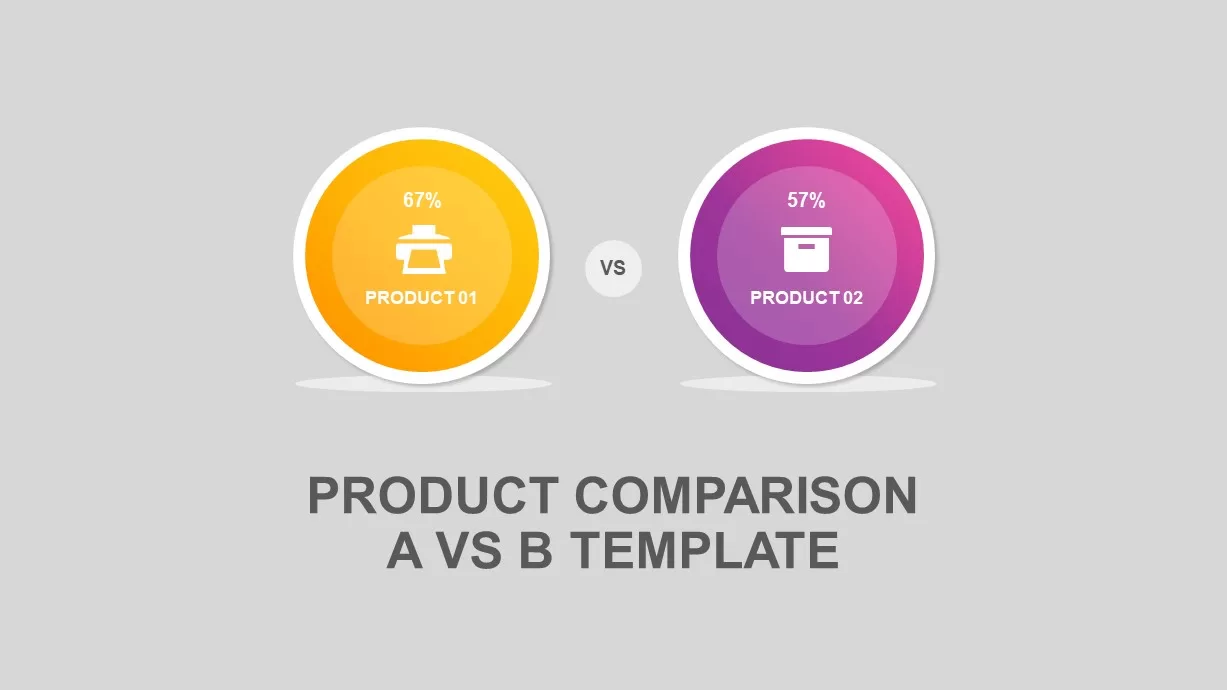
Product Comparison A vs B PowerPoint Template
Business Models
Premium
-

Annual Report PowerPoint Template and Keynote
PowerPoint Templates
Premium
-

Galerio Business Presentation PowerPoint Template
PowerPoint Business Templates
Premium
-
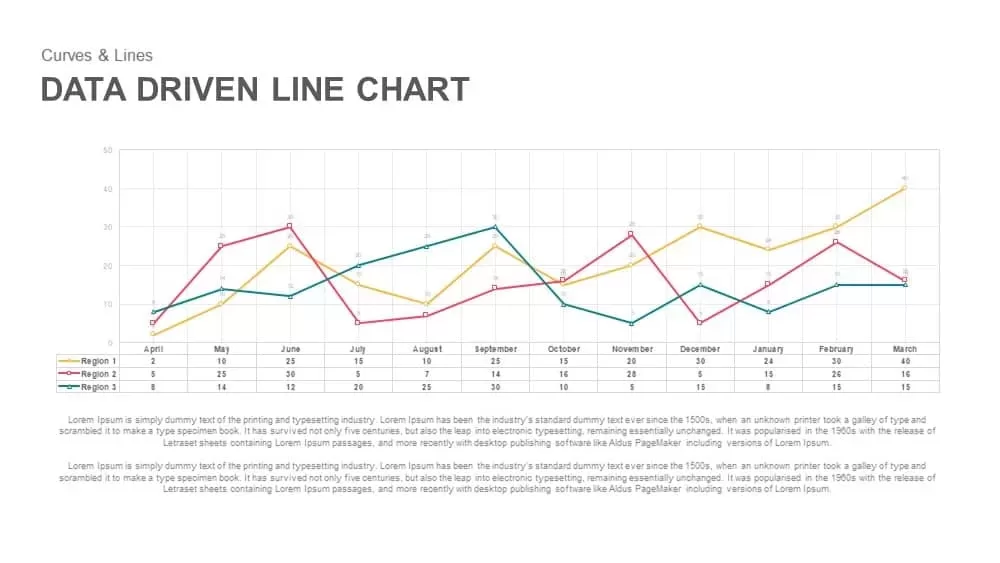
Data Driven Line Chart Template for PowerPoint & Keynote
Curves and Lines
Premium
-

Traditional Product Development Process
Business Models
Premium
-
Product Launch Presentation Template for PowerPoint and Keynote
Infographic
Premium
-
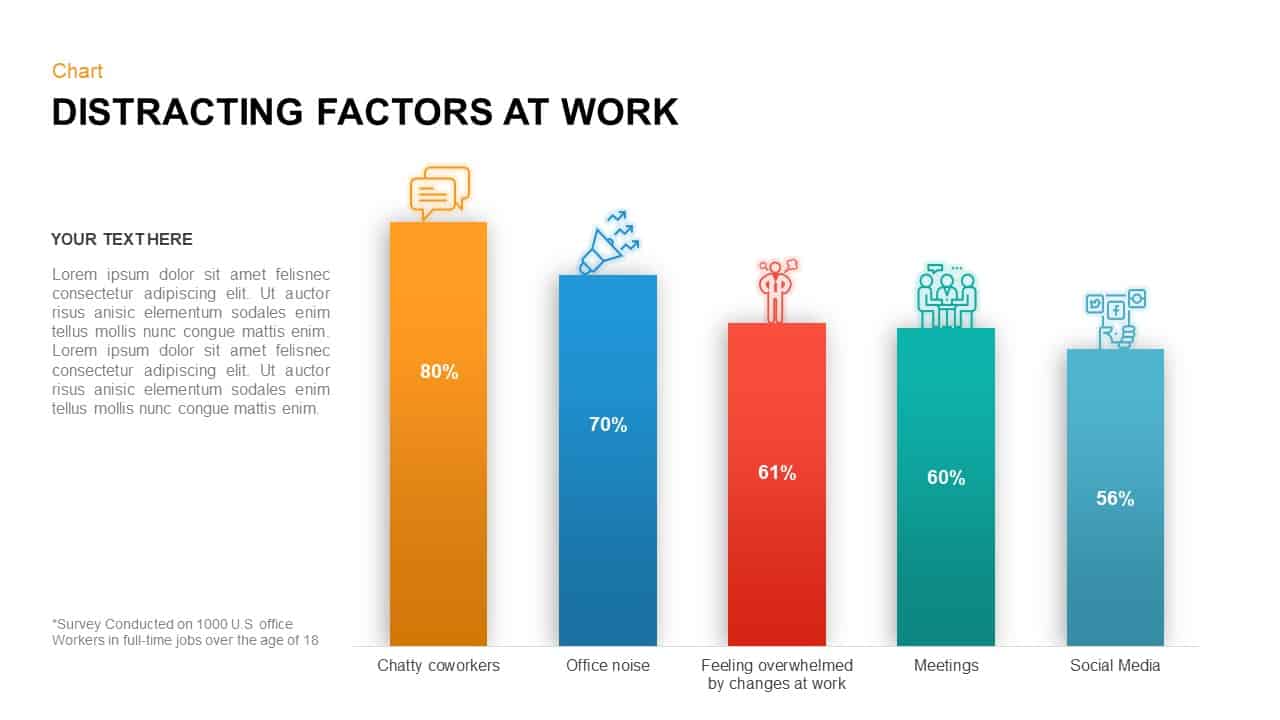
Distracting Factors at Work – Bar Chart Template for PowerPoint & Keynote
Column and Bar chart
Premium
-
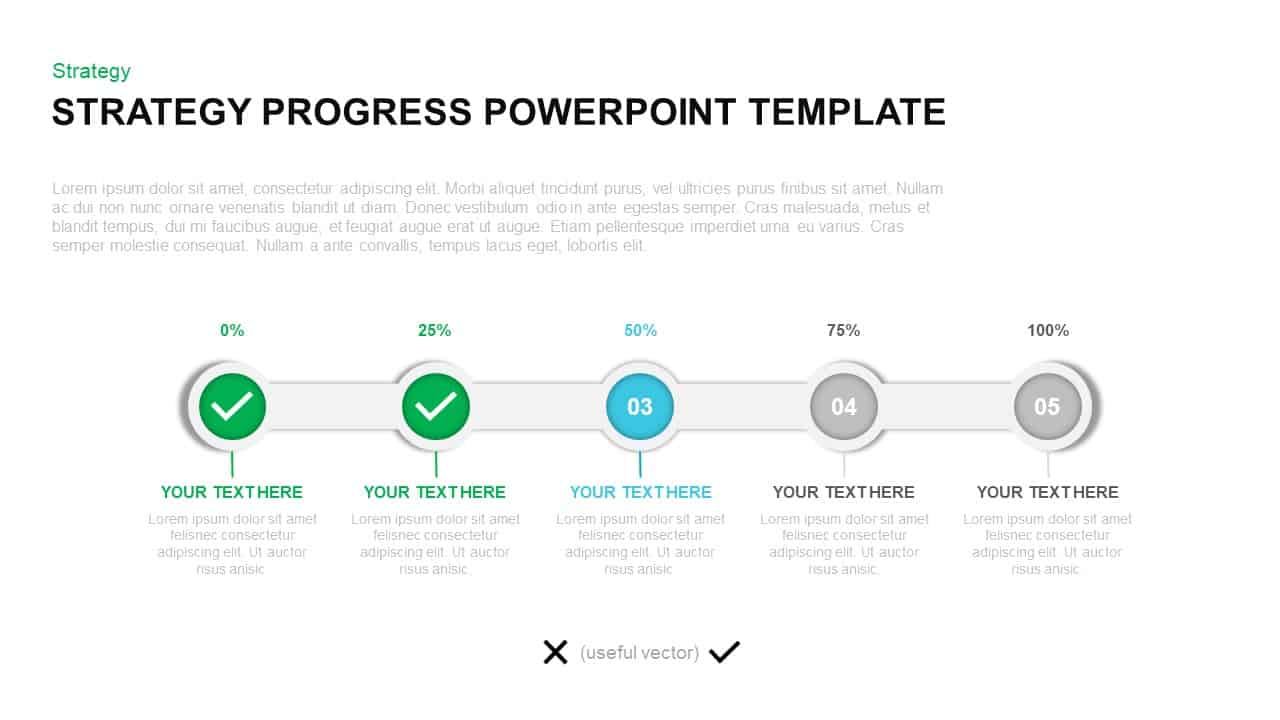
Strategy Progress Report Template for PowerPoint & Keynote
PowerPoint Templates
Premium
-
Cone Chart Data PowerPoint Template
Column and Bar chart
Premium
-
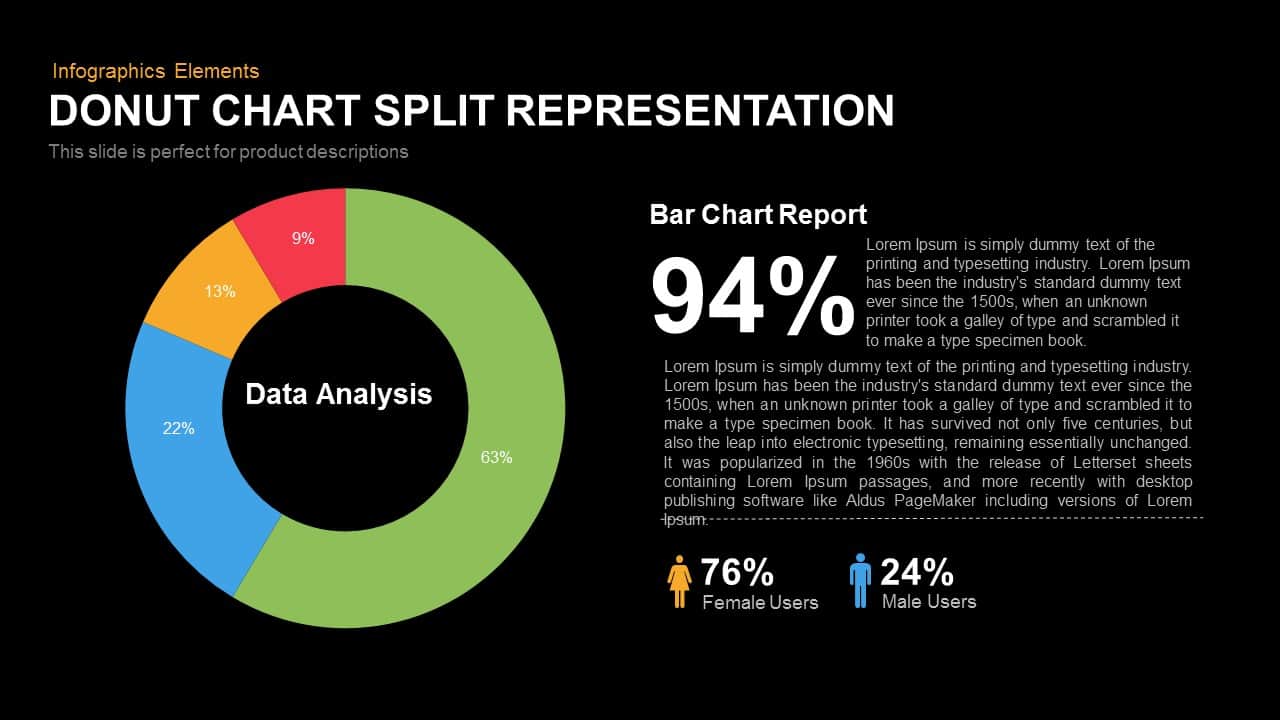
Split Representation Donut Chart Template for PowerPoint and Keynote
Keynote Templates
Premium
-
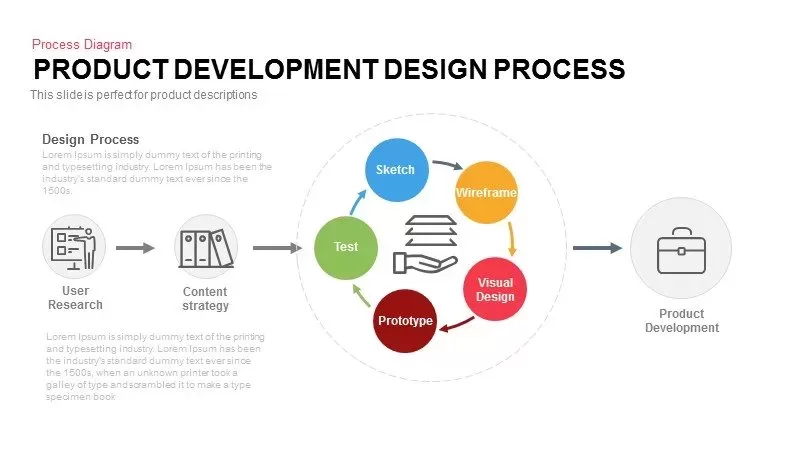
Product Development Design Process Template for PowerPoint and Keynote
Business Models
Premium
-
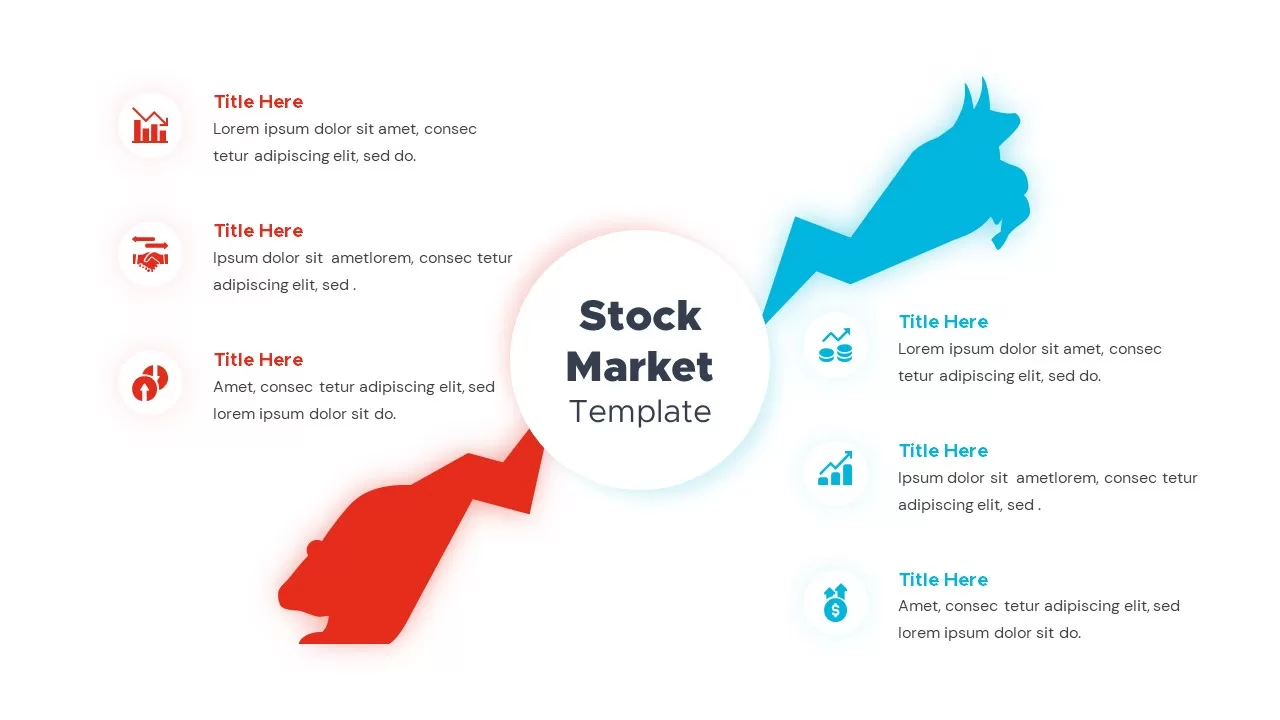
Stock Market Template
Infographic
Premium
-
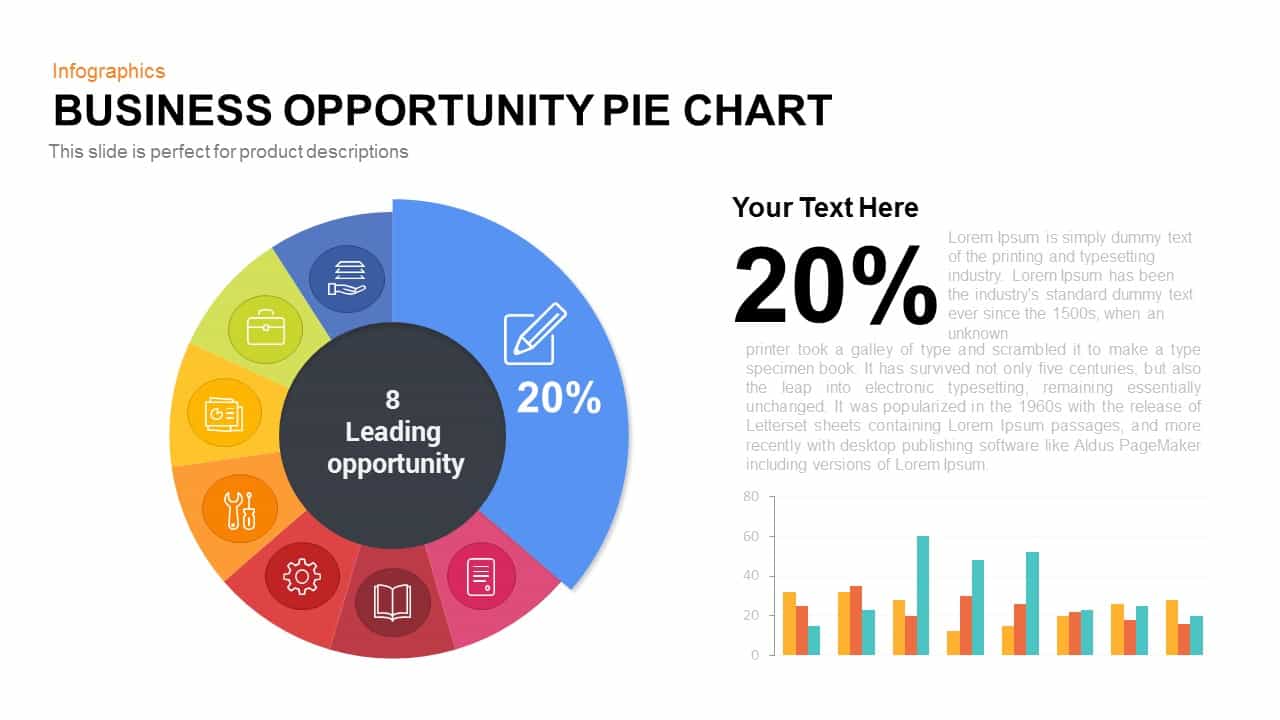
Business Opportunity PowerPoint Pie-Chart Template
Business Models
Premium
-

Proportional Area Chart PowerPoint Template
PowerPoint Templates
Premium
-
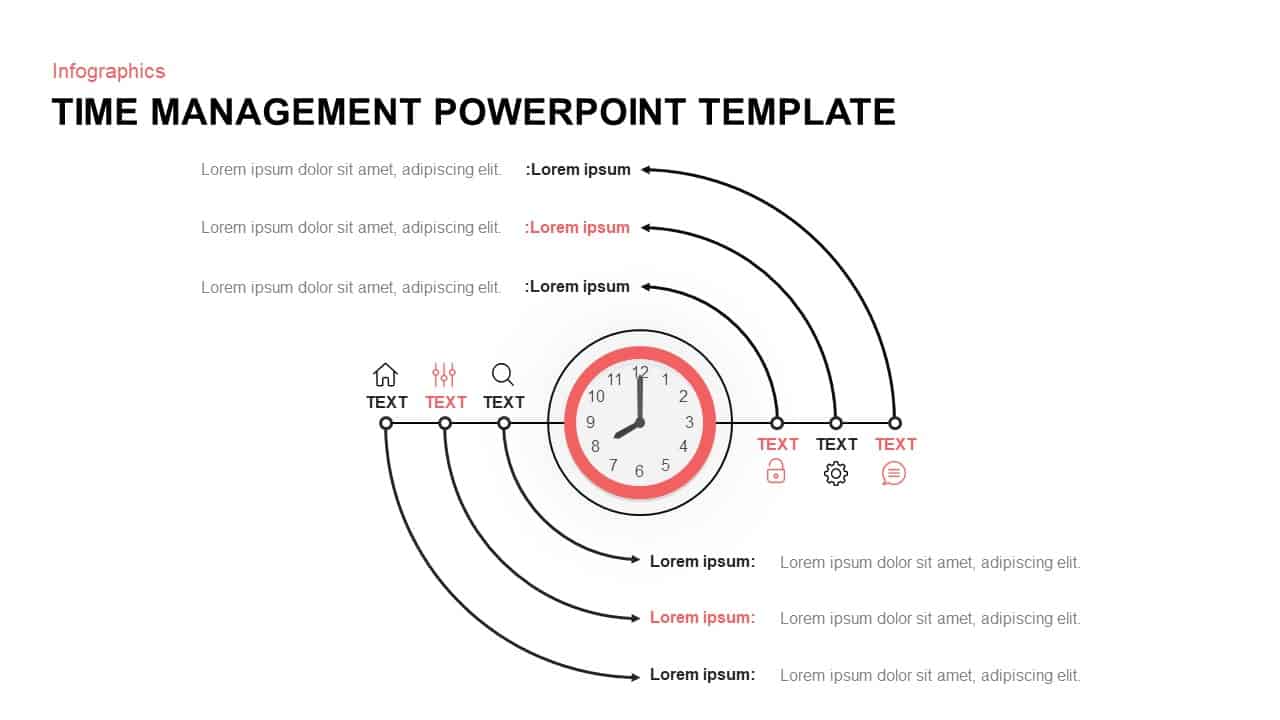
Time Management PowerPoint Template & Keynote Diagram
Timeline PowerPoint Template
Premium
-
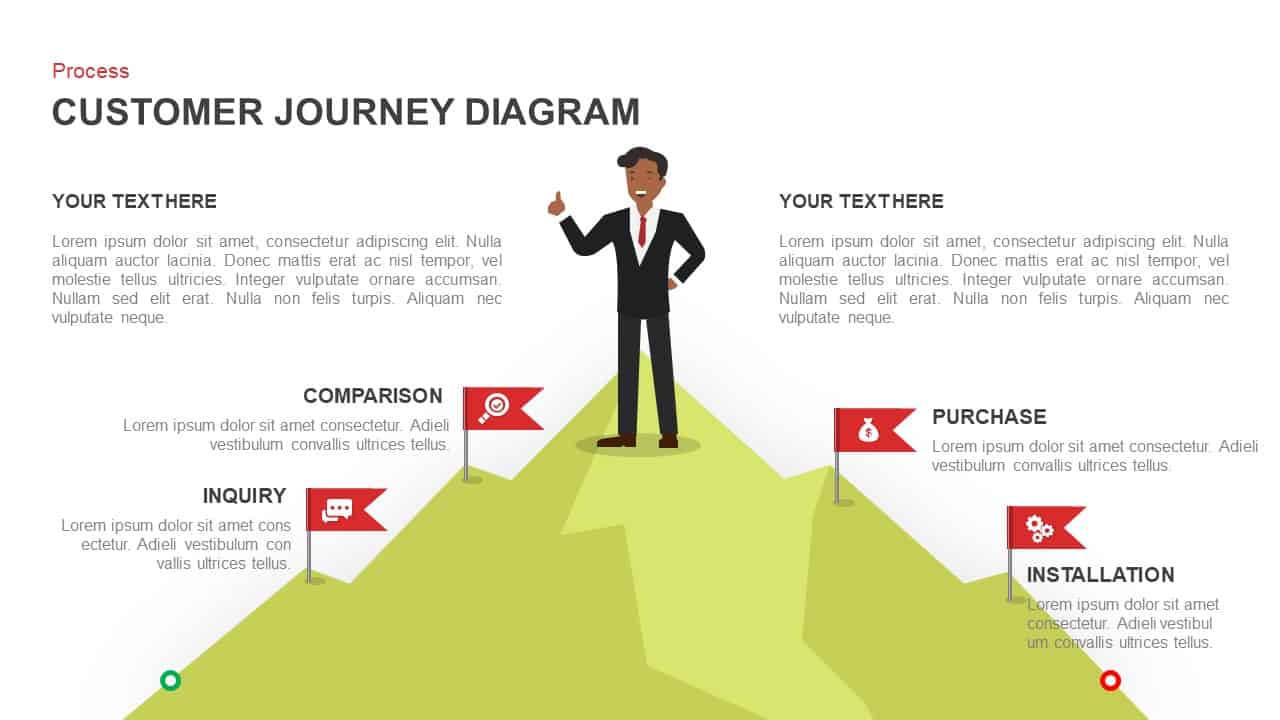
Customer Journey Diagram PowerPoint Template and Keynote Slide
Business Models
Premium
-
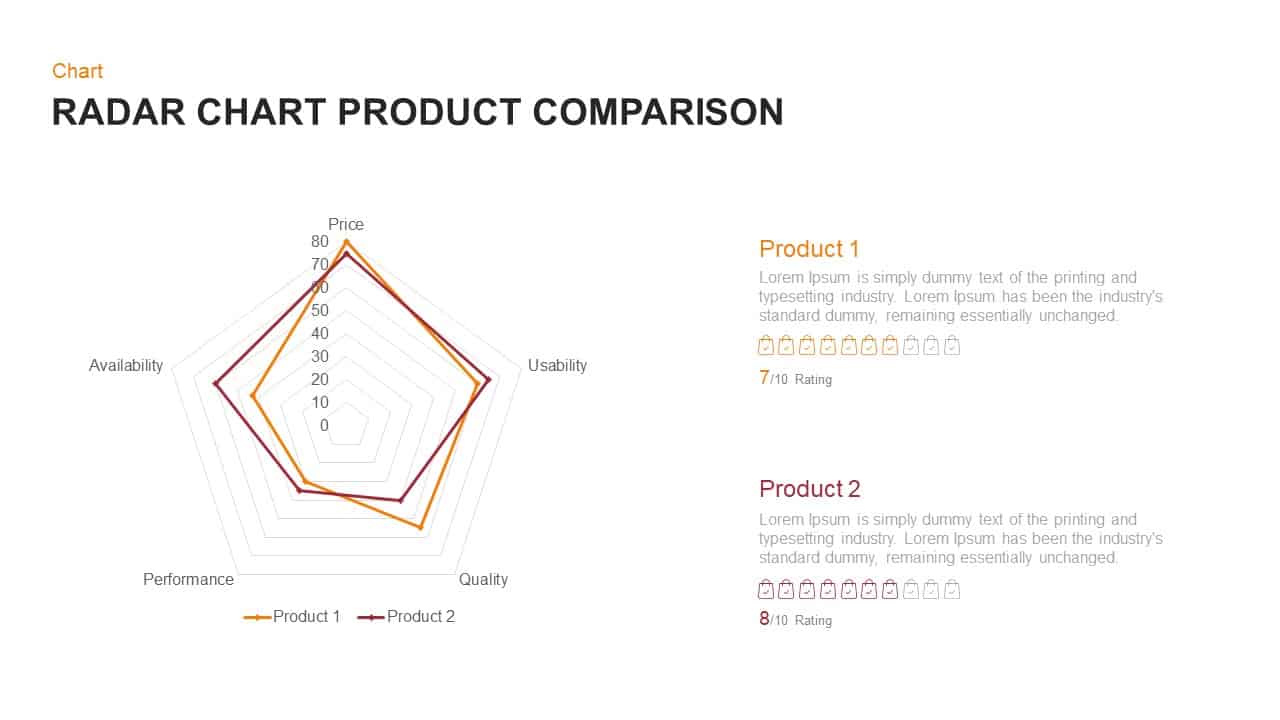
Radar Chart Product Comparison PowerPoint Template
Business Models
Premium
-
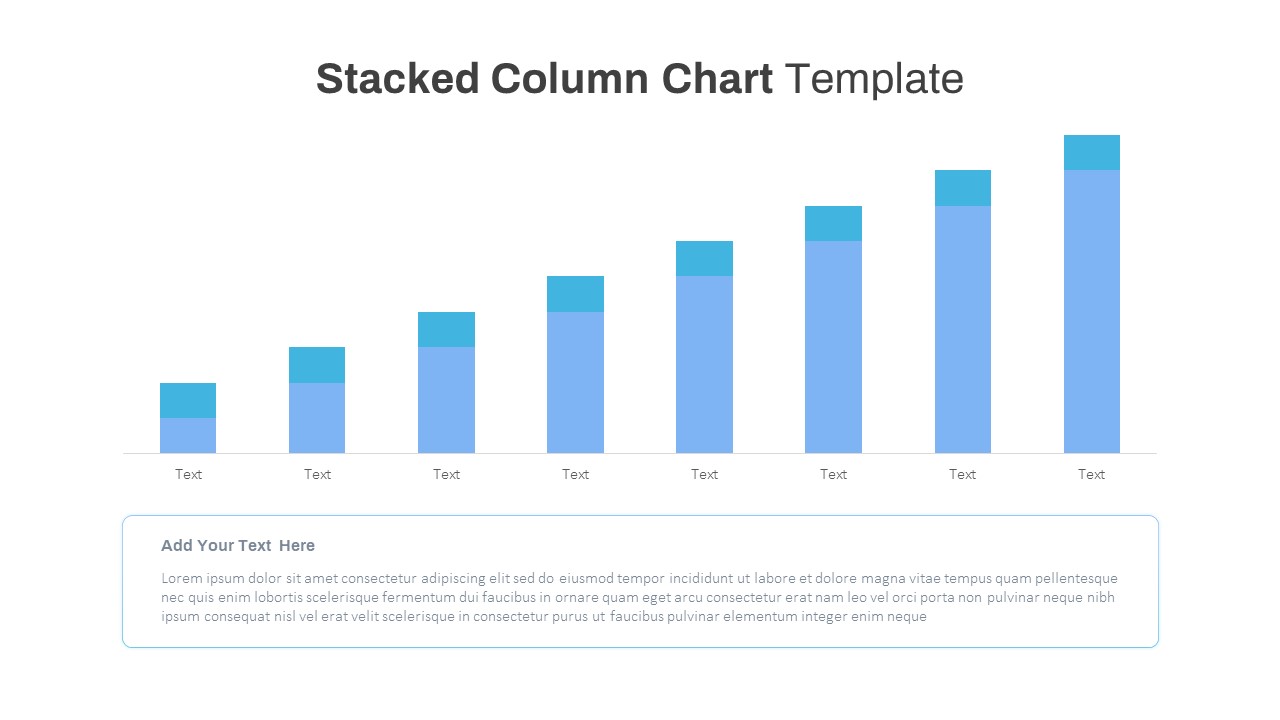
Free Stacked Column Chart Template
Column and Bar chart
Free
-
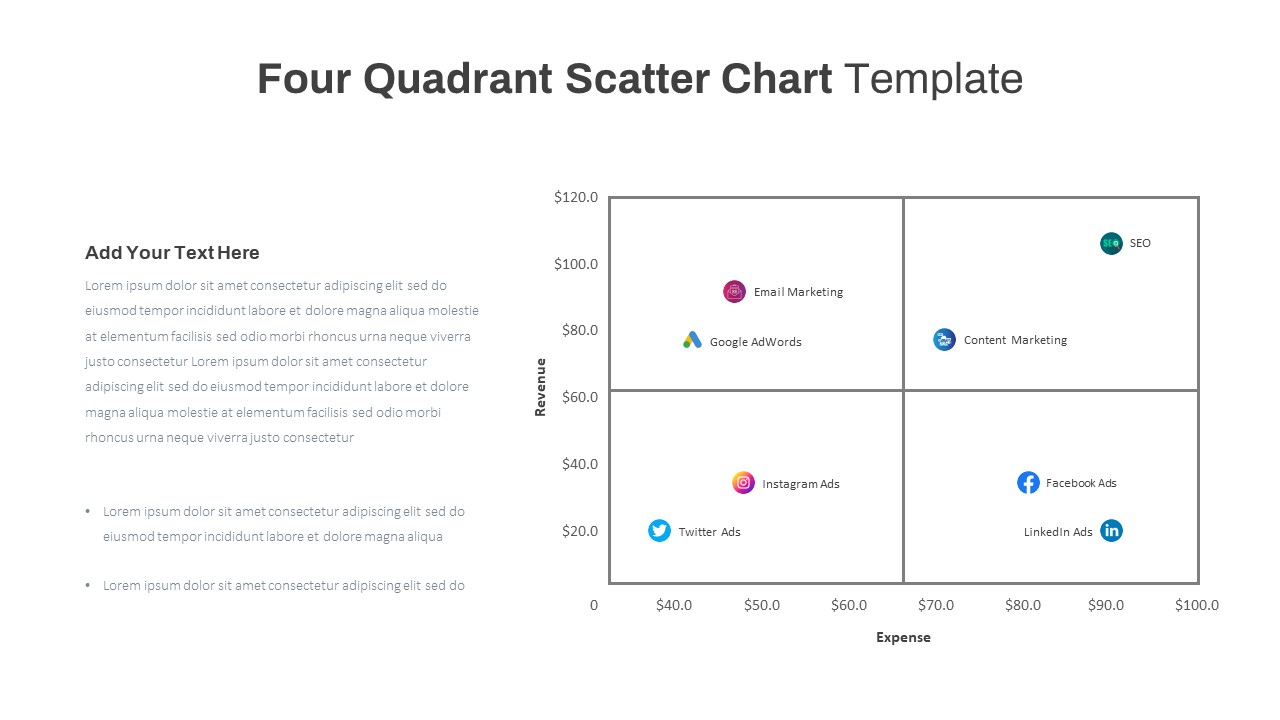
Four Quadrant Scatter Chart PowerPoint Template
PowerPoint Charts
Premium
-
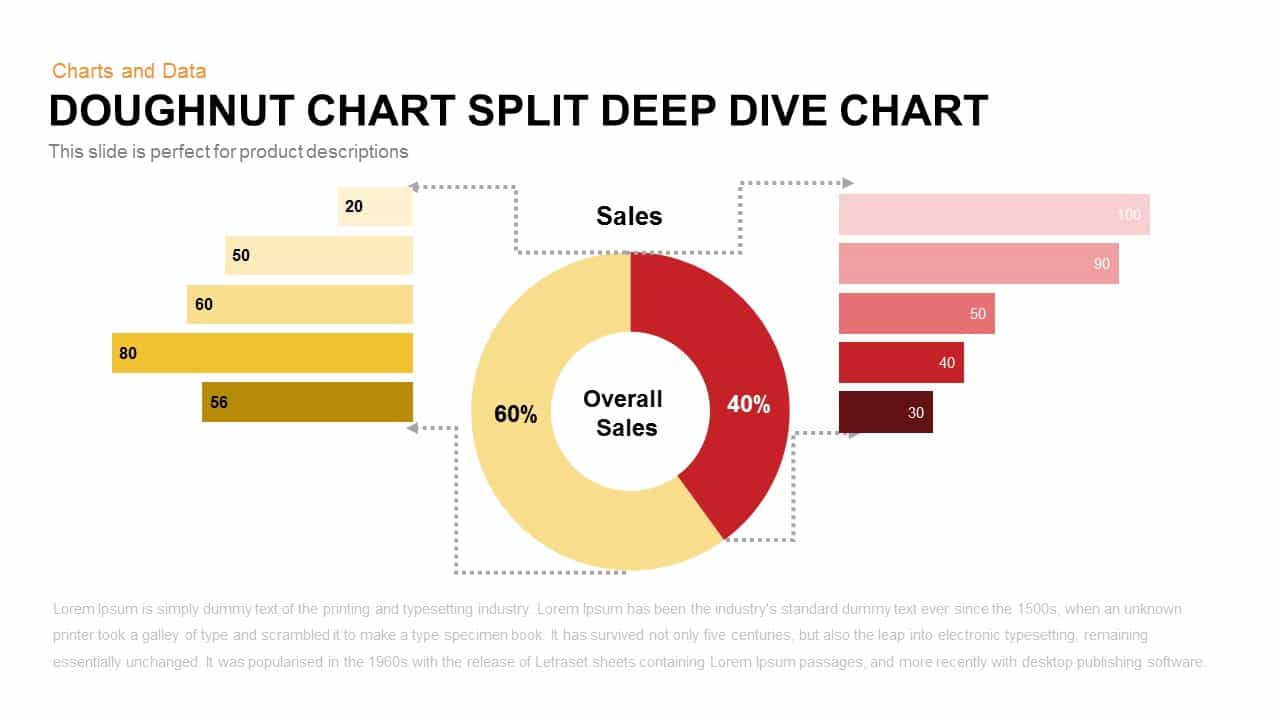
Donut Chart Split Deep Dive Chart Template For PowerPoint and Keynote
Keynote Templates
Premium
-
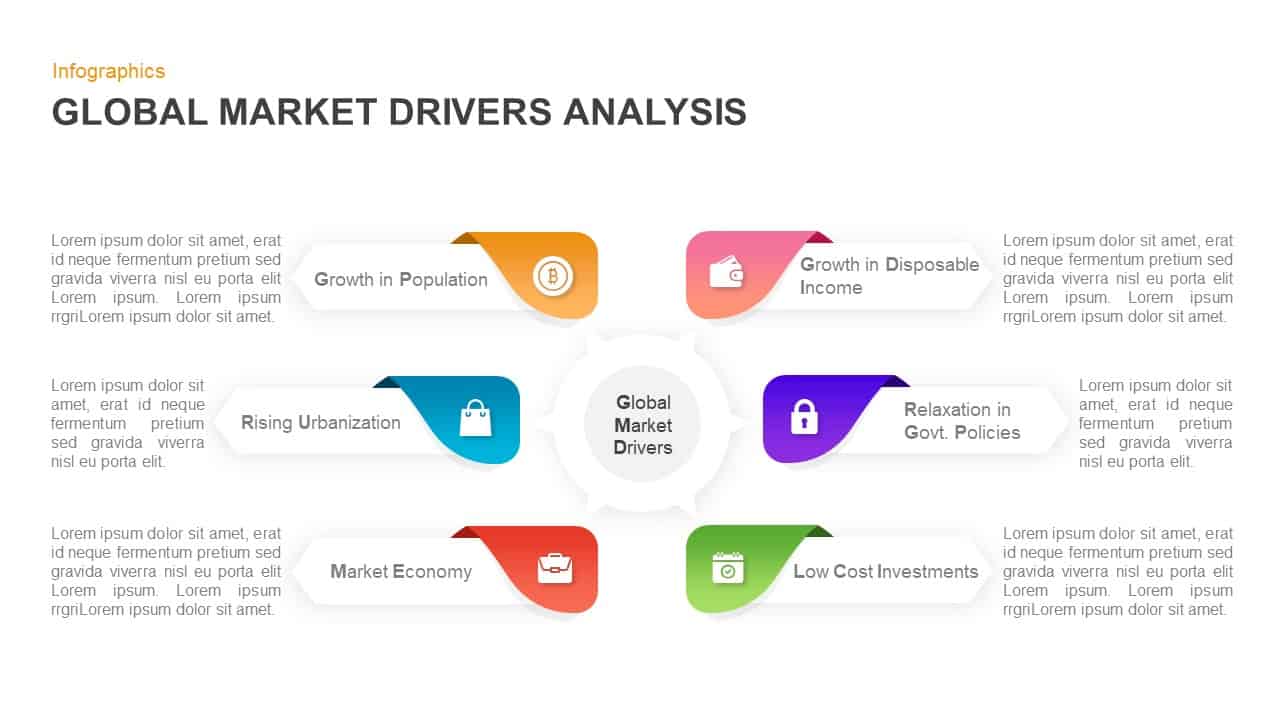
Global Market Drivers Analysis PowerPoint & Keynote
Circular Diagrams
Premium
-
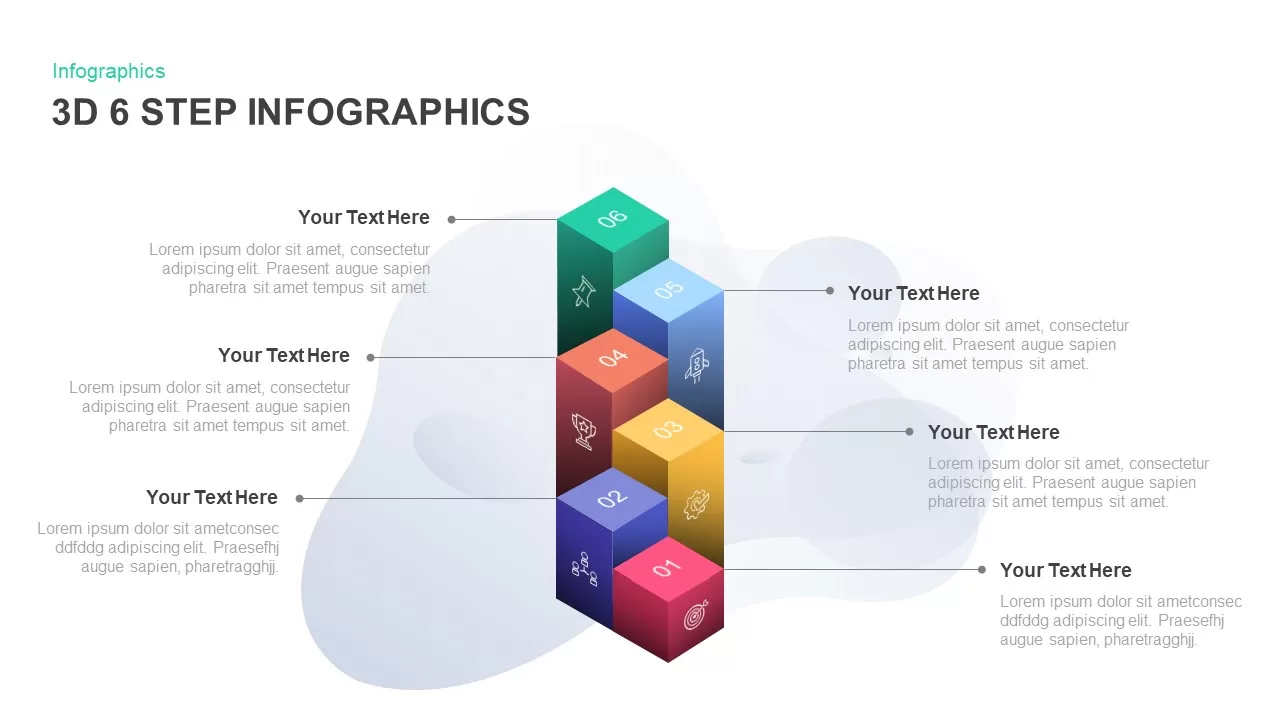
6 Step Infographic 3D PowerPoint Template & Keynote
3D Shapes
Premium
-
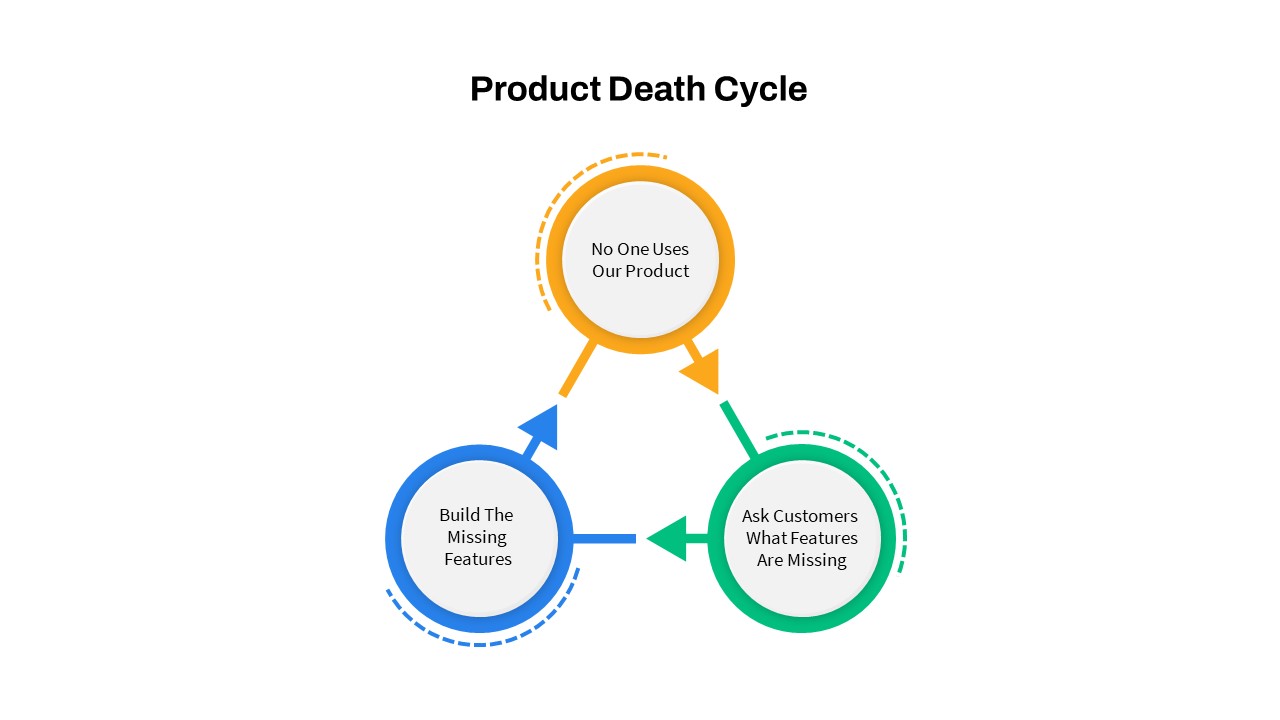
Product Death Cycle PowerPoint Template
PowerPoint Templates
Premium
-
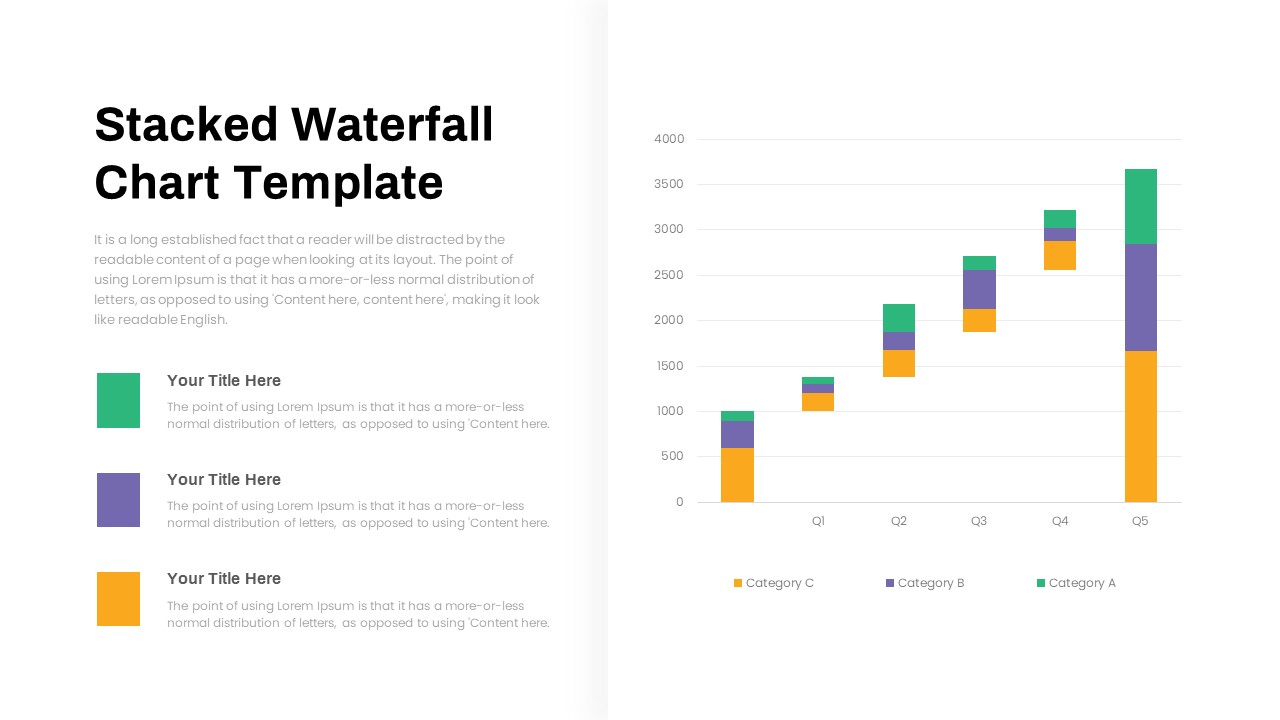
Stacked Waterfall Chart PowerPoint Template
PowerPoint Templates
Premium
-
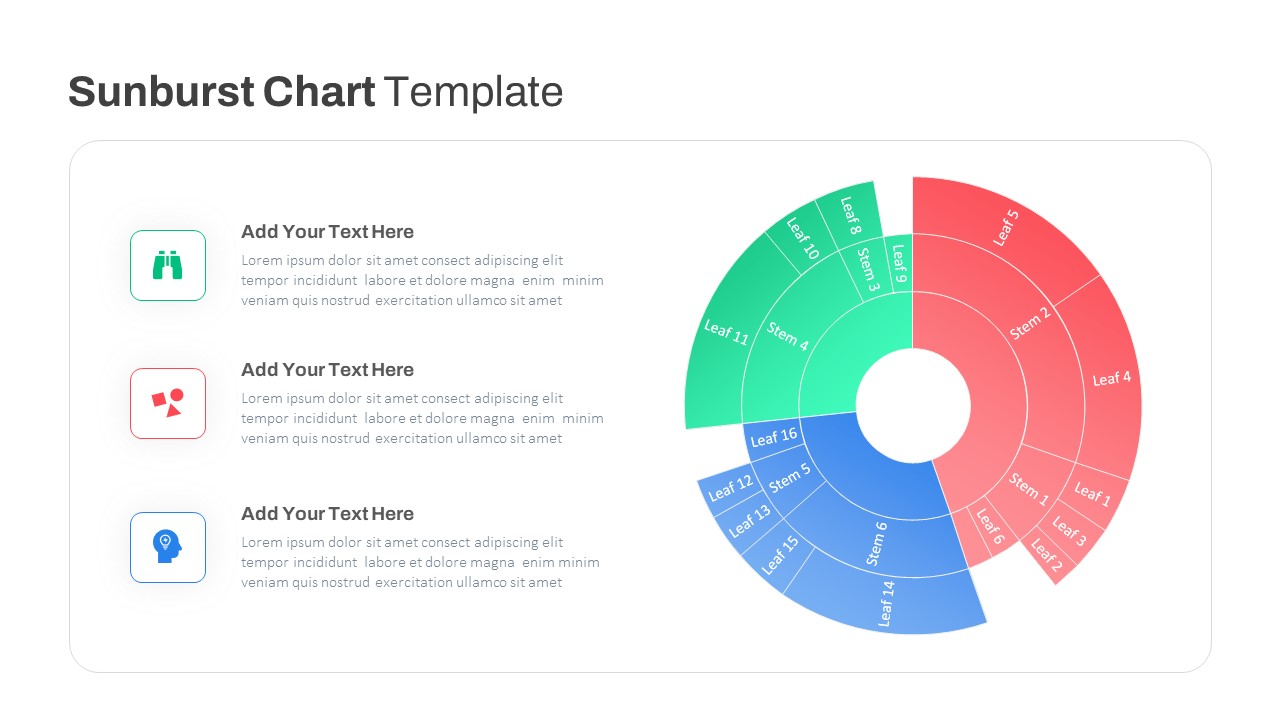
Sun Burst Chart PowerPoint Template
Circular Diagrams
Premium
-
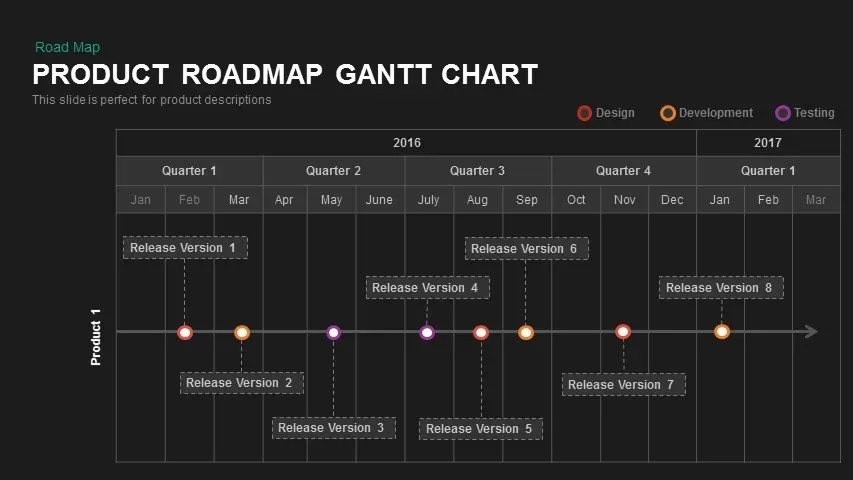
Product Roadmap Gantt Chart PowerPoint Template and Keynote
Business Models
Premium
-
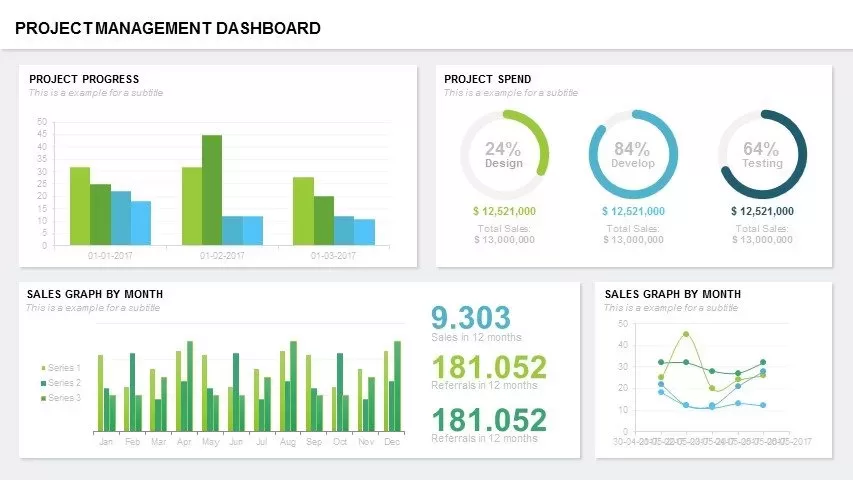
Project Management Dashboard PowerPoint Template and Keynote Template
PowerPoint Templates
Premium
-
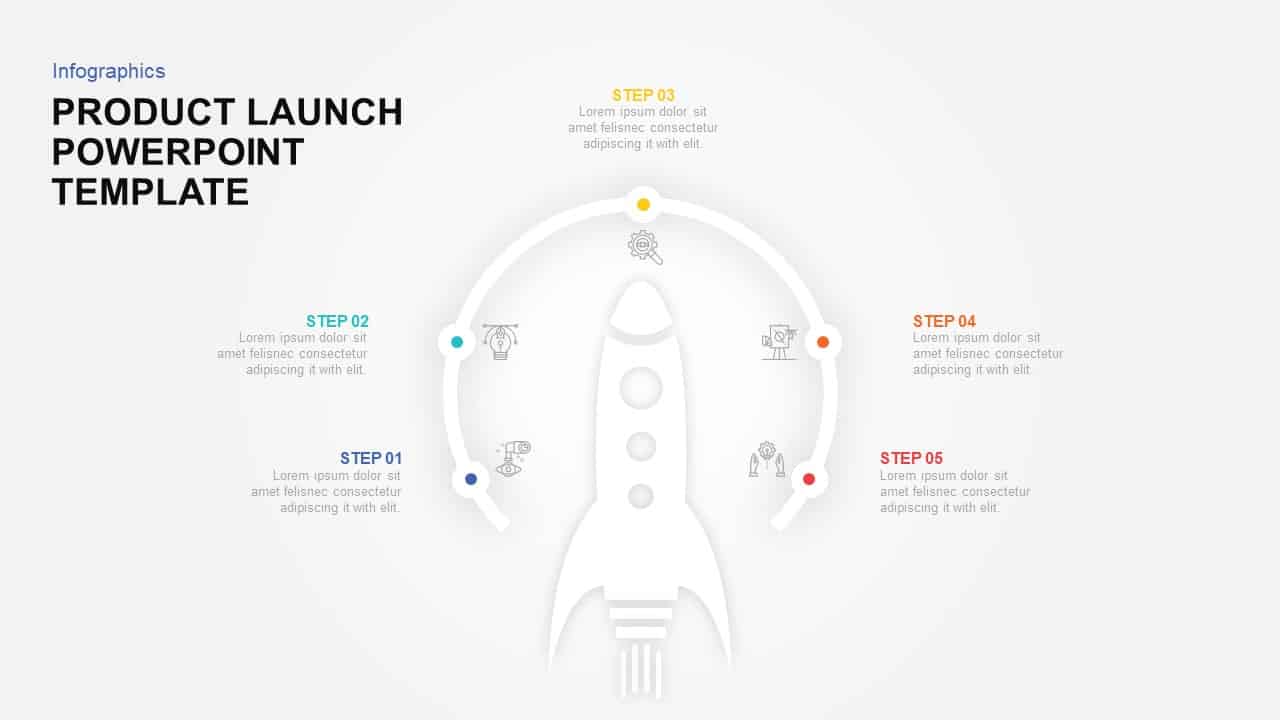
Product Launch Template for PowerPoint & Keynote
Business Models
Premium
-
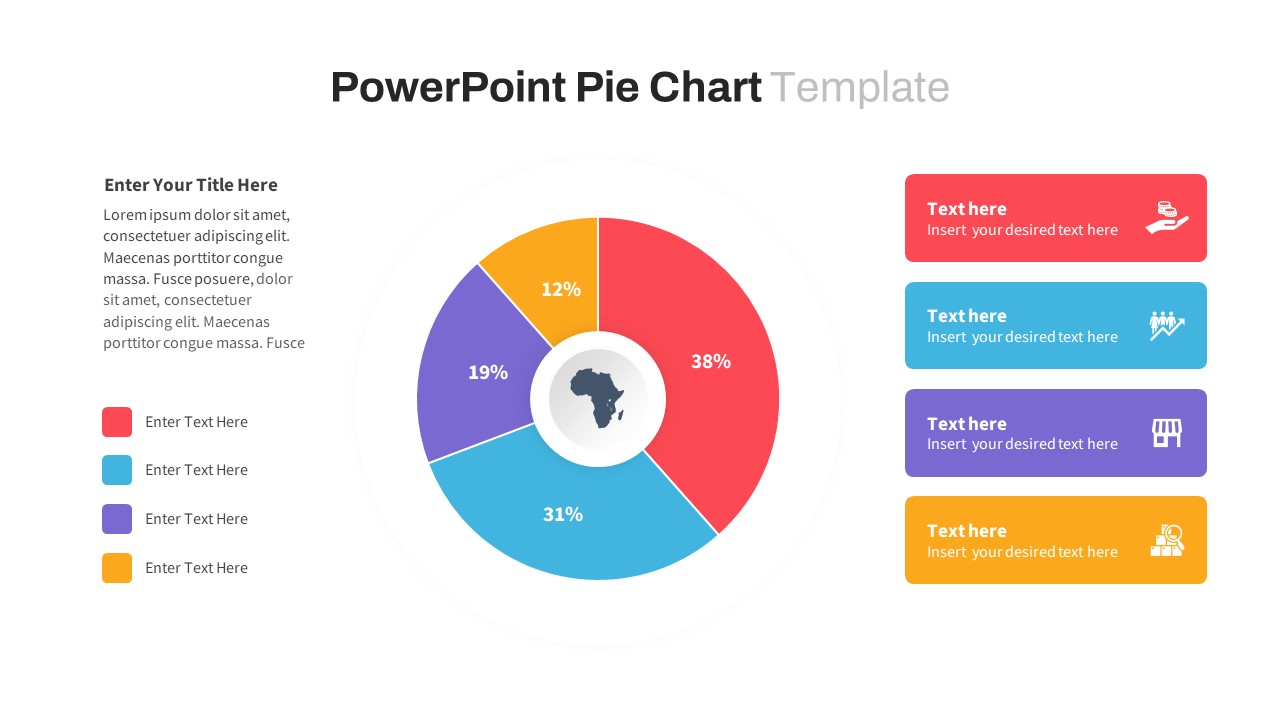
Pie Chart PowerPoint Template
Infographic
Premium
-
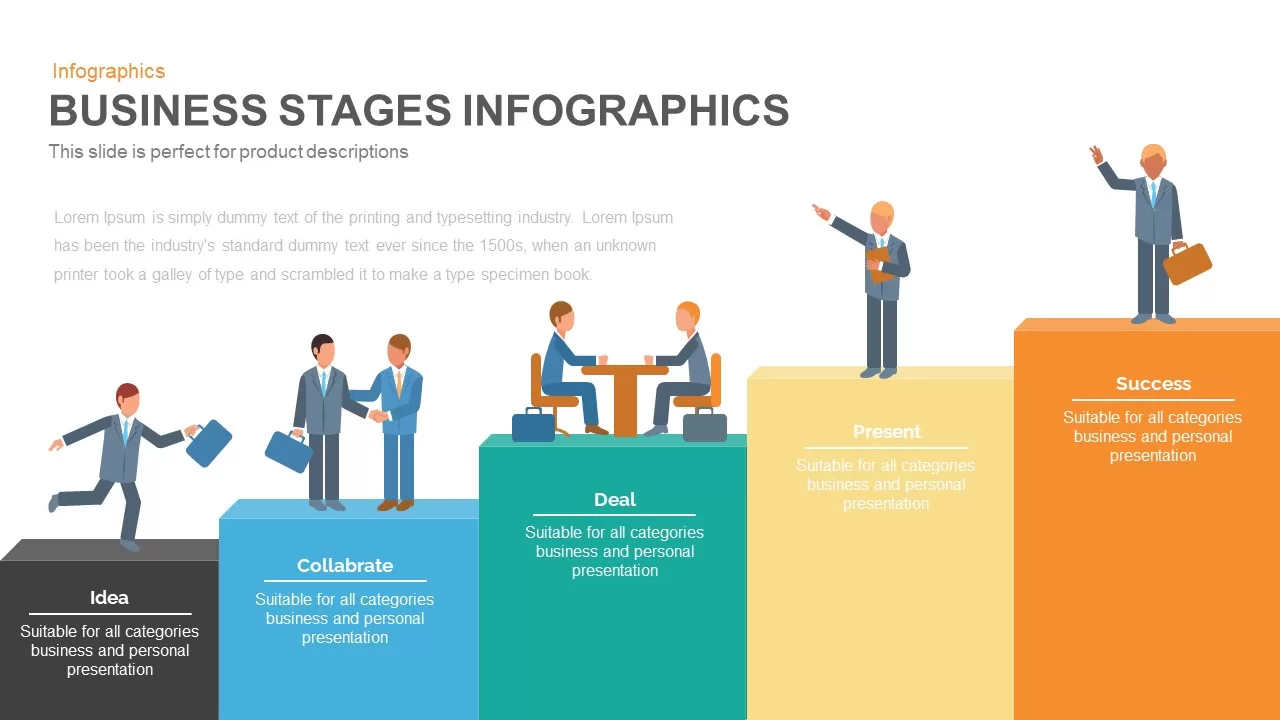
Business Stages Infographics Template for PowerPoint and Keynote
Business Models
Premium
-
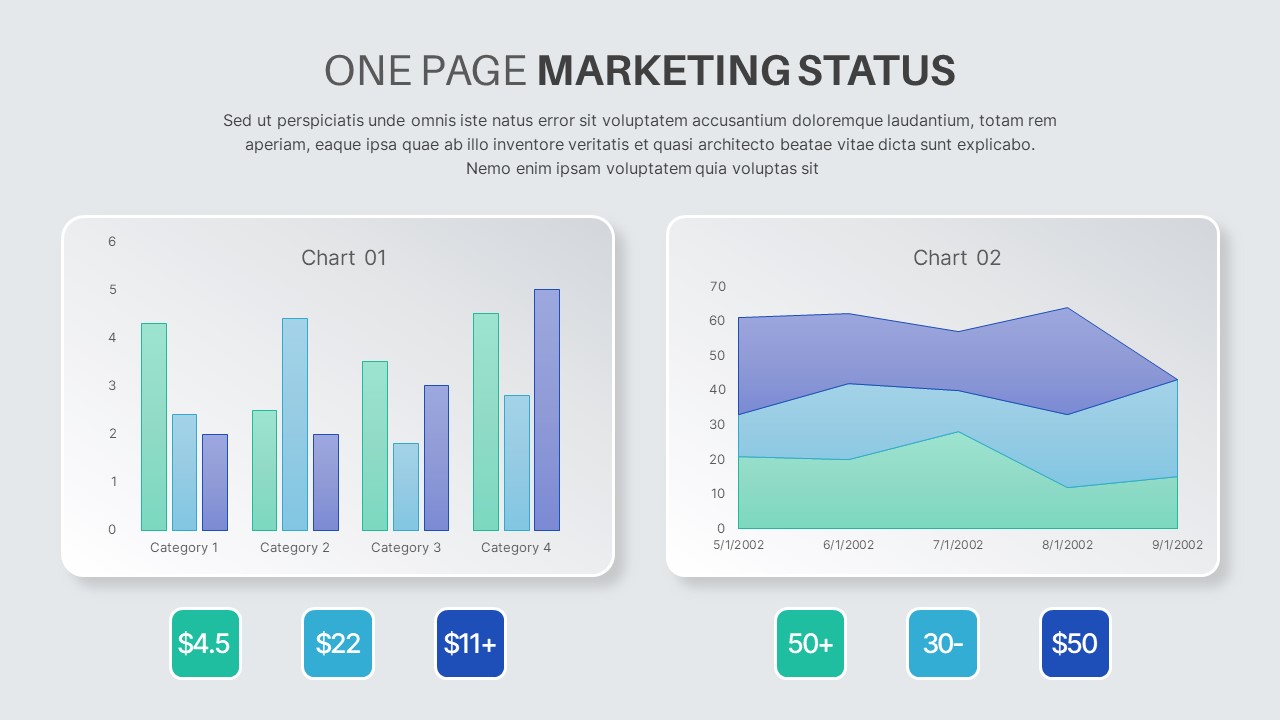
One Pager Marketing Status PowerPoint Template
PowerPoint Templates
Premium
-
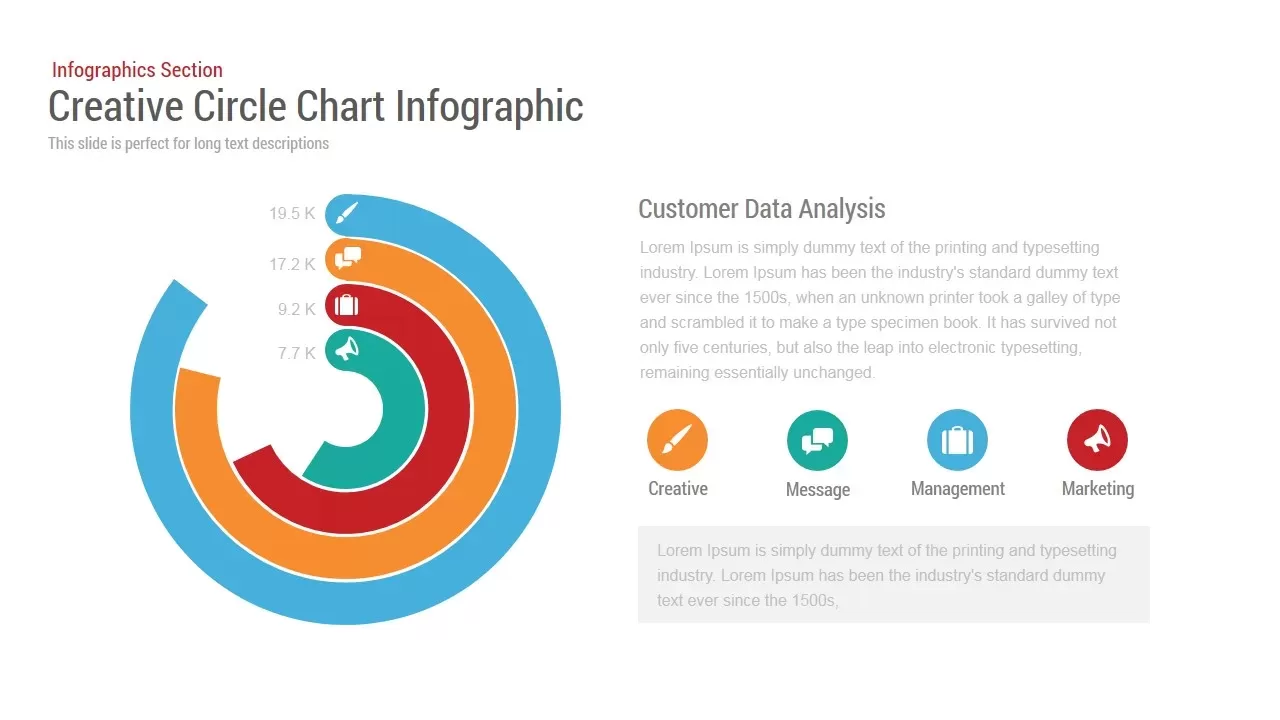
Circle Chart Infographic PowerPoint Template and Keynote
Infographic
Premium
-
Daily Timeline Template PowerPoint
Timeline PowerPoint Template
Premium