Staging Environment
search

Essentials

Must-have decks for quick wins

By Industry

Professionally tailored slides for every sector

By Style

Minimal, modern and creative designs

By Topic

Explore slides curated by purpose and theme

TimelineTimelineRoadmapRoadmapStrategyStrategyCompany ProfileCompany ProfileTableTableComparisonComparisonSWOTSWOTAgendaAgendaListListArrowArrowMapsMapsProcessProcessStagesStagesCircularCircularFunnelFunnelTeamTeamOrg ChartOrg Chart

FinanceFinanceAccountingAccountingKPIKPIRevenueRevenueTechnologyTechnologySoftware DevelopmentSoftware DevelopmentAdvertisingAdvertisingBrand StrategyBrand StrategyCustomer journeyCustomer journeyHealthHealthMedicalMedicalNursingNursing

Business PlanBusiness PlanBusiness StrategyBusiness StrategyBusiness ProcessBusiness ProcessBusiness ProposalBusiness ProposalDigital MarketingDigital MarketingMarketing FunnelMarketing FunnelCustomer ExperienceCustomer ExperienceGantt chartGantt chartRisk ManagementRisk ManagementScrumScrumProject StatusProject StatusRecruitmentRecruitmentEmployee performanceEmployee performanceLeadershipLeadershipAI PowerPoint TemplateAI PowerPoint TemplateInformation TechnologyInformation TechnologyCloud ComputingCloud ComputingMachine LearningMachine Learning

AI Presentation Maker

Install the Windows plugin for quick access to templates and design tools.

AI Infographics Maker

Use our Office 365 add - in to access templates directly from the cloud.

Exe Version

Install the Windows plugin for quick access to templates and design tools.

Office 365

Use our Office 365 add - in to access templates directly from the cloud.

Mac Version

Get the Mac plugin to easily browse, insert, and customize templates and visuals within PowerPoint.

100% Stacked Column Chart

This template is part of a deck featuring multiple slides. To check out all slides, click on See All. See All round right arrow

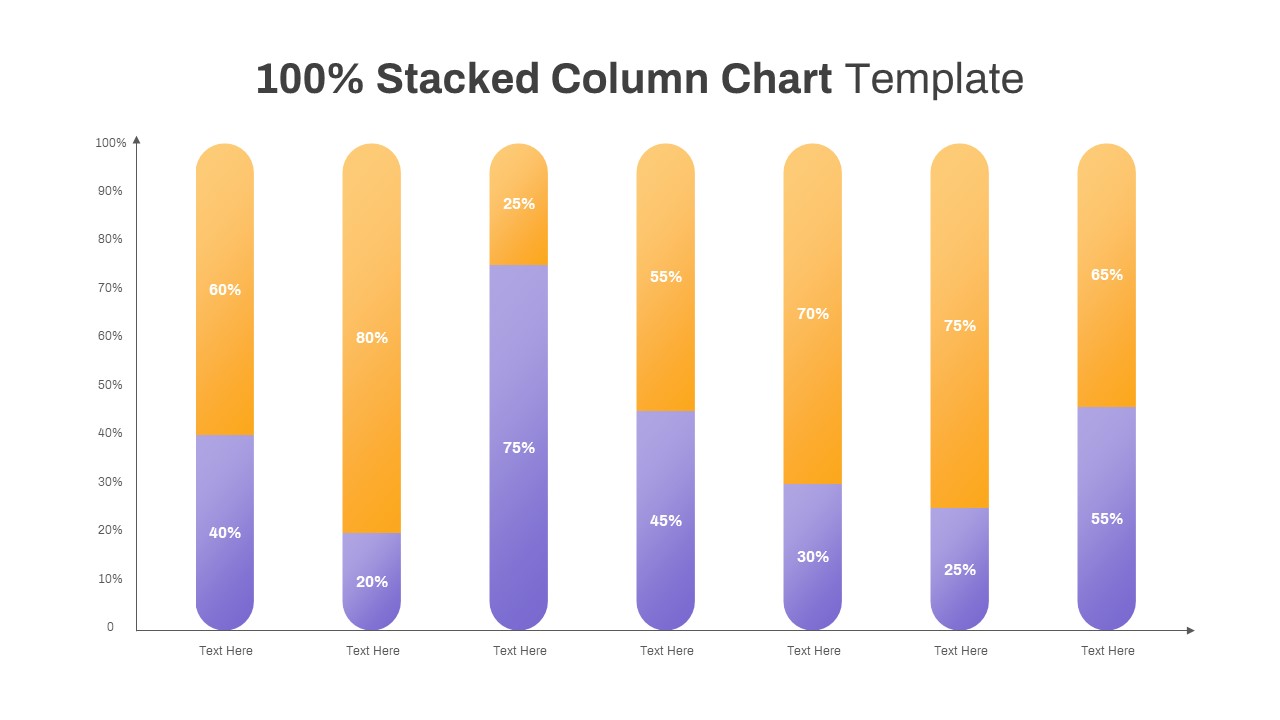
The 100% Stacked Column Chart PowerPoint Template offers a visually appealing way to present data with its stacked bar chart. This versatile PowerPoint template allows you to showcase variables in a single bar, utilizing color differentiation for enhanced clarity. Stacked bar charts are ideal for comparing the total values of different categories and understanding the composition of the data. With the 100% Stacked Column Chart PowerPoint Template, you can visualize the relationship between the whole and its parts effectively. By examining the lengths of segments within each bar, you can gain insights into how sub-categories contribute to the overall total. This template divides each bar into segments, representing various sub-categories or components. The length of each segment corresponds to its value or proportion. The 100% Stacked Column Chart PowerPoint Template is perfect for business reports, research outcomes, and academic presentations. This template combines functionality with a color-coded scheme to help differentiate between categories of data. Whether you are showcasing departmental productivity or any other data, this template enables clear visualization. For instance, if you are analyzing productivity rates for males and females, you can assign violet to females and yellow to males. By using this chart, you can present the highest and lowest productivity rates for both genders. This 100% Stacked Column Chart provides a visually appealing representation of data, facilitating understanding and interpretation. Elevate your presentations to new heights with SlideBazaar's professional templates and custom design services. Also, check out this weekly data chart template.