Pie Chart & Donut Chart Templates for PowerPoint & Keynote
Check out our library of pie chart and donut chart templates and use them to display your data in circular graph.
Filter
Filter
-
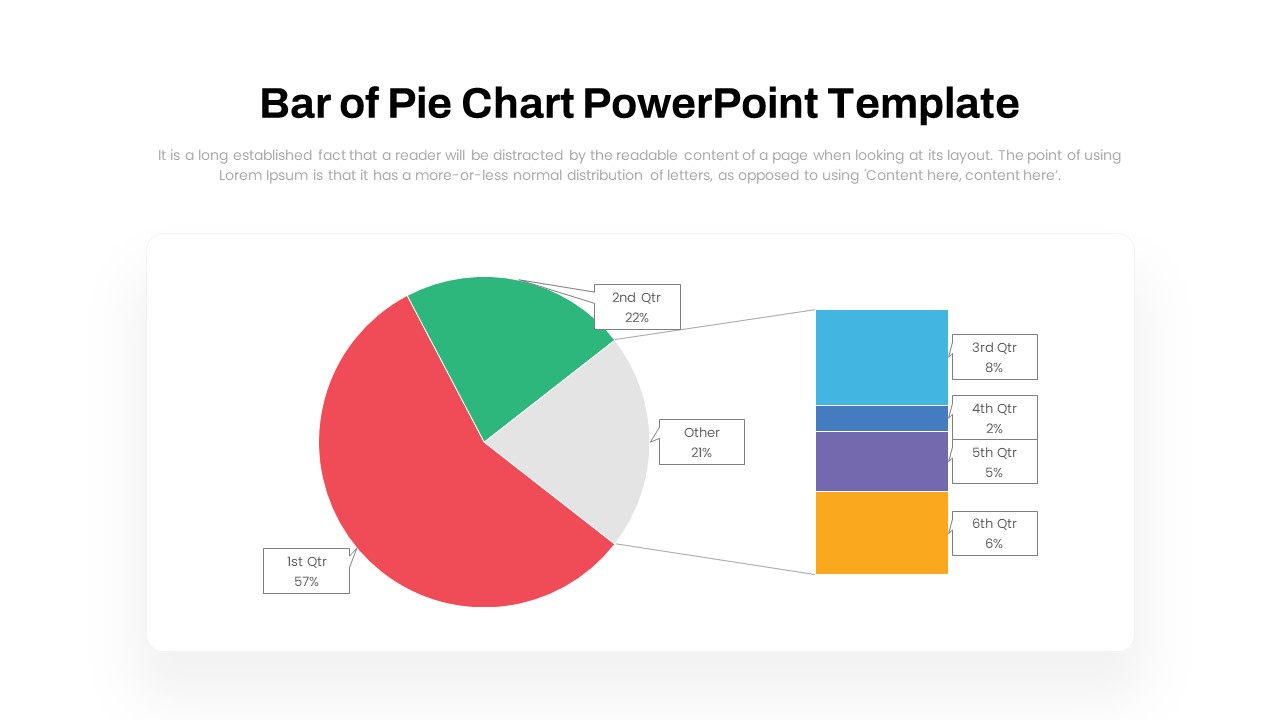
Bar of Pie Chart PowerPoint Template
PowerPoint Templates
Premium
-
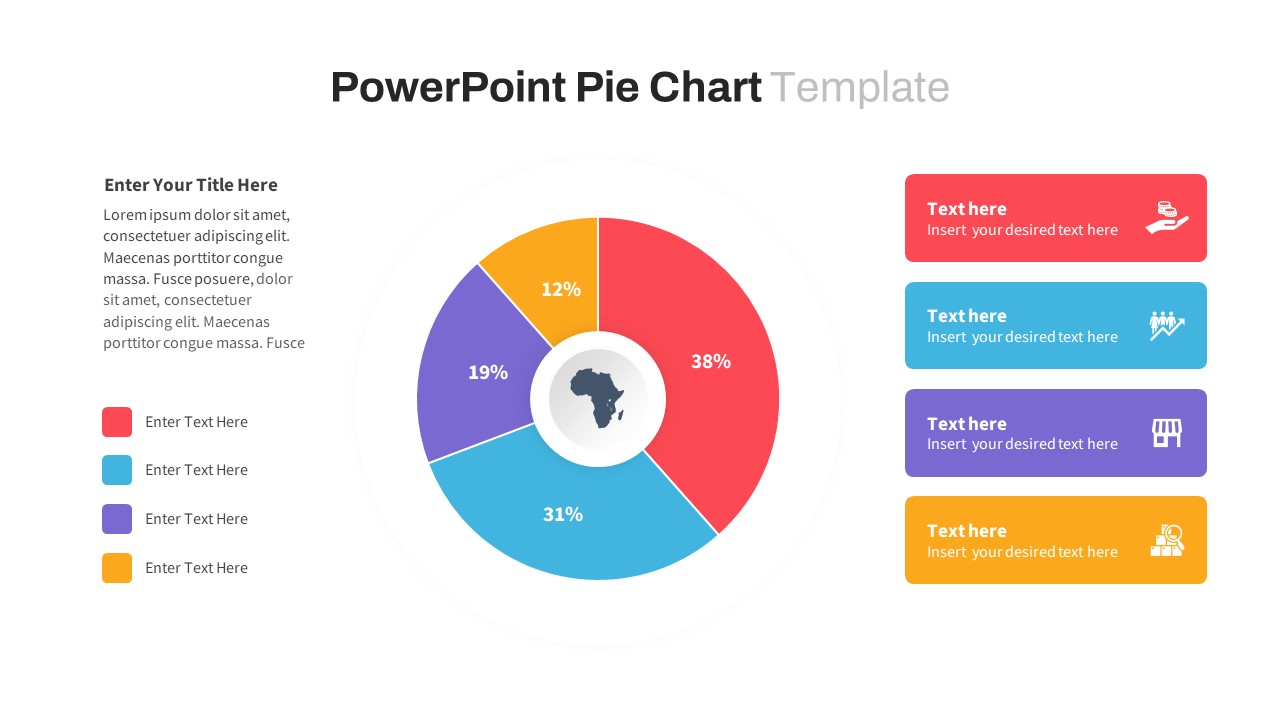
Pie Chart PowerPoint Template
Infographic
Premium
-
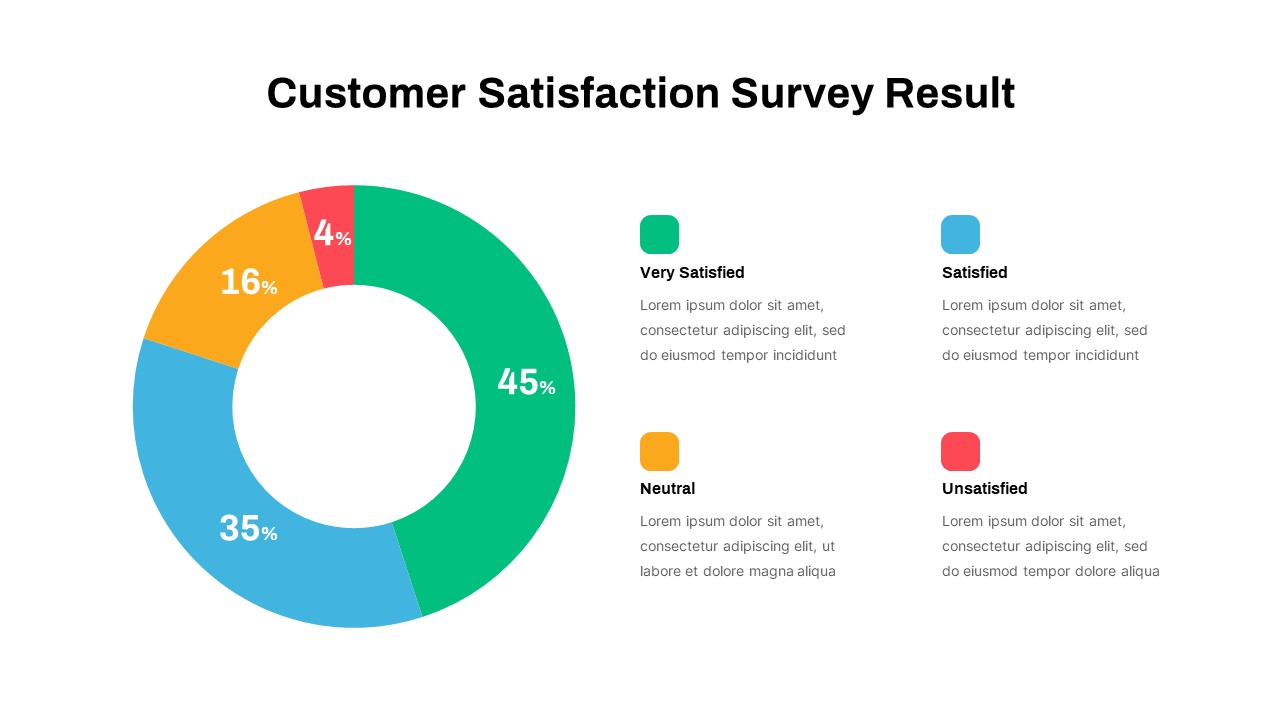
Customer Satisfaction Survey Result PowerPoint Template
Pie & Donut
Premium
-
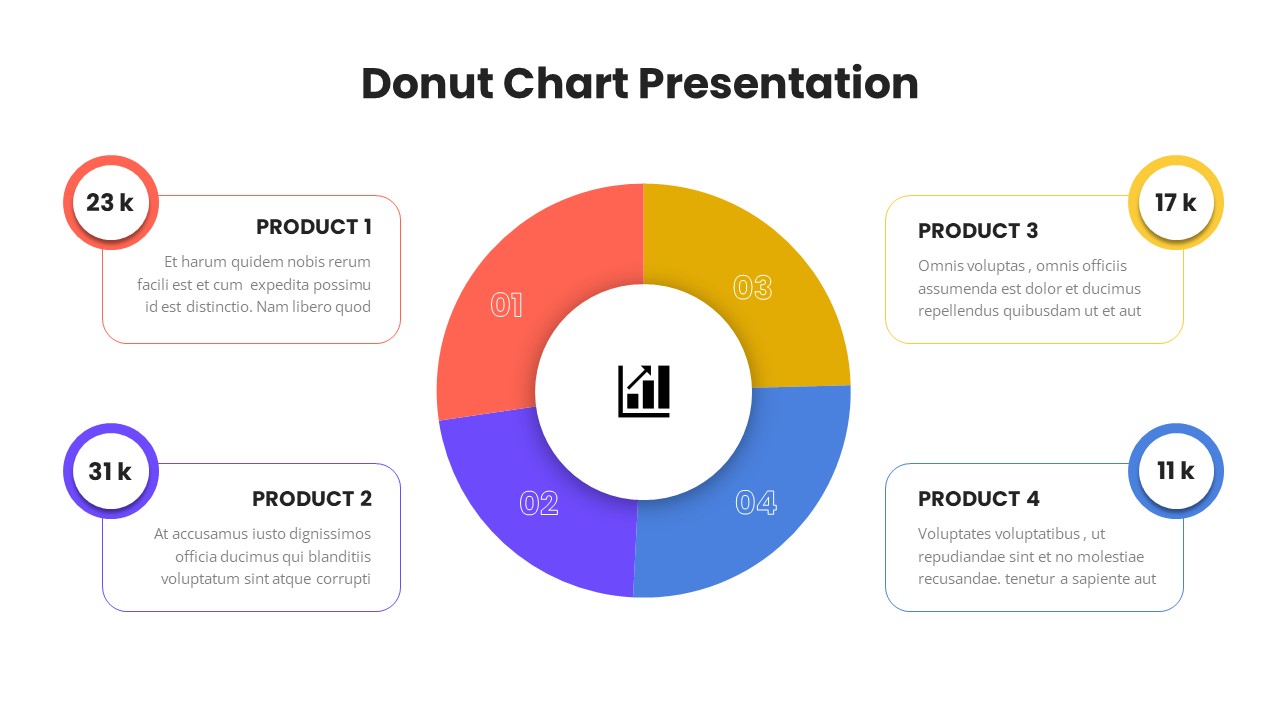
Donut Chart Presentation Template
Pie & Donut
Premium
-
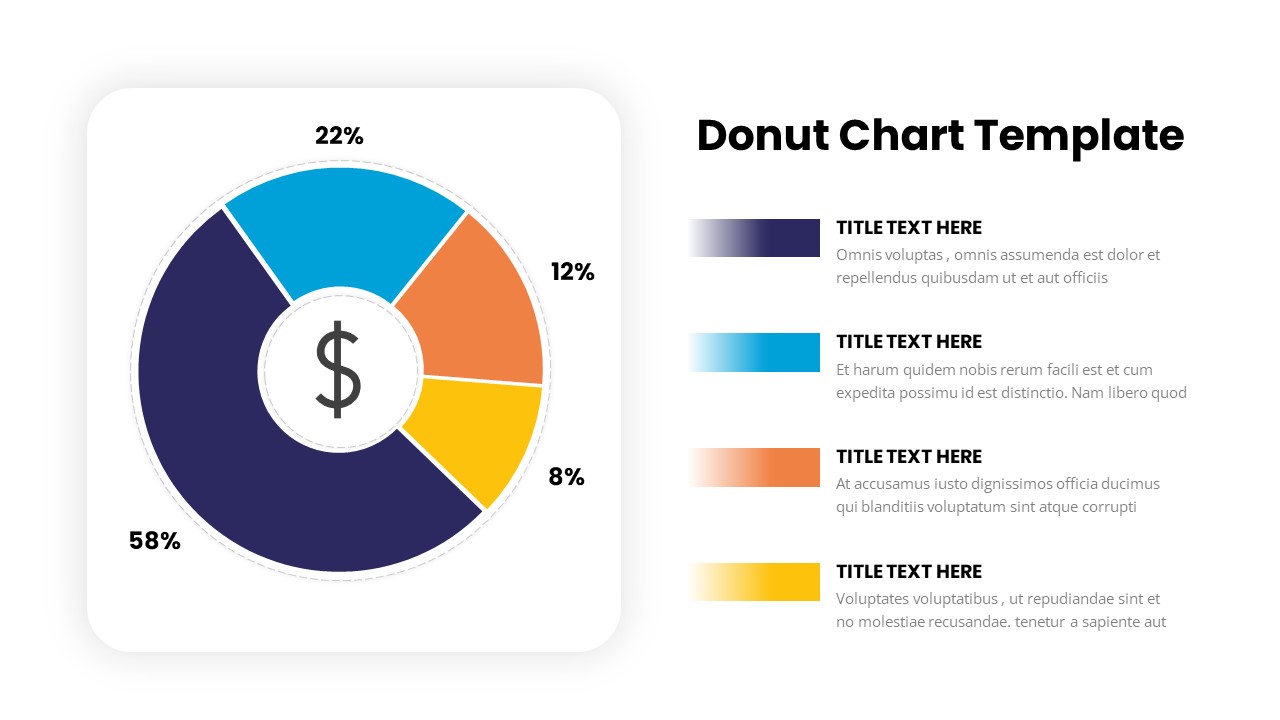
Donut Chart PowerPoint Template
Pie & Donut
Premium
-
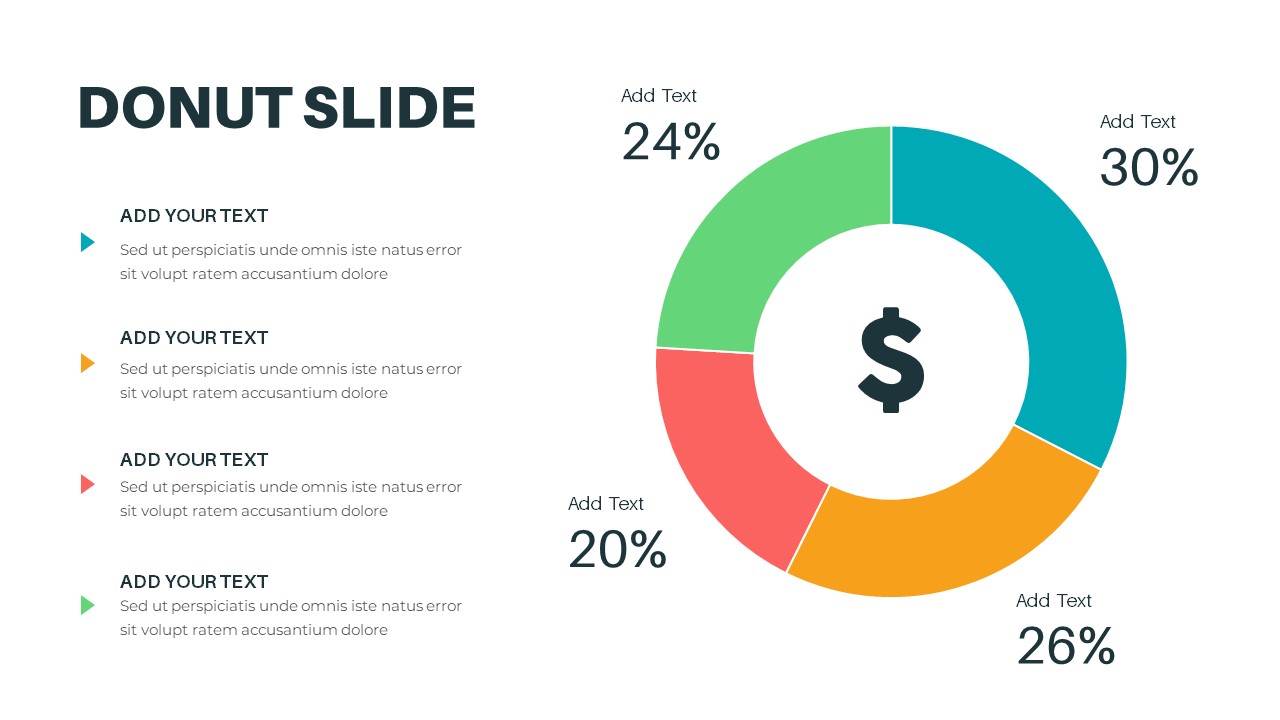
Donut Diagram PowerPoint Template
Pie & Donut
Premium
-
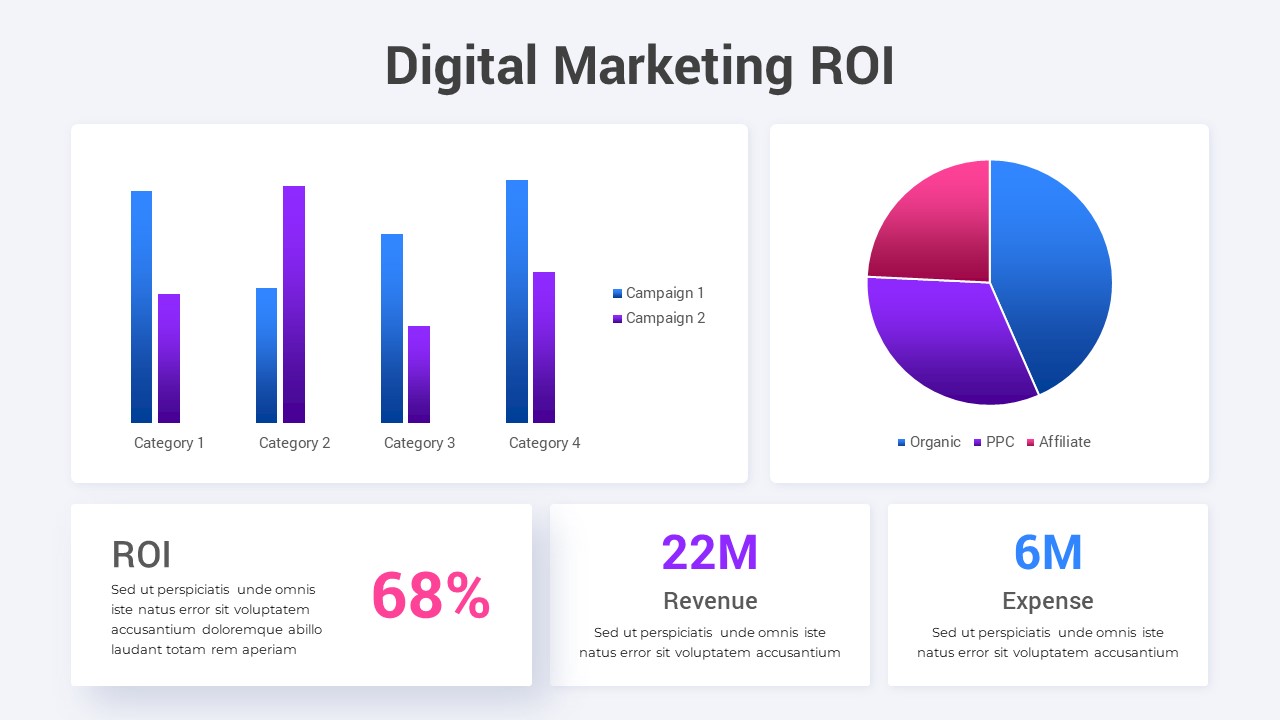
Digital Marketing ROI Template
Infographic
Premium
-
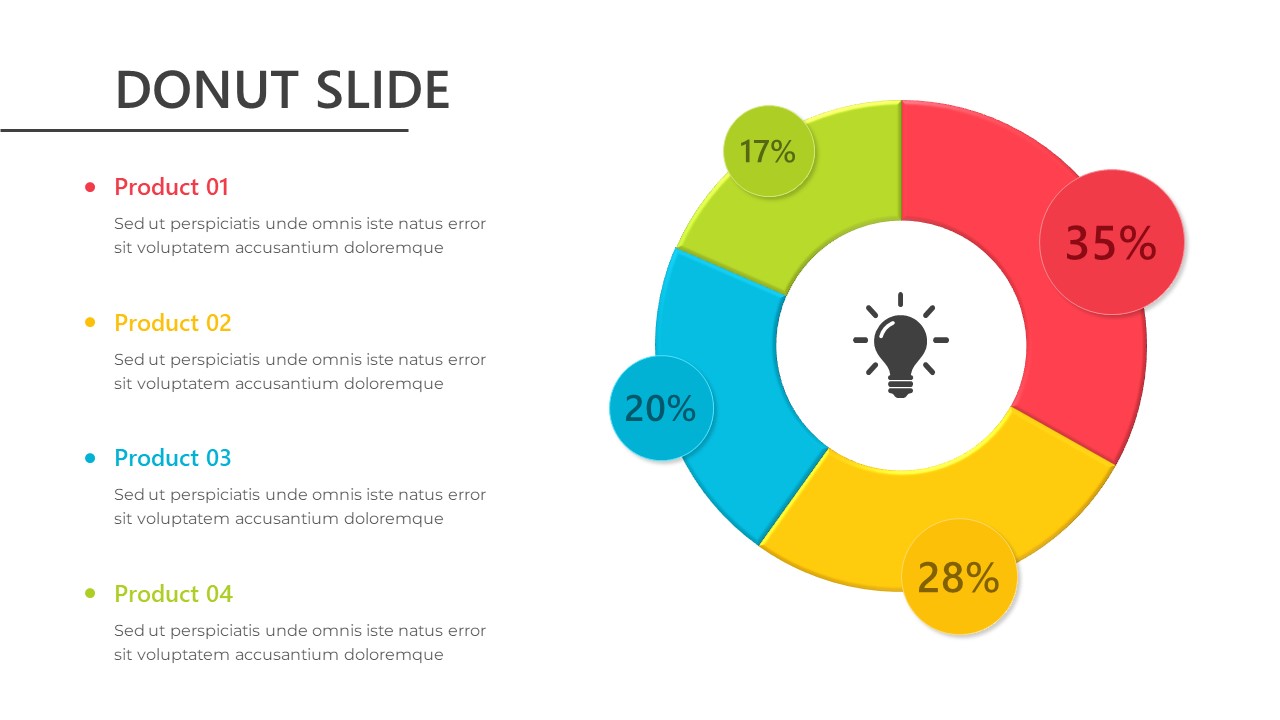
Donut Chart Template for PowerPoint
Pie & Donut
Premium
-
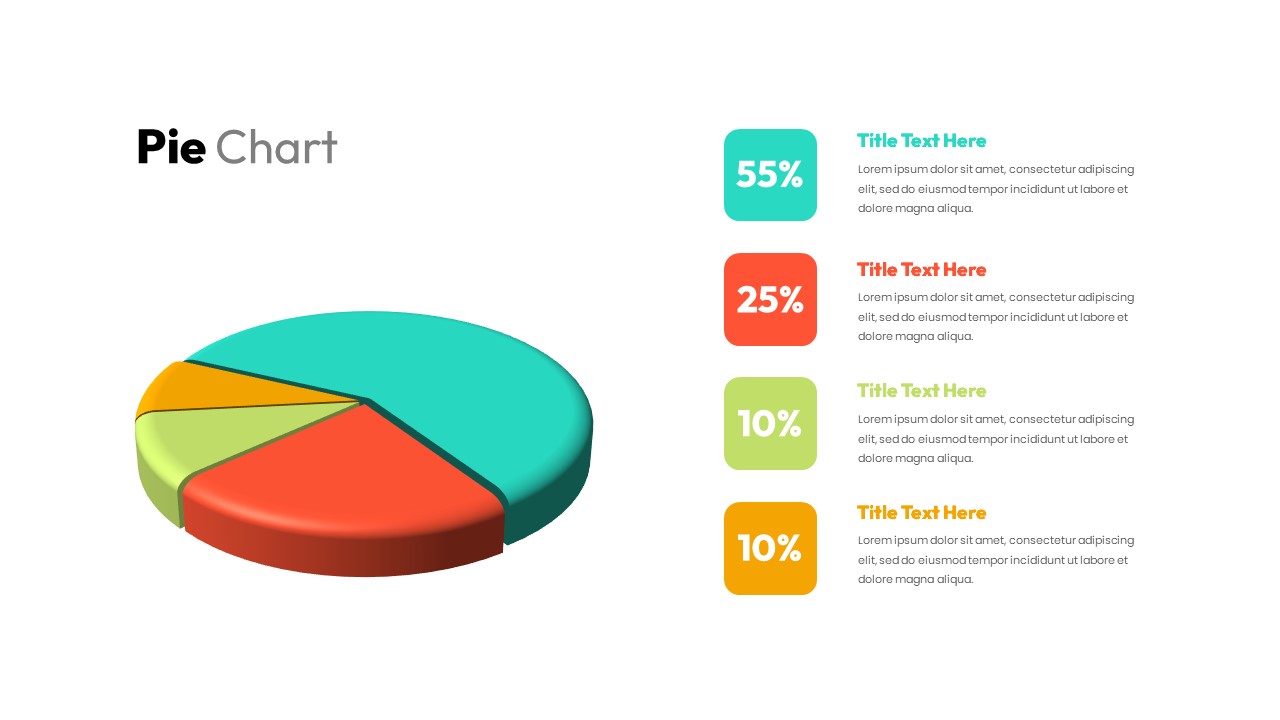
Pie Chart Template For PowerPoint
Pie & Donut
Premium
-
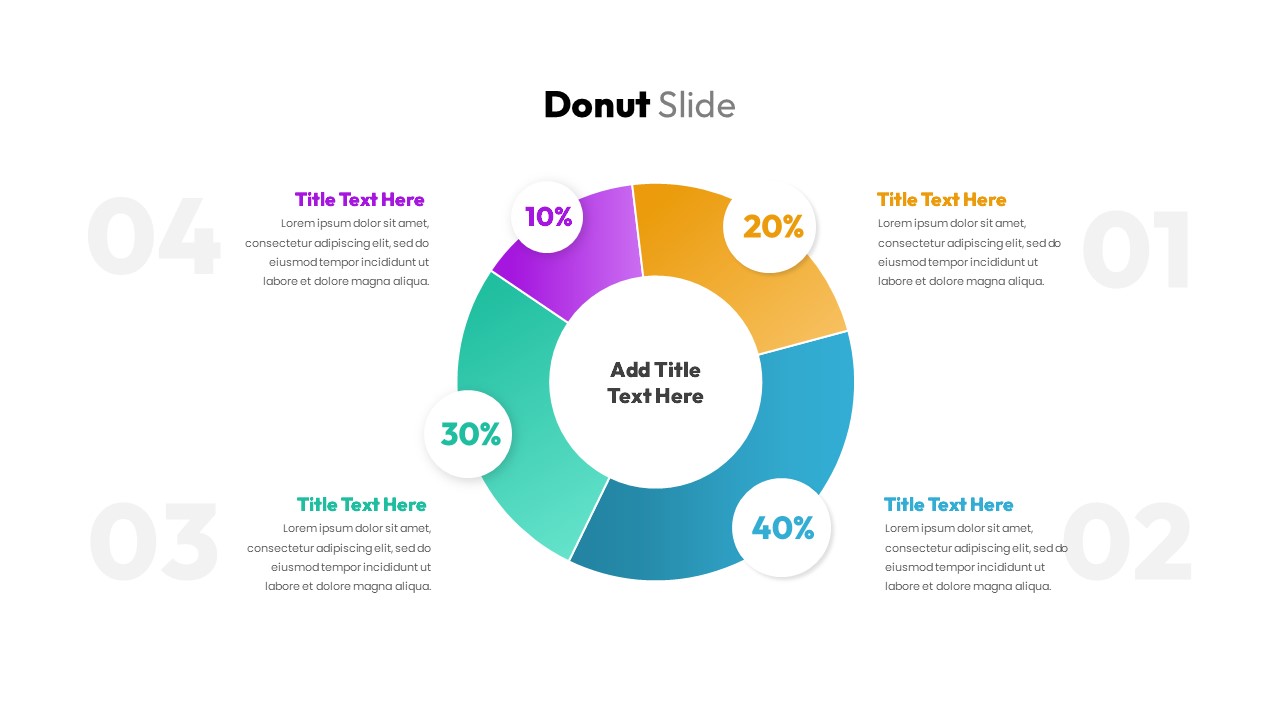
Donut Slide PowerPoint Template
Pie & Donut
Premium
-

KPI Dashboard Presentation Template
Infographic
Premium
-
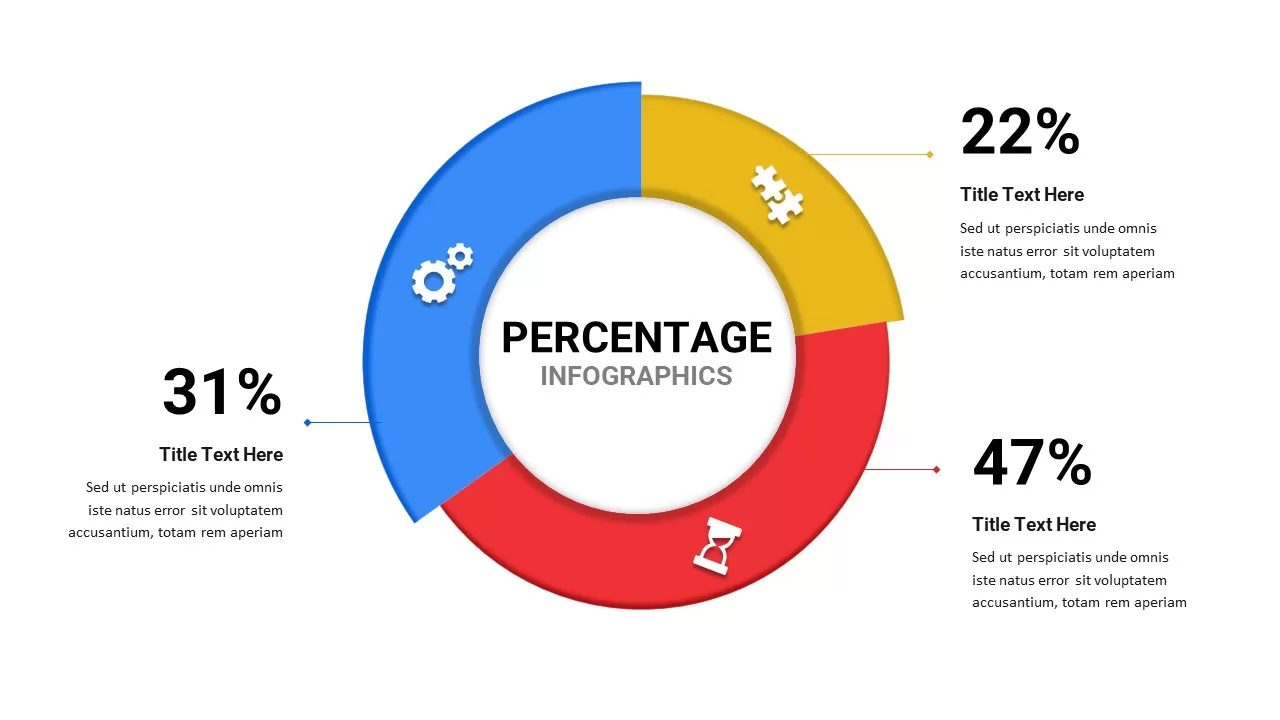
Percentage Infographics Free
Infographic
Free
-

Dashboard Template for PowerPoint Presentation
PowerPoint Charts
Premium
-
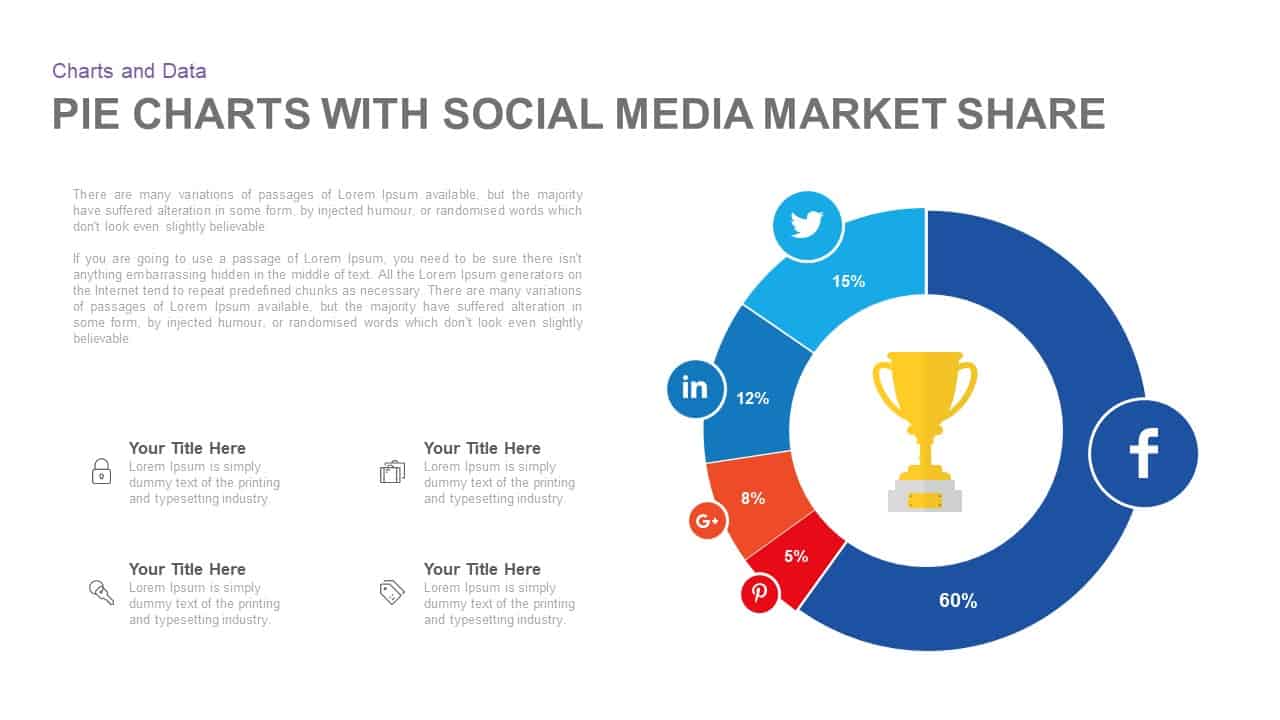
Pie Chart with Social Media Market Share PowerPoint and Keynote Template
Circular Diagrams
Premium
-
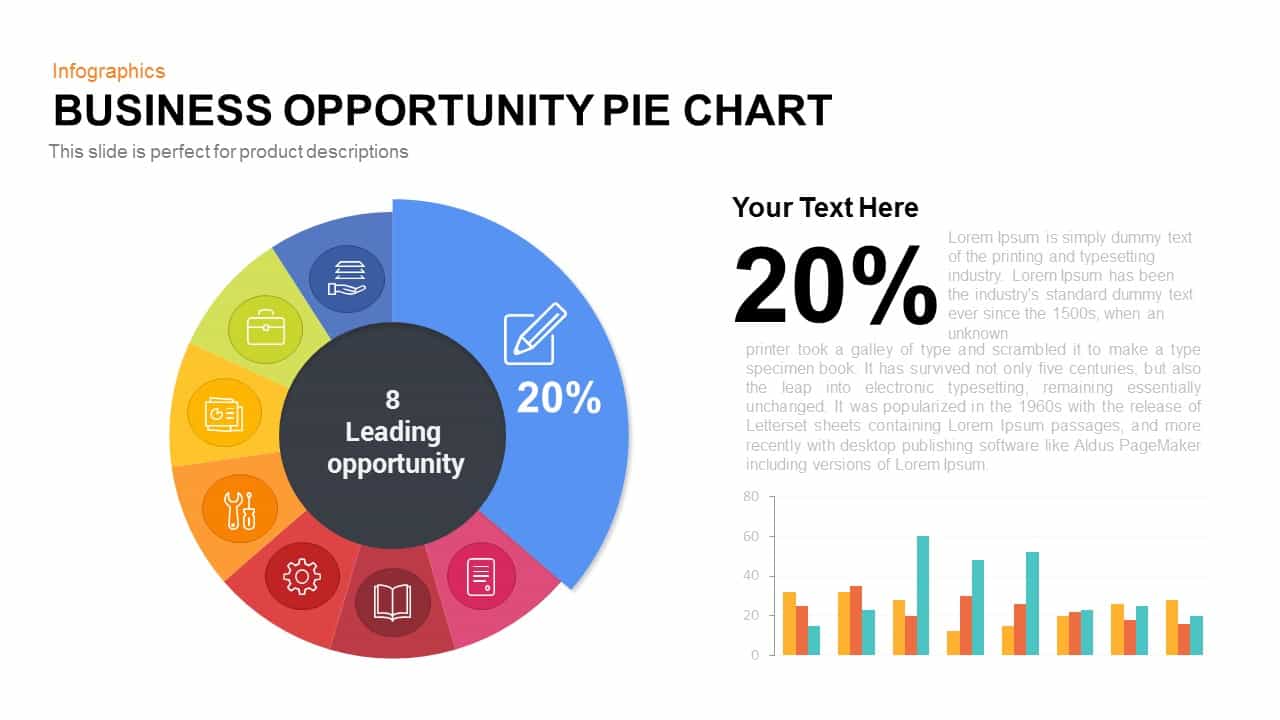
Business Opportunity PowerPoint Pie-Chart Template
Business Models
Premium
-
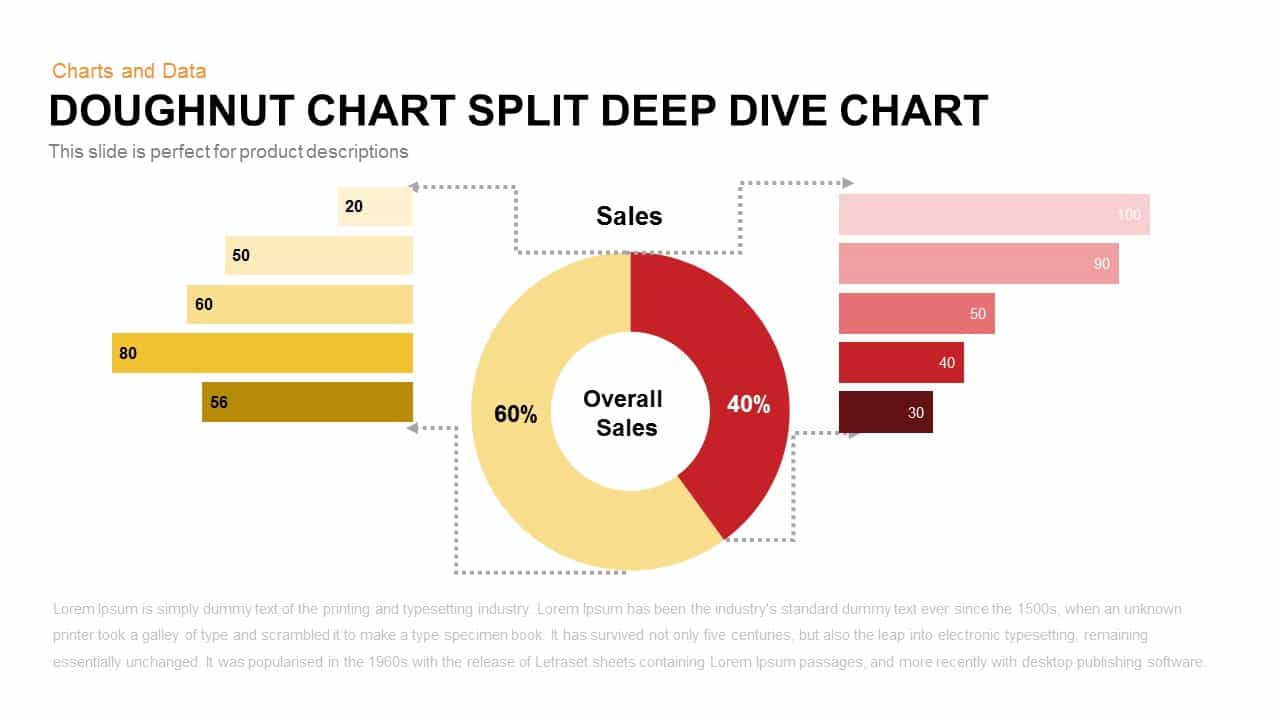
Donut Chart Split Deep Dive Chart Template For PowerPoint and Keynote
Keynote Templates
Premium
-
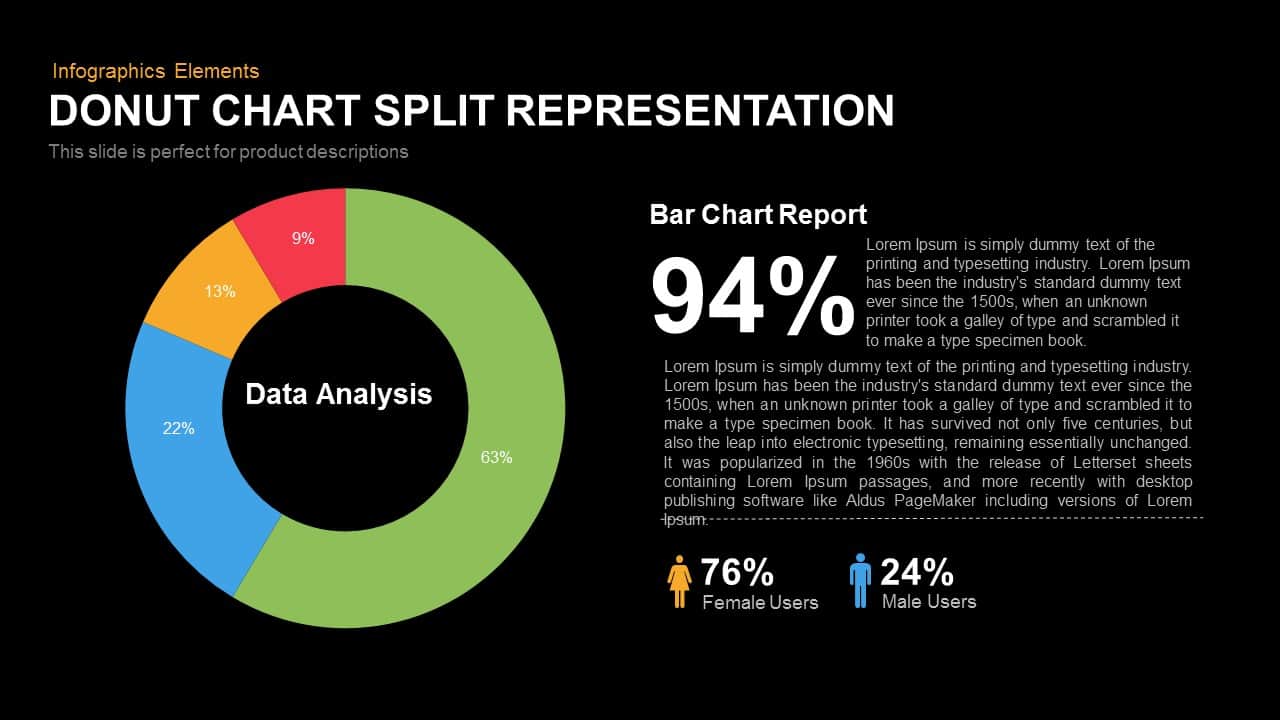
Split Representation Donut Chart Template for PowerPoint and Keynote
Keynote Templates
Premium
-
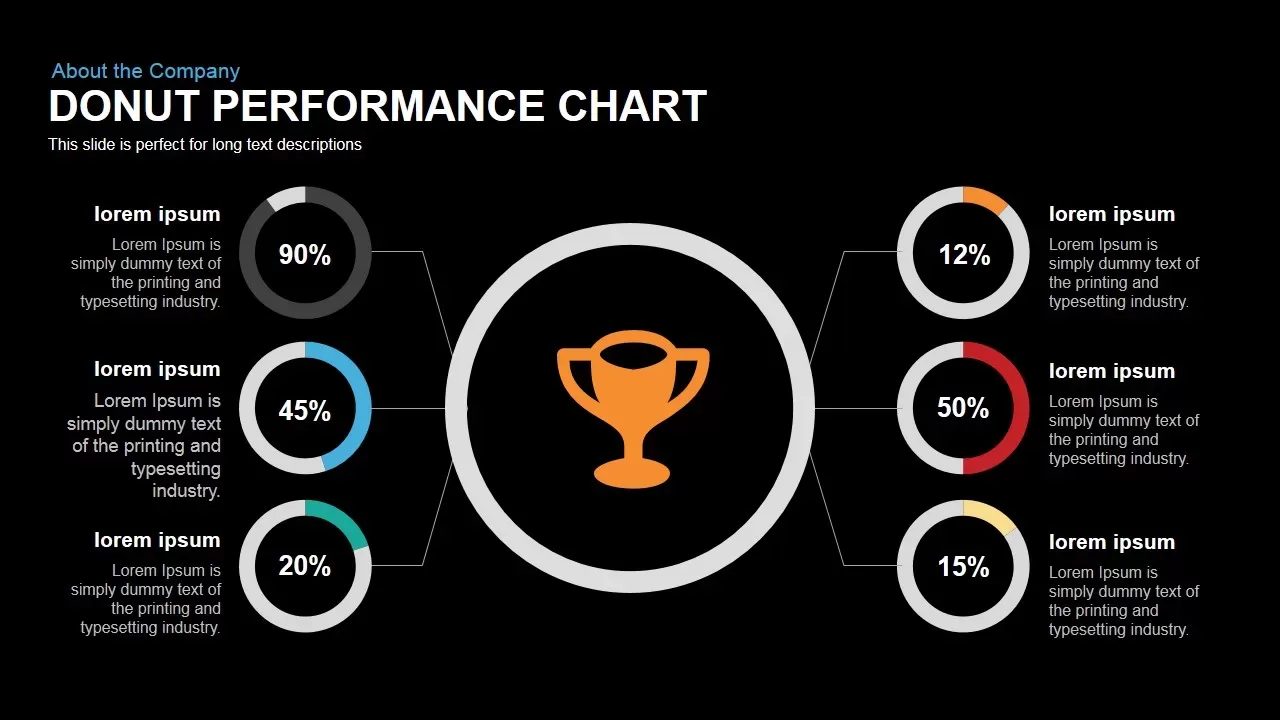
Donut Chart Performance PowerPoint Template and Keynote Slide
Pie & Donut
Premium
-
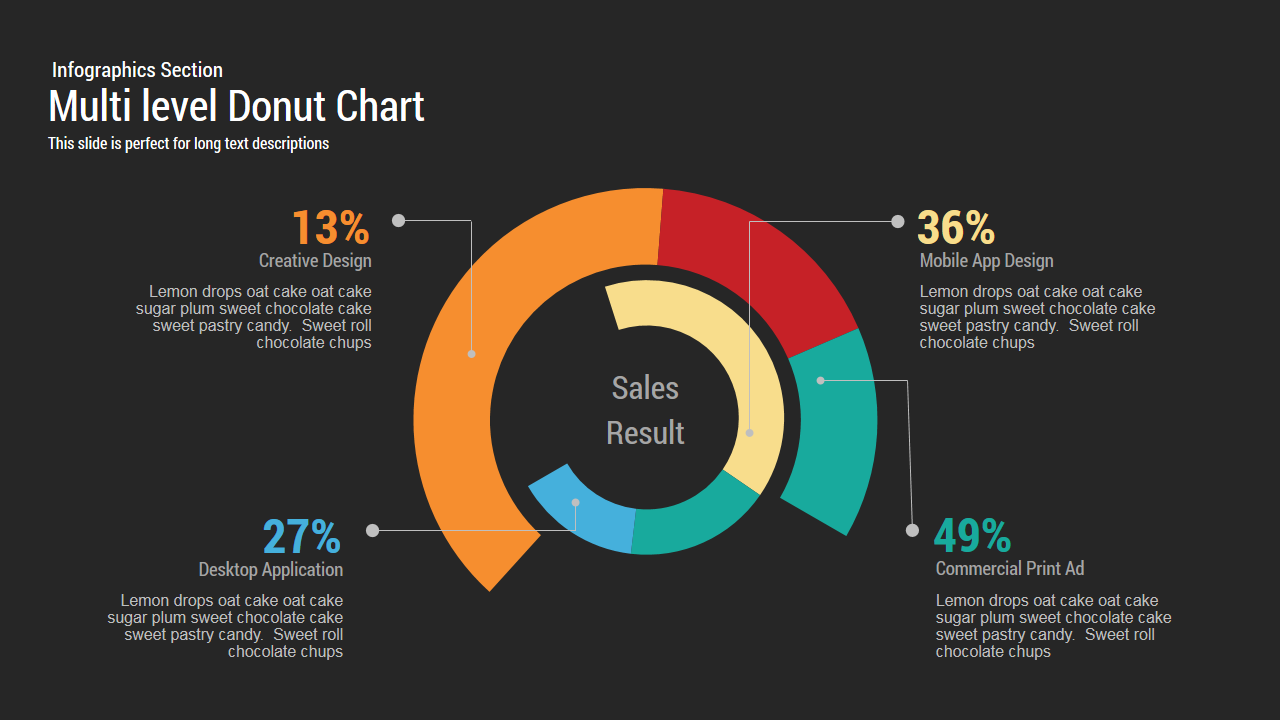
Multi level Donut Chart Template for PowerPoint and Keynote
PowerPoint Charts
Premium
-
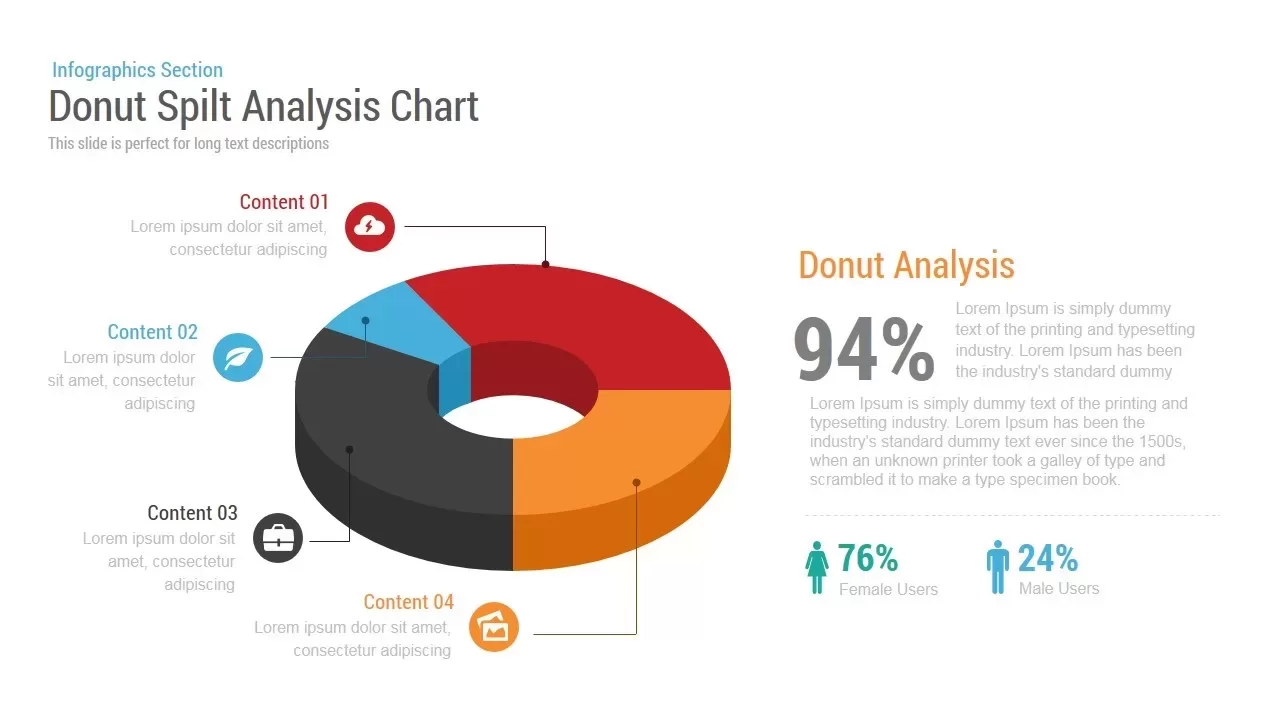
Donut Split Analysis Chart PowerPoint Template and Keynote Slide
Infographic
Premium
-

Circle Chart Infographic PowerPoint Template and Keynote
Infographic
Premium
-
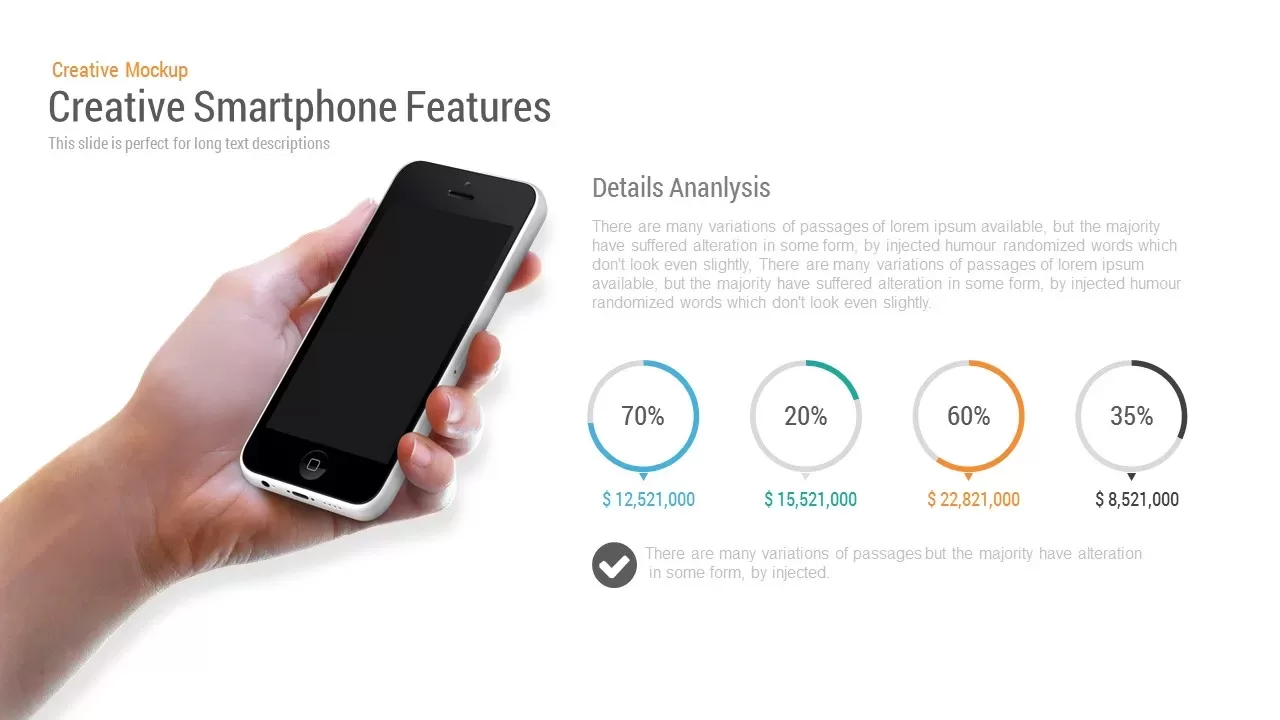
Creative Smartphone Feature PowerPoint Template and Keynote Slide
Mock Up
Premium
-
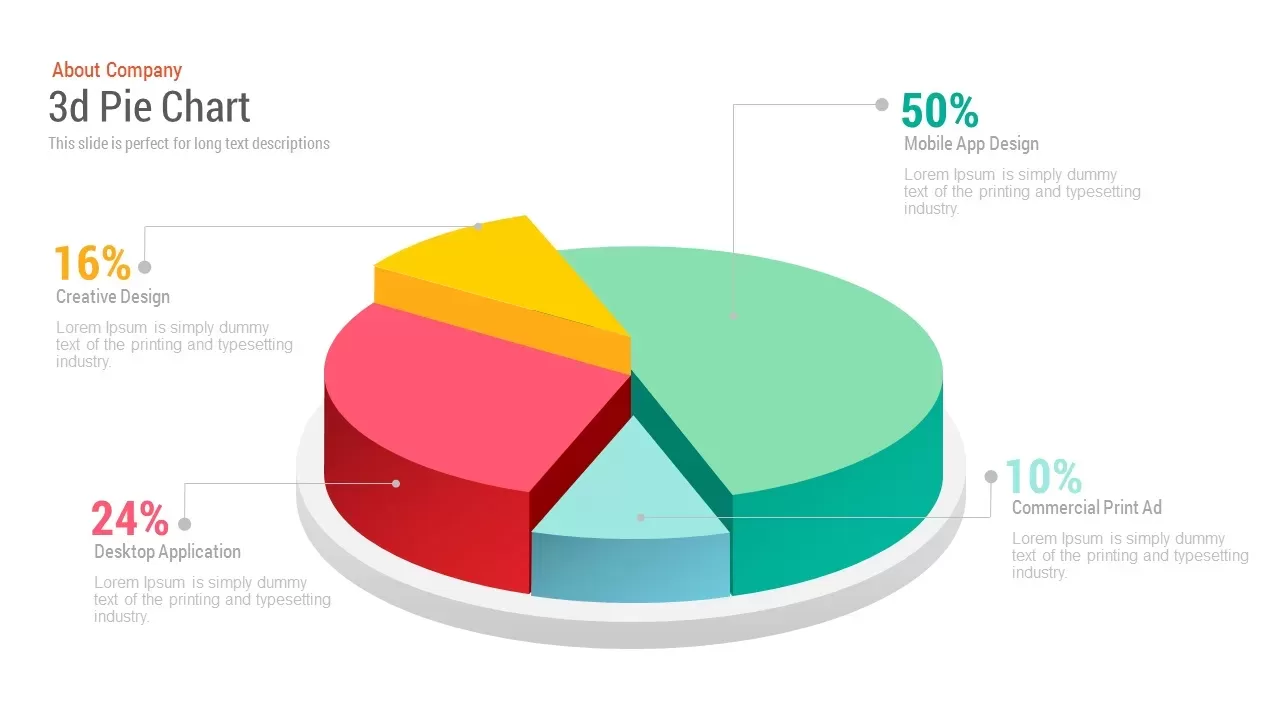
Free 3d Pie Chart PowerPoint Template & Keynote slide
Pie & Donut
Free


